Health
Vol.6 No.1(2014), Article ID:42471,8 pages DOI:10.4236/health.2014.61018
The effects of increased dietary fiber intake on the self-reported quality of life of school-age children
![]()
1Department of Nutrition Science, Purdue University, West Lafayette, USA; *Corresponding Author: kranz@purdue.edu
2Department of Statistics, Purdue University, West Lafayette, USA
Copyright © 2014 Mary Brauchla et al. This is an open access article distributed under the Creative Commons Attribution License, which permits unrestricted use, distribution, and reproduction in any medium, provided the original work is properly cited. In accordance of the Creative Commons Attribution License all Copyrights © 2014 are reserved for SCIRP and the owner of the intellectual property Mary Brauchla et al. All Copyright © 2014 are guarded by law and by SCIRP as a guardian.
Received 23 November 2013; revised 26 December 2013; accepted 12 January 2014
ABSTRACT
The aim of this community-based, randomizedcontrolled prospective nutrition intervention study was to assess the impact of serving high-fiber snacks twice a day to a sample of school-age children on their dietary fiber intake and healthrelated quality of life (HRQOL) scores. Participants (n = 81) were children aged 7 - 11 years. Children were randomized to receive two highfiber snacks per day for eight weeks (intervention) or to continue eating their regular snacks (control). At baseline and post-intervention, usual dietary intake data were collected via repeated 24-hour dietary recalls and HRQOL was assessed using the PedsQL™ Pediatric Quality of Life Inventory. Statistical analysis to assess significant changes in dietary intake as well as self-reported quality of life was conducted using twosided student’s t-tests; significance level was set at p < 0.05. Dietary fiber intake increased significantly by 2.41 grams/day in the intervention group. The mean increase in the physical scale score of the PedsQL from baseline to postintervention was significantly greater for the intervention as compared to control group. This study indicates that providing high-fiber snacks to elementary-school children can effectively increase dietary fiber consumption and may lead to an improved physical quality of life. Further research is needed regarding the impact of nutrition on health-related quality of life.
KEYWORDS
Quality of Life; Children; Fiber Intake; School Snacks
1. INTRODUCTION
Data on health-related quality of life (HRQOL) capture the physical, emotional, and social dimensions of well-being. Children may self-report HRQOL, providing unique insight into how they perceive their own HRQOL; or, information may be gathered via parent proxy-reports, which reflect caregivers’ impressions of the external state of the child [1]. HRQOL assessment tools have historically been employed in acutely and chronically ill children [2], but are now increasingly utilized in healthy populations. Accordingly, a variety of questionnaires are available to assess both general and disease-specific HRQOL in child populations [2]. While the value of assessing healthy children’s self-reported HRQOL has become increasingly recognized in the research and clinical communities, very few studies have focused on the impact of nutrition on HRQOL in healthy child populations.
Overweight and obesity are factors that affect HRQOL and are the result of an imbalance between caloric intake and expenditure. The established effects of overweight and obesity on children’s HRQOL may provide insight into the potential relationship between nutrition and HRQOL. Overweight and obese children generally selfreport a lower HRQOL than their normal-weight peers [3-7], although this impact may vary depending on the degree of overweight and the aspect of HRQOL examined [8]. Weight-loss interventions utilizing diet and/or exercise components can improve HRQOL scores, but the complex relationship between the effects of the weight loss itself and/or the improved feeling of well-being associated with exercising, such as dopamine release, makes it difficult to determine the contribution of dietary changes to HRQOL in weight loss situations [5].
One study that specifically examined the effects of diet on HRQOL found that adolescents who consumed <35% of daily caloric intake from fat reported higher quality of life on the emotional functioning scale of the Pediatric Quality of Life Inventory™ (PedsQL™) compared to adolescents with higher fat intakes [6]. Costarelli et al. noted that children adhering to a Mediterranean-style diet, (assessed by daily fruit and vegetable intake, weekly fish and legume intake, and limited consumption of fast food and sweets) reported higher HRQOL on the Kidscreen- 27 questionnaire [9]. Carson et al. suggested that diet may impact diet-related quality of life by a variety of channels, including social interactions, personal satisfaction/satiety, economics, physical, and psychological factors [10].
Another well-known and important factor contributing to children’s HRQOL is their digestive health status. Problems regarding digestive health are very common among children and negative symptoms can be alleviated with nutrition therapy. For example, as much as 10% of the child population in the United States suffers from chronic constipation, a condition is associated with lower self-perceived quality of life [11]. Consuming high-fiber foods is recommended for the prevention and treatment of functional constipation as high-fiber foods increase fecal bulk and reduce transit time through the gut. Whole grain is one source of dietary fiber, and intake of whole grain has been shown to have a prebiotic effect on beneficial gut bacteria [12,13]. Adequate dietary intake of whole grain is recommended for general digestive health and is used as a marker of diet quality. Furthermore, it is generally recognized as beneficial in the prevention and treatment of heart disease and diabetes [14,15]. While multiple studies report increased grain intake in both youth [16] and adults [14] over the past 30 to 50 years, intake of dietary fiber in the US population has remained suboptimal [16-18]. Currently, less than 3% of children meet the Institute of Medicine’s Dietary Reference Intake Adequate Intake (AI) recommendation of 14 grams of fiber per 1,000 kcal of total energy consumed [19], which is equivalent to 25 g/day for children 4 - 8 years of age, 26 g/day for females ages 9 - 13 years, and 31 g/day for males ages 9 - 13 years, respectively [20].
The purpose of this study was to evaluate whether elementary-school children’s dietary fiber intake and selfreported quality of life could be affected by providing twice daily high-fiber snacks. Therefore, we conducted a community-based, cluster-randomized, controlled, prospective nutrition intervention study to address the following specific aims:
1) to determine if providing high-fiber whole-grain snacks twice a day will lead to a significant increase in dietary fiber intake in children ages 7 - 11 years2) to determine if children’s self-reported and parent proxy-reported HRQOL are affected by the consumption of two high-fiber snacks/day for eight weeks.
We hypothesized that providing high-fiber snacks would lead to higher dietary fiber intake and would improve children’s self-reported HRQOL. Considering the benefits of fiber consumption, we hypothesized that even in the absence of symptoms of clinical constipation, increased fiber intake would be beneficial to children’s HRQOL.
2. METHODS
This study was nested within a larger, randomized controlled, community-based nutrition intervention trial. The Institutional Review Board for Human Research (IRB) at Purdue University approved this study.
2.1. Participants and Recruitment
The Tippecanoe County school board, administrators, and teachers agreed to participate in this study. Participants (n = 81) were boys and girls attending a rural elementary school in northwestern Indiana. Participants were recruited from eleven 2nd - 5th grade classrooms. The exclusion criteria were having food allergies, digestive diseases such as Crohn’s disease or chronic diarrhea, or use of medication(s) that would alter/affect the child’s digestive function. Children were recruited by posting flyers and distributing parental consent materials to children to take home to their parents. Consented childparent dyads completed a screener survey to determine the presence of exclusion criteria and provided basic socio-demographic information using a questionnaire with standard questions adopted from the National Health and Nutrition Examination Survey (NHANES).
2.2. Procedures
Participants were randomized by classroom into a control group or intervention group. The intervention group received a choice of two high-fiber snacks twice a day for eight weeks during the school’s snack times (one in the morning, one in the afternoon) while the control group consumed their usual snack foods. Children in the intervention group received their snacks at the school on weekdays, where snack choices and consumption of the study foods were monitored by a research assistant. On Fridays, snacks were packed out for each weekend day for each participant (two options per snack occasion, two snack occasions per day) and children were instructed not to share the snacks with any family members or friends and to return all uneaten portions on the following Monday so that research staff could record them.
To determine usual food intake and the nutritional impact of the intervention on dietary fiber consumption, dietary intake was assessed at three time points: pre-intervention (baseline), mid-intervention (4 weeks), and post-intervention (8 weeks) using two 24-hour recalls, one on a weekday and one on a weekend day (FridaySunday). Dietary intake estimates were calculated by generating the two-day average dietary intake at each time point.
2.3. Measure of Quality of Life
The Pediatric Quality of Life Inventory 4.0 Generic Core Scales is a widely used validated tool that assesses HRQOL in healthy children as well as those who have chronic health conditions [21,22]. The PedsQL may be used to collect self-report data from children ages 5 - 18 and/or parent proxy-report for children ages 2 - 18 [1]. Children and parents completed the PedsQL assessment tool at baseline and at post-intervention. Parent surveys were completed and returned to the school within three weeks after having received the survey.
Each PedsQL survey is comprised of 23 questions divided into four scales: physical functioning (8 items), emotional functioning (5 items), social functioning (5 items), and school functioning (5 items). Each of the 23 questions is rated by the child (or parent) on a 5-point Likert scale (0 - 4), with zero indicating that the item is Never a Problem and four indicating that it is Almost Always a Problem. Survey answers are reverse scored and linearly transformed to a 0 - 100 scale (Table 1). With this scaling, higher scores indicate better quality of life. Scores for the four scales may be reported as a total score or as a physical and a psychosocial summary score. The psychosocial summary score is comprised of participants’ responses to questions in the emotional, social, and school functioning scales [21]. In addition, parents and children completed a bowel regularity survey at baseline, mid-intervention, and post-intervention. At baseline only two children in the control group and three in the intervention group reported a score of 10 or less on the bowel health survey, (out of a possible range of 6 - 30, with higher scores representing better bowel function), suggesting that the children generally had good gastrointestinal heath and were not suffering from constipation.
2.4. Study Foods
The snacks provided to the children in the intervention group were commercially available foods that had been selected based on fiber content and acceptability in children. To qualify as a study food, the snack had to contain between three and nine grams (g) of fiber per serving. The foods included breakfast cereals, breads, crackers and cereal bars (Table 2). At each snack occasion, two food
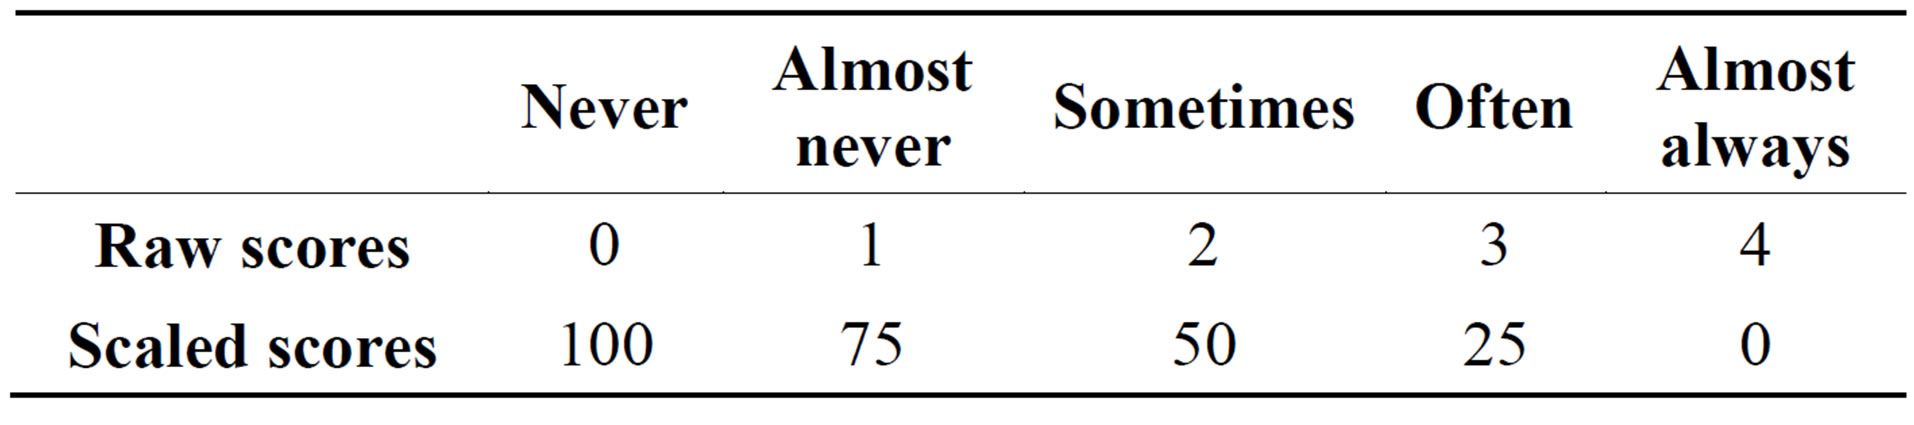
Table 1. Scoring scheme: point allocation for each response.
choices were offered that differed by no more than one gram of fiber; the total fiber content of the snacks served throughout the day ranged between 10 and 12 grams regardless of which snacks the children chose. In addition to the high-fiber snacks, one cup of skim milk was provided at each snack occasion to help children meet the need for increased fluid intake.
2.5. Measures and Statistical Analysis
Of the 81 consented participants, four failed to return the PedsQL survey and were therefore excluded from analysis. Per the PedsQL guidelines for interpretation and analysis of missing data, if >50% of the questions in a scale were not answered the scale score was not computed (“missing data”). If ≤50% of the questions in a scale were unanswered, this was classified as “skipped data” and the unanswered items were imputed by calculating the mean of the completed items in the scale to replace the skipped questions. PedsQL scores were imputed for children who completed the PedsQL at baseline but not at post-intervention (n = 7) using a simple linear regression analysis. In short, total, physical, and psychosocial scores were plotted with baseline being the independent variable and post-intervention scores as the dependent variable. Using the resulting regression equation, missing scale scores were replaced.
The change in scores between baseline and post-intervention was determined by calculating the score difference for each participant. These differences were then averaged for the intervention and control groups, respectively, and a two sided student’s t-test was conducted to test the null hypothesis that the differences between baseline and post-intervention scores were equal to zero. The level of significance was set at p-values < 0.05.
3. RESULTS
Participating children were 7 to 11 years old (mean = 9.3, SD = 1). Racial and ethnic backgrounds were representative of the school population and reflect the demographic of this area (Table 3).
At baseline, 16.9% of parents (n = 13) failed to return the PedsQL survey as compared to just 5.2% of children (n = 4). However, 3.9% of children returned surveys with “missing” responses for one or more scales (n = 3) and 5.2% of children “skipped” questions in one or more scales (n = 4). None of the parent respondents returned surveys with missing or skipped answers at baseline. At post-intervention, 16.9% of parents (n = 13) failed to return the survey, as compared to 10.4% of children (n = 8). One parent returned a survey with missing responses and one returned a survey containing skipped questions; one child returned a survey with missing responses, and 7.8% of children (n = 6) returned surveys with skipped
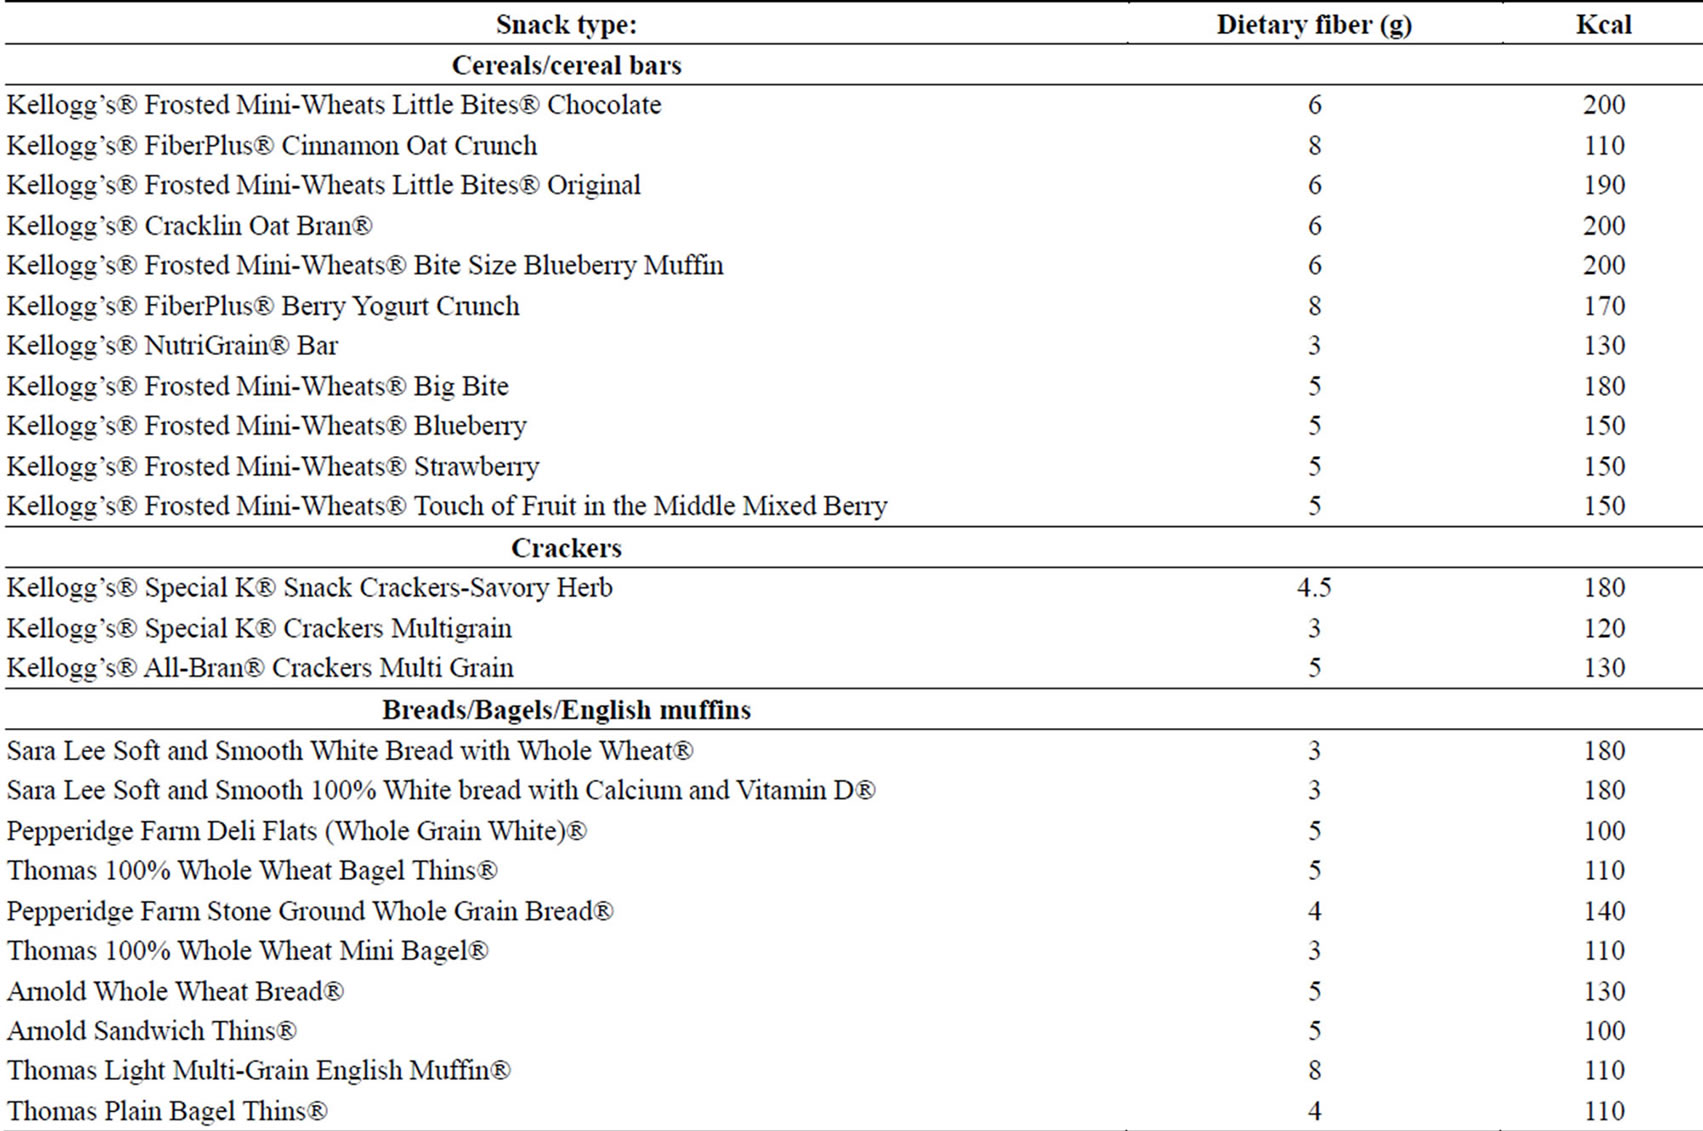
Table 2. Snack items offered, grams of fiber per serving and kcal per serving.
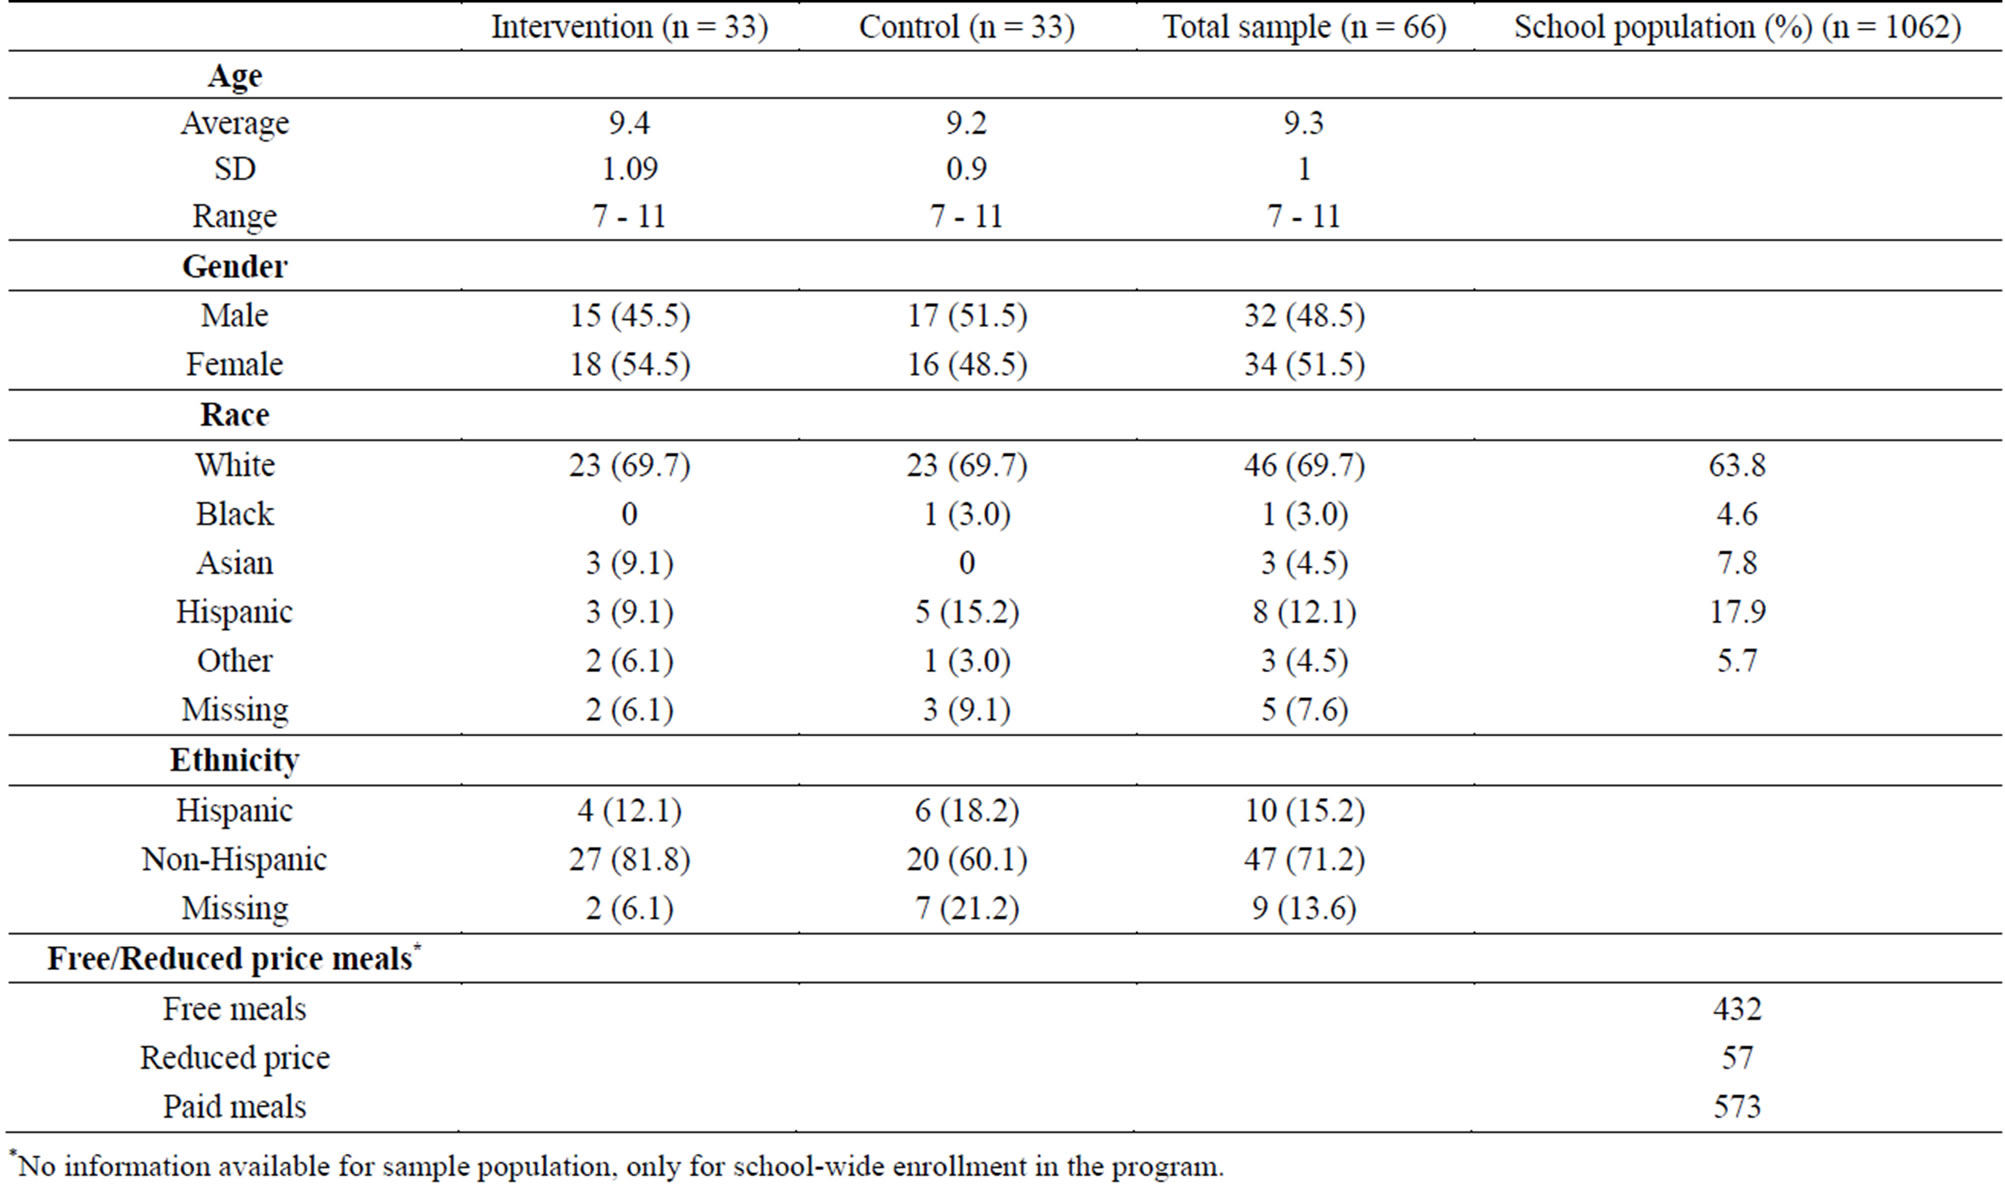
Table 3. Demographic characteristics of the sample population and the school’s population.
*No information available for sample population, only for school-wide enrollment in the program.
questions in one of the scales.
Analysis of correlations between parent and child PedsQL scores revealed low to medium effect sizes for total parent/child scores and for parent/child physical and psychosocial summary scores at baseline, (0.09 - 0.35); correlations rose post-intervention (0.19 - 0.70). Based on the higher percentage of survey non-response among parents, the lack of large correlations between parent and child scores at baseline, and children’s ability to selfreport HRQOL information at this age [16], the analysis focused on children’s responses only.
After removing seven participants with missing baseline data and removing data from four participants with outlying PedsQL scores, n = 66 children remained in the analysis (51.5% girls), with 33 participants each in the intervention and control groups. Skipped child responses were imputed using the methods described above.
3.1. Fiber Intake
Average daily dietary fiber intake at each time point when dietary recalls were completed is shown in Figure 1. During 94% of all snacking occasions, children chose at least one snack and consumed 50% or more of the item. Although the sample was randomized by classroom, fiber intake was significantly higher in the intervention group at baseline (p = 0.035). At mid-intervention, mean daily fiber intake in the intervention group increased by 2.41 g (p = 0.028) but subsequently dropped by 3.65 g (p = 0.014) at post-intervention. The average fiber intake in the control group remained constant at approximately 10 g/day throughout the entire study period.
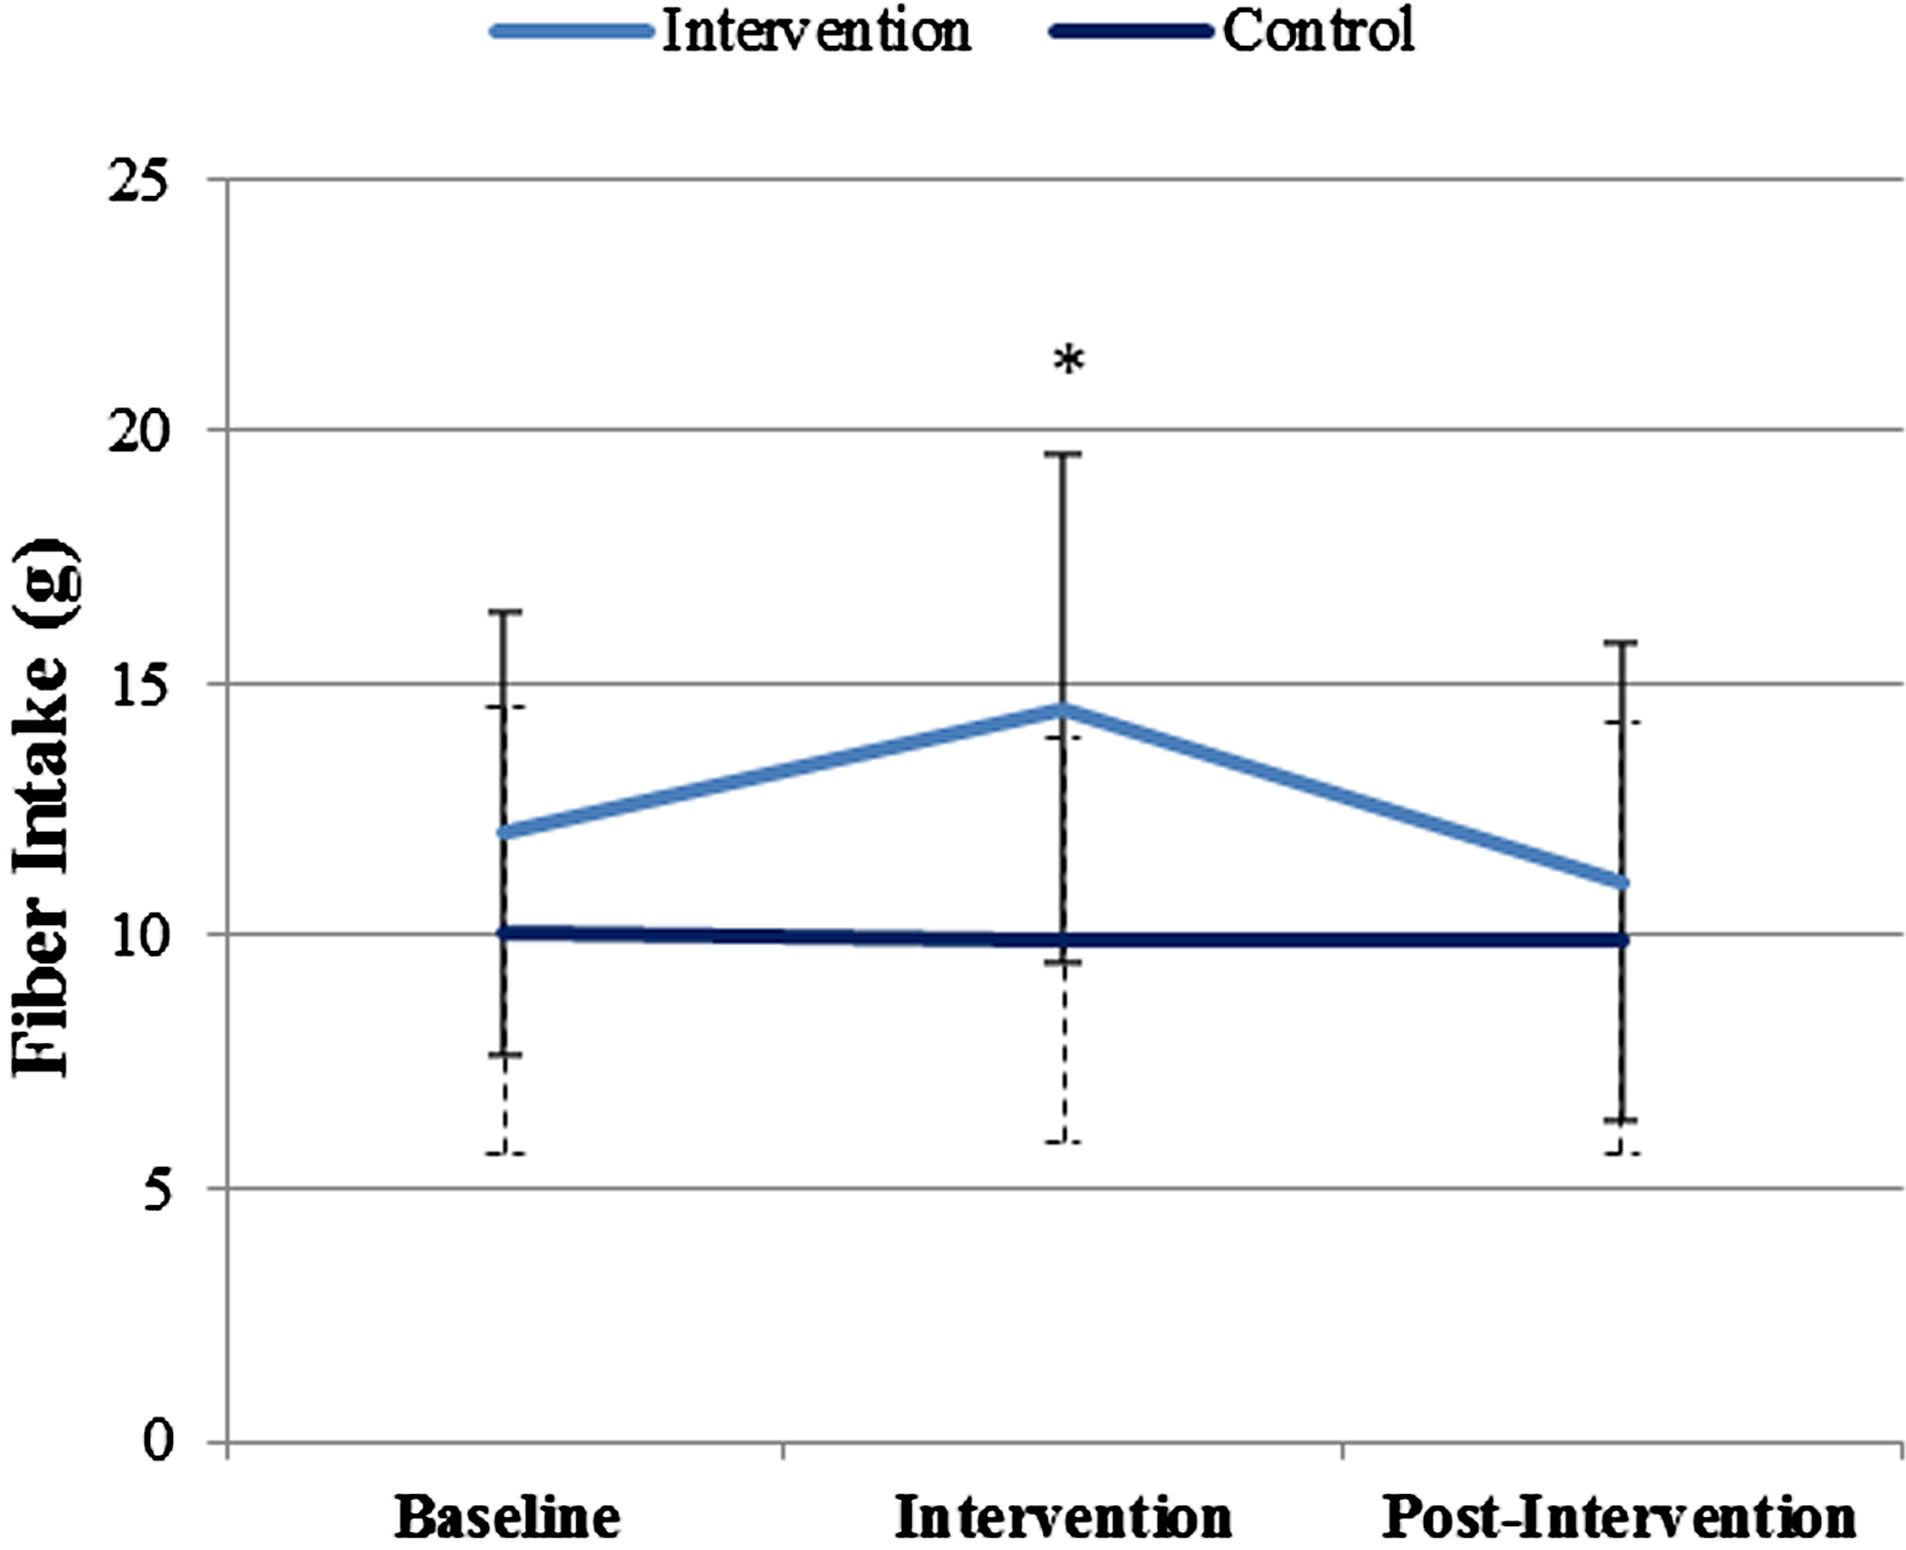
Figure 1. Fiber intake in the intervention and control groups at all time points.
Note: Average fiber intakes shown are for all diet-compliant participants within the initial group of n = 81 children. (Control group: n = 37 at baseline and intervention; n = 36 at post-intervention. Intervention group: n = 34 at baseline and intervention; n = 32 at post-intervention.)
3.2. Health-Related Quality of Life
The PedsQL physical, psychosocial, and total summary scores were compared between the intervention and control groups as well as between baseline and post-intervention. In both the intervention and the control group, all scores increased significantly from baseline to postintervention, with the exception of the control group’s physical score (Figure 2). No significant differences between the intervention and the control group were observed for the summary scores or total score at baseline or at post-intervention. However, the increase in the physical health scale score from baseline to post-intervention was significantly greater (indicating better self-reported physical quality of life) in the intervention vs. control group (p = 0.031) (Figure 3). An ANOVA analysis of the difference between baseline and post-intervention physical scores correcting for gender and ethnicity showed no statistically significant effects of these covariates.
4. DISCUSSION
The nutrition intervention in this study resulted in a significant increase in dietary fiber consumption when children were provided with two choices of high-fiber snacks twice per day. Although self-reported HRQOL increased in all participants, the average increase in the physical health scale score was significantly greater for children in the intervention group compared to children in the control group. This finding may be related to the association between dietary fiber and more frequent defecation and lower prevalence of constipation-related symptoms. Thus, although the majority of the population
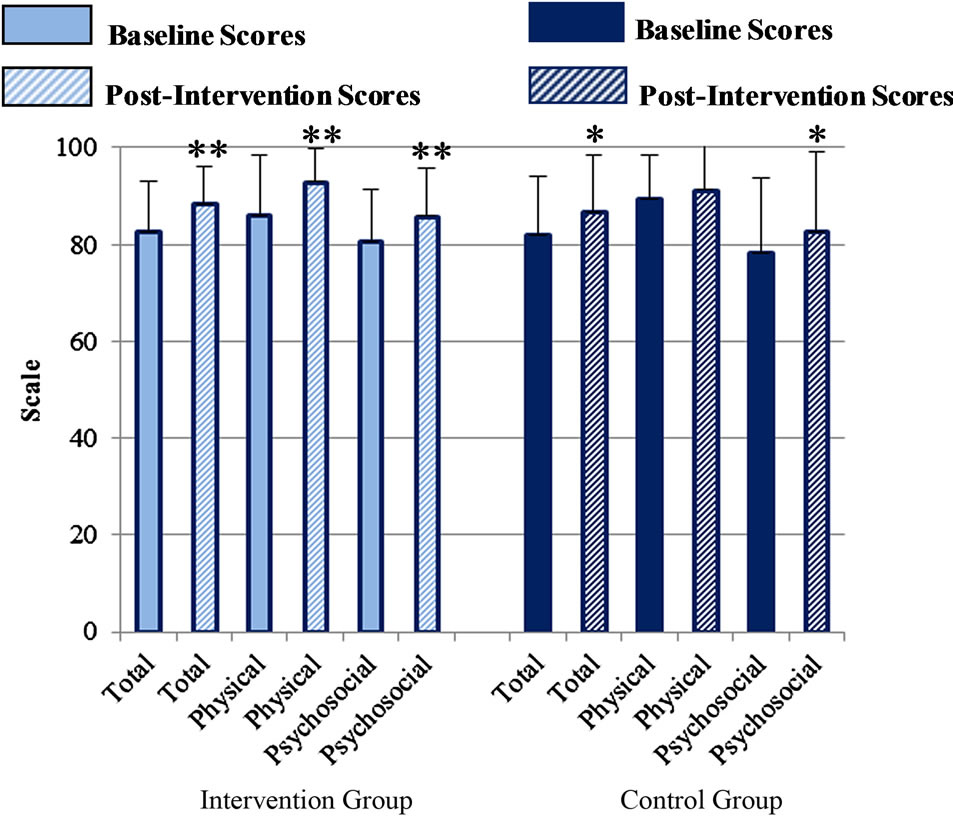
Figure 2. Total, physical and psychosocial PedsQL summary scores for the intervention group and control group, at baseline and post-intervention.
*Significantly greater than corresponding baseline score at p < 0.05; **Significantly greater than corresponding baseline score p < 0.001.
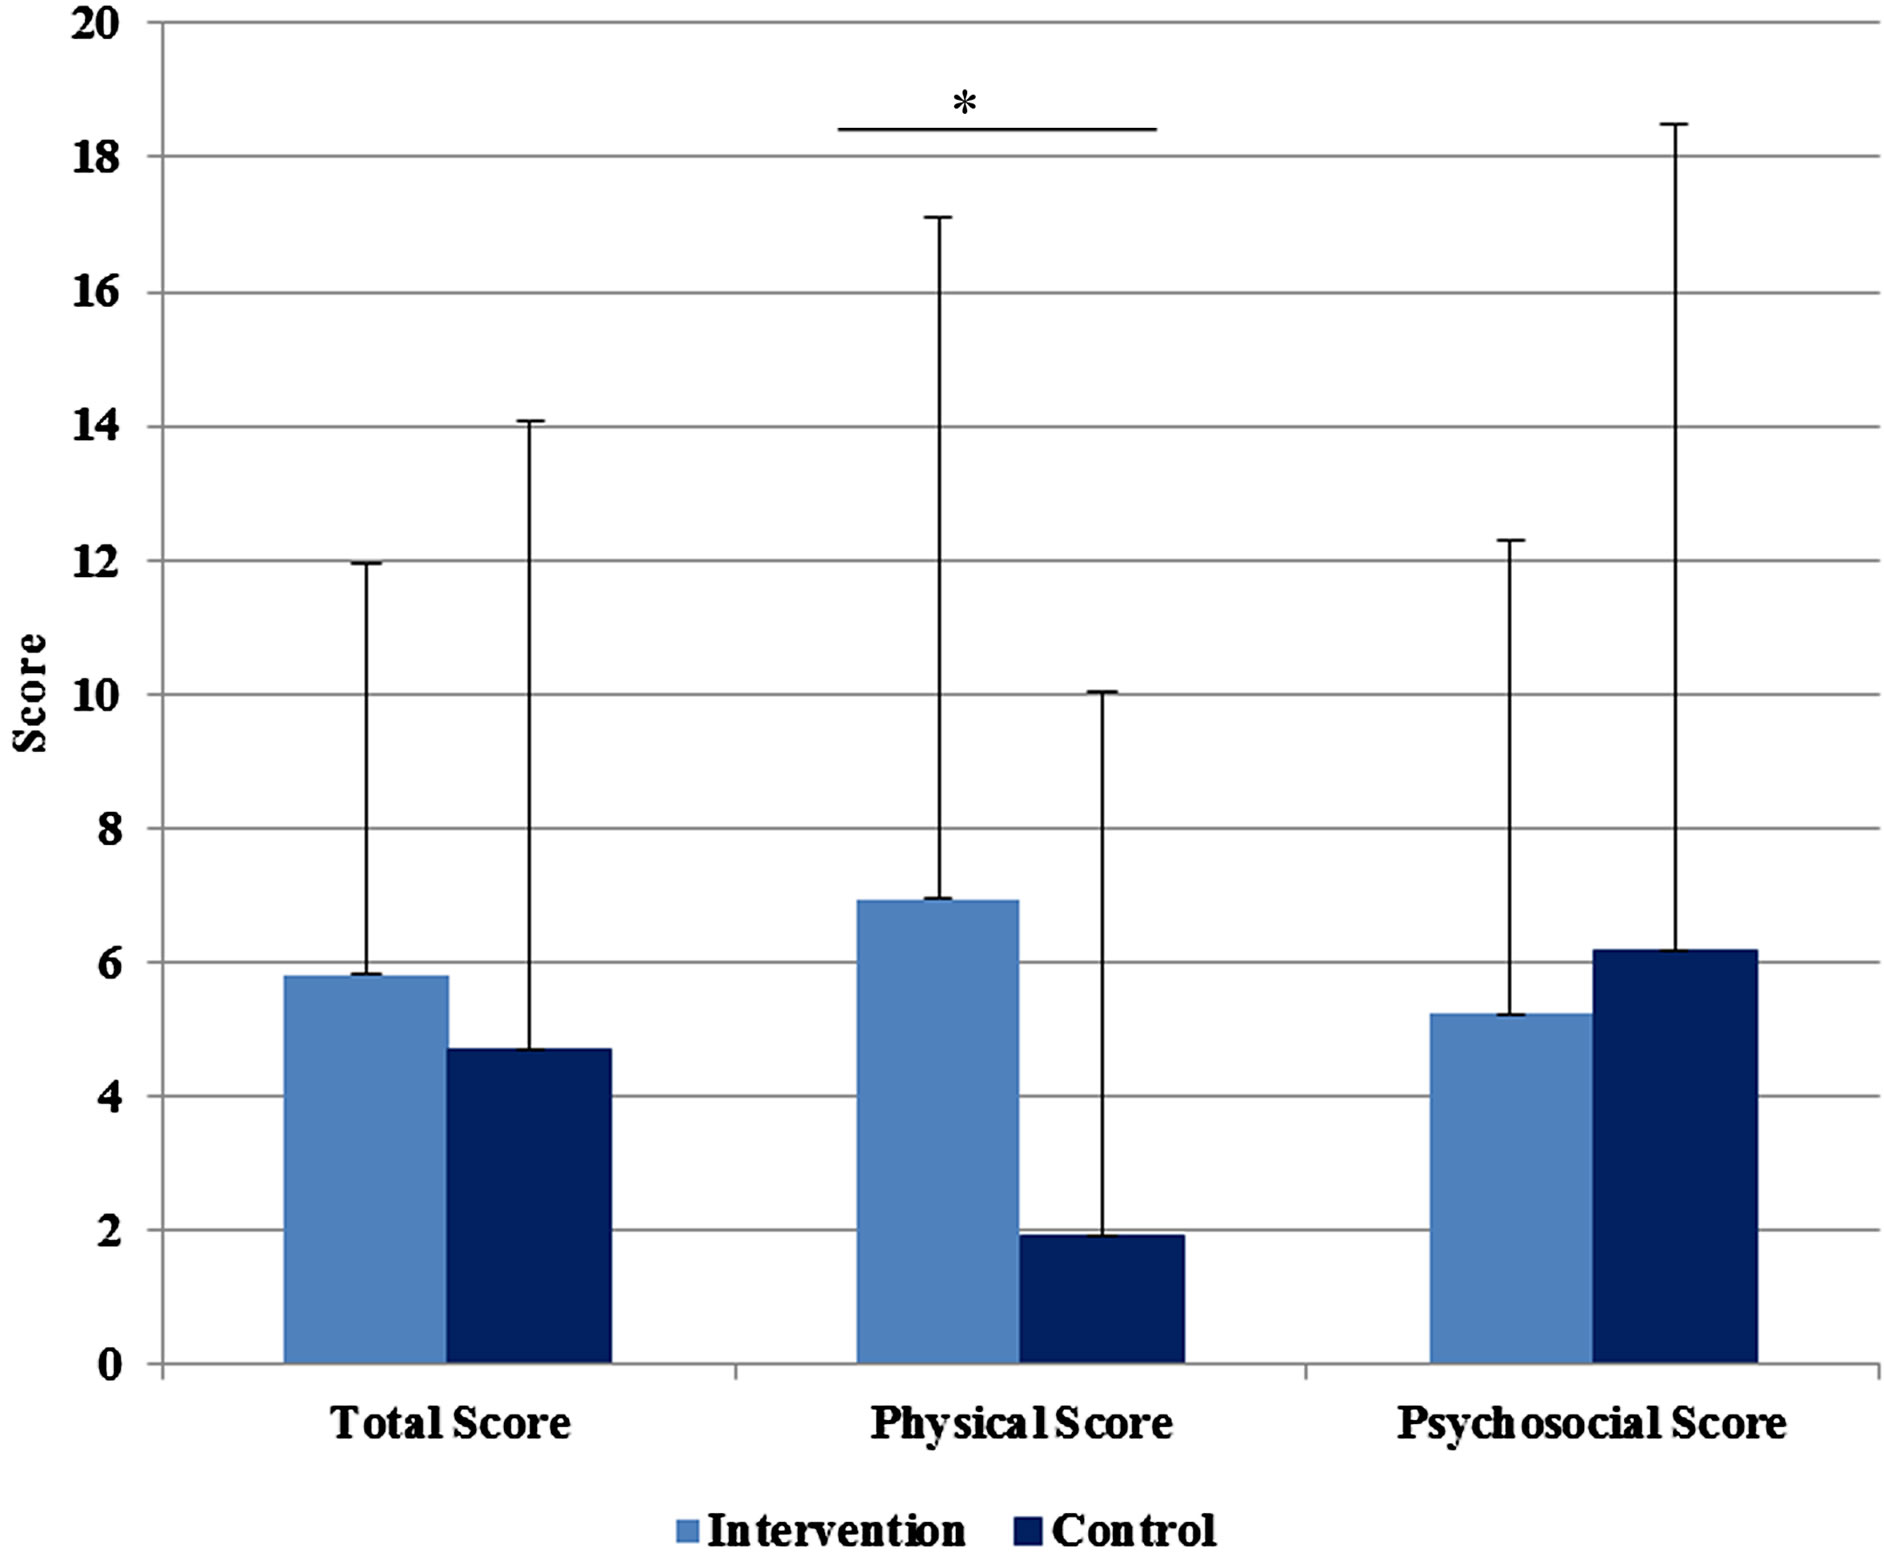
Figure 3. Mean differences between baseline and post-intervention PedsQL scores for intervention as compared to control group.
*Intervention score significantly greater than control (p < 0.05).
studied did not report digestive health problems, introducing more fiber into children’s diets was beneficial and was associated with improved HRQOL.
Child response rates for the PedsQL assessment tool were high, indicating that the population studied was able to understand and use the survey. One limitation of the study was that children may have been less likely to have missing and skipped responses had the PedsQL surveys been completed with the assistance of the researchers. Likewise, parents’ survey response rates were suboptimal, suggesting that researcher follow-up (i.e. by phone) might have resulted in higher survey completion rates. As results of this study showed, participating in the study led to higher correlations between child and parent PedsQL responses at post-intervention in both the intervention and control groups, suggesting that participation may have motivated parents and children to communicate about children’s health and quality of life.
Many foods that are naturally high in dietary fiber— such as fruits, vegetables, nuts, seeds, legumes and certain whole grains-also have high nutrient density, and are therefore considered healthy food choices for children. Although the importance of consuming high-fiber and nutrient-dense foods has been communicated by the US government for several decades [23,24], most children consume a significant portion of their calories from calorically dense, low-fiber foods. Currently, three of the top four contributors to dietary fiber among US children ages 2 - 18 years are yeast breads and rolls; crackers, popcorn, pretzels and chips; and ready-to-eat cereal [25]. Analysis of national food disappearance data (used as a proxy for household intake) suggest an association between the increased intake of refined, enriched grains and the prevalence of obesity and diabetes in the adult population, adding impetus to efforts which promote the consumption of foods that are naturally high in fiber, such as fruits, vegetables, and whole grains [26]. Nationally representative studies indicate that children with higher levels of dietary fiber intake consume significantly more fruits, vegetables and grains than children with lower dietary fiber intake [27]. Because many of the current primary contributors to dietary fiber intake are in fact low-fiber foods, replacing these items with higherfiber (i.e. whole grain) alternatives could improve children’s dietary fiber intake levels.
Overall, our findings indicate that snacks provided to children are a significant and modifiable source of nutrients in children’s diets, and that serving high-fiber foods results in a significant increase in dietary fiber consumption and physical well-being. Nationally representative data analysis indicate that the vast majority of children do not usually consume high-fiber foods [19, 28]; thus, changes in school feeding policies to increase the provision of high-fiber food options would likely have a tremendous beneficial effect on average dietary fiber intake, increasing dietary fiber intakes to get closer to the recommended intake goal of 14 grams of fiber per 1000 kcal consumed.
As in all dietary intervention studies, this study has several limitations. The length of the intervention (8 weeks) might have been too short to have shown the full potential of increasing dietary fiber intake on school-age children’s physical and psychosocial quality of life. Also, measures of dietary intake, bowel health, and quality of life were self-reported and may have been affected by reporting bias or error. It is possible that the observed improvements in HRQOL were mediated by other factors such as decreased levels of hunger (for children who otherwise would not have eaten), or feelings of wellbeing associated with participating in the study and receiving the study foods every day. Despite these limitations, the data strongly support offering children highfiber foods during snack time as a mode to increase their fiber intake and their physical health, even in children who do not report symptoms of gastrointestinal distress. The fact that the average daily fiber intake fell to baseline levels as soon as the intervention had ceased indicates the importance of consistently serving healthy snack foods at school. The importance of school feeding was demonstrated by the fact that the children’s home food environment did not change during the two months of intervention, although the children had increased familiarity with and high acceptance of high-fiber foods at school.
5. CONCLUSION
This study indicates that serving high-fiber snack foods twice a day at an elementary school was an effective tool to significantly increase children’s consumption of dietary fiber and led to an improvement in self-reported physical quality of life scores. Further research is needed to examine whether the effect of dietary changes on children’s quality of life could be maximized by the use of long-term, multi-faceted interventions targeting improvements in over-all diet quality.
ACKNOWLEDGEMENTS
The authors thank the student volunteers who assisted with this study. Partial funding for this study was provided by the Kellogg Company and the USDA Hatch Act Formula Grant.
REFERENCES
- Varni, J.W., Limbers, C.A. and Burwinkle, T.M. (2007) Parent proxy-report of their children’s health-related quality of life: An analysis of 13,878 parents’ reliability and validity across age subgroups using the PedsQL 4.0 generic core scales. Health and Quality of Life Outcomes, 5, 2. http://dx.doi.org/10.1186/1477-7525-5-2
- Hullmann, S.E., Ryan, J.L., Ramsey, R.R., Chaney, J.M. and Mullins L.L. (2011) Measures of general pediatric quality of life: Child Health Questionnaire (CHQ), DISABKIDS Chronic Generic Measure (DCGM), KINDL-R, Pediatric Quality of Life Inventory (PedsQL) 4.0 Generic Core Scales, and Quality of My Life Questionnaire (QoML). Arthritis Care & Research (Hoboken), 63, S420- S430. http://dx.doi.org/10.1002/acr.20637
- Hamzaid, H., Talib, R.A., Azizi, N.H., Maamor, N., Reilly, J.J. and Wafa, S.W. (2011) Quality of life of obese children in Malaysia. International Journal of Pediatric Obesity, 6, 450-454. http://dx.doi.org/10.3109/17477166.2011.590206
- Yackobovitch-Gavan, M., Nagelberg, N., Demol, S., Phillip, M. and Shalitin, S. (2008) Influence of weight-loss diets with different macronutrient compositions on healthrelated quality of life in obese youth. Appetite, 51, 697- 703. http://dx.doi.org/10.1016/j.appet.2008.06.010
- Yackobovitch-Gavan, M., Nagelberg, N., Phillip, M., Ashkenazi-Hoffnung, L., Hershkovitz, E. and Shalitin, S. (2009) The influence of diet and/or exercise and parental compliance on health-related quality of life in obese children. Nutrition Research, 29, 397-404. http://dx.doi.org/10.1016/j.nutres.2009.05.007
- Boyle, S.E., Jones, G.L. and Walters, S.J. (2010) Physical activity, quality of life, weight status and diet in adolescents. Quality of Life Research, 19, 943-954. http://dx.doi.org/10.1007/s11136-010-9659-8
- Schwimmer, J.B., Burwinkle, T.M. and Varni, J.W. (2003) Health-related quality of life of severely obese children and adolescents. Journal of the American Medical Association, 289, 1813-1819. http://dx.doi.org/10.1001/jama.289.14.1813
- Tyler, C., Johnston, C.A., Fullerton, G. and Foreyt, J.P. (2007) Reduced quality of life in very over-weight Mexican American adolescents. Journal of Adolescent Health, 40, 366-368. http://dx.doi.org/10.1016/j.jadohealth.2006.10.015
- Costarelli, V., Koretsi, E. and Georgitsogianni, E. (2013) Health-related quality of life of Greek ad-olescents: The role of the Mediterranean diet. Quality of Life Research, 22, 951-956. http://dx.doi.org/10.1007/s11136-012-0219-2
- Carson, T.L., Hidalgo, B., Ard, J.D. and Affuso, O. (2013) Dietary interventions and quality of life: A systematic review of the literature. Journal of Nutrition Education and Behavior, 41, 56-60. http://dx.doi.org/10.1016/j.jneb.2013.09.005
- Youssef, N.N., Langseder, A.L., Verga, B.J., Mones, R.L. and Rosh, J.R. (2005) Chronic childhood constipation is associated with impaired quality of life: A case-controlled study. Journal of Pediatric Gastroenterology and Nutrition, 41, 56-60. http://dx.doi.org/10.1097/01.mpg.0000167500.34236.6a
- Stewart, M.L. and Schroeder, N.M. (2013) Dietary treatments for childhood constipation: Efficacy of dietary fiber and whole grains. Nutrition Reviews, 71, 98-109. http://dx.doi.org/10.1111/nure.12010
- Costabile, A., Klinder, A., Fava, F., Napolitano, A., Fogliano, V., Leonard, C., Gibson, G.R. and Tuohy, K.M. (2008) Whole-grain wheat breakfast cereal has a prebiotic effect on the human gut microbiota: A double-blind, placebo-controlled, crossover study. British Journal of Nutrition, 99, 110-120. http://dx.doi.org/10.1017/S0007114507793923
- Lee, S., Harnack, L., Jacobs Jr., D.R., Steffen, L.M., Luepker, R.V. and Arnett, D.K. (2007) Trends in diet quality for coronary heart disease prevention between 1980-1982 and 2000-2002: The minnesota heart survey. Journal of the American Dietetic Association, 107, 213- 222. http://dx.doi.org/10.1016/j.jada.2006.11.003
- Oza-Frank, R., Cheng, Y.J., Narayan, K.M. and Gregg, E.W. (2009) Trends in nutrient intake among adults with diabetes in the United States: 1988-2004. Journal of the American Dietetic Association, 109, 1173-1178. http://dx.doi.org/10.1016/j.jada.2009.04.007
- Cavadini, C., Siega-Riz, A.M. and Popkin, B.M. (2000) US adolescent food intake trends from 1965 to 1996. Western Journal of Medicine, 173, 378-383. http://dx.doi.org/10.1136/ewjm.173.6.378
- Saldanha, L.G. (1995) Fiber in the diet of US children: Results of national surveys. Pediatrics, 96, 994-997.
- King, D.E., Mainous III, A.G. and Lambourne, C.A. (2012) Trends in dietary fiber intake in the United States, 1999-2008. Journal of the Academy of Nutrition and Dietetics, 112, 642-648. http://dx.doi.org/10.1016/j.jand.2012.01.019
- Moshfegh, A., Goldman, J. and Cleveland, L. (2005). What we eat in America, NHANES 2001-2002: Usual nutrient intakes from food compared to dietary reference intakes. http://www.ars.usda.gov/Services/docs.htm?docid=22659
- Trumbo, P., Schlicker, S., Yates, A.A. and Poos, M. (2002) Dietary reference intakes for energy, carbohydrate, fiber, fat, fatty acids, cholesterol, protein and amino acids. Journal of the American Dietetic Association, 102, 1621- 1630. http://dx.doi.org/10.1016/S0002-8223(02)90346-9
- Varni, J.W., Seid, M. and Kurtin, P.S. (2001) PedsQL 4.0: Reliability and validity of the Pediatric Quality of Life Inventory version 4.0 generic core scales in healthy and patient populations. Medical Care, 39, 800-812. http://dx.doi.org/10.1097/00005650-200108000-00006
- Varni, J.W., Burwinkle, T.M. and Seid, M. (2006) The PedsQL 4.0 as a school population health measure: Feasibility, reliability, and validity. Quality of Life Research, 15, 203-215. http://dx.doi.org/10.1007/s11136-005-1388-z
- United States Department of Agriculture, De-partment of Health and Human Services (2000) Nutrition and your health: dietary guidelines for Americans: Aim for fitness, build a healthy base, choose sensibly for good health. http://www.health.gov/dietaryguidelines/dga2000/DIETGD.PDF
- United States Department of Agriculture (2011) ChooseMyPlate. www.choosemyplate.gov
- Keast, D.R., Fulgoni III, V.L., Nicklas, T.A. and O’Neil, C.E. (2013) Food sources of energy and nutrients among children in the United States: National Health and Nutrition Examination Sur-vey 2003-2006. Nutrients, 5, 283- 301. http://dx.doi.org/10.3390/nu5010283
- Zhou, S.S., Li, D., Zhou, Y.M., Sun, W.P. and Liu, Q.G. (2010) B-vitamin consumption and the prevalence of diabetes and obesity among the US adults: Population based ecological study. BMC Public Health, 10, 746. http://dx.doi.org/10.1186/1471-2458-10-746
- Kranz, S., Mitchell, D.C., Siega-Riz, A.M. and Smiciklas-Wright, H. (2005) Dietary fiber intake by American preschoolers is associated with more nutrient-dense diets. Journal of the American Dietetic Association, 105, 221- 225. http://dx.doi.org/10.1016/j.jada.2004.11.005
- Kranz, S., Smiciklas-Wright, H. and Francis, L.A. (2006) Diet quality, added sugar, and dietary fiber intakes in American preschoolers. Pediatric Dentistry, 28, 164-171.