Health
Vol. 4 No. 10 (2012) , Article ID: 24213 , 4 pages DOI:10.4236/health.2012.410137
Analysis of occupational noise for the healthy life according to the job characteristics
![]()
1Department of Physical Therapy, Graduate Scool, Yongin University, Yongin, Korea
2Department of Physiology, Institute of Functional Genomics, School of Medicine, Konkuk University, Seoul, Korea
3Department of Physical Therapy, College of Public Health & Welfare, Yongin University, Yongin, Korea; *Corresponding Author: junghwankim3@yongin.ac.kr
Received 14 August 2012; revised 12 September 2012; accepted 25 September 2012
Keywords: Occupational Noise Exposure; Job Characteristics; Dosimeters; Noise Level
ABSTRACT
Noise is known that the physical risk factors defined as any unwanted sound. It can induce the health problems such as hearing loss or annoyance. The objective of this study was to assess the occupational noise exposure of nine groups for twenty peoples according to job characteristics and to compare the noise level by different variables. Personal noise levels were measured for three times using by dosimeters for each participant in Korea. The mean time weighted average noise level (TWA) of total was 73.2 ± 11.5 dBA by American conference of governmental industrial hygienists (ACGIH) standard. Especially, Korean classical music students were highly exposed to 93.2 ± 6.2 dBA but, office workers were 63.2 ± 6.6 dBA. In case of peak sound pressure level (Lpeak), Korean classical music students and firefighters were exposed to the highest level of 151.8 dBC and 145.8 dBC during playing and dispatching, respectively. The analysis of noise level showed that Leq had positive correlations between TWA by ministry of employment and labour (MOEL) (r = 0.98, p < 0.01) and TWA by ACGIH (r = 0.98, p < 0.01). Unlikely other groups, the noise exposure level of the Korean classical music students were exceeded the ACGIH standard. These results suggest that Korean classical music students were exposed high noise level and some solutions are need to reduce the noise exposure level such as using hearing protect device.
1. INTRODUCTION
Noise is a physical risk factor defined as any unwanted sound in the environment. It induces health problems such as stress and annoyance. Previous studies reported that noise exposure causes morphological and physiological that twisting and swelling of the hair cells, disarray of the stereocilia, and reduction of enzymes in cochlear fluids in the auditory system resulting in hearing impairment and psychological stress. Also, the long term noise exposure over 85 dBA causes not only irreversible hearing loss, but also hypertension [1-4]. On the contrary, noise exposure below 85 dBA may lead to mental symptoms such as sleep disturbance, annoyance, displeasure, and anxiety if one is consistently exposed [5-8]. Diverse occupational standards are set to protect the worker’s health worldwide. For example, American conference of governmental industrial hygienists (ACGIH) and the national institute for occupational safety and health (NIOSH) set the standard level of noise exposure as 85 dBA applying 3 dB exchange rates for 8 hours. According to the noise standard by ministry of employment and labour (MOEL) in Korea, the noise exposure level is 90 dBA applying 5 dBA exchange rates in workplace. It equals to the standard set by the occupational safety and health administration (OSHA) in the state. However, health and safety executive (HSE) has the different standard with three levels of action values each at 80 dBA, 85 dBA and 87 dBA [9-13]. Human performs a variety of activities at work places, thus exposed to diverse noises. Most of the noise exposure occurs from the work and daily activities including shopping, driving, etc. Most studies are progressed for occupations such as firefighter, railroad operator, call center worker, construction worker and manufacture worker in Korea. These workers are exposed to high levels of noise exceeding the exposure standard (90 dBA) [14-19]. However, these studies were only focused on the workers exposed by high noise level and for short durations. So, studies for public group such as students and housewives have rarely been performed. We assess the cumulative noise level of nine groups for many times using dosimeters. This study is the first empirical research that compared the occupational noise exposure of diverse groups according to their activity patterns in Korea. The objective of this study was to evaluate the occupational noise exposure of nine different groups according to their timedependent activity patterns.
2. MATERIALS & METHODS
2.1. Noise Measurement
We assessed the level of noise exposure for nine groups, each time with three voluntary people for three times. To confirm the noise level of diverse groups for their activity pattern, we select to nine groups who expected to expose from high to low noise level. We asked nine groups people to distribute an information letter and consent forms. The letter described the aims of study and general requirements. People interested in participating in the study was instructed to have the consent forms signed by oneself and then to return the forms. Study staff visited workplace of the participants to collect the consent forms, and observed their environment and situation of workplace at the same time. In conclusion, the study was carried out for 55 days with twenty people. The levels of noise exposure were sampled between May, 2010 to May, 2011 for each group. The noise measurement was performed by dosimeters (Spark 706, Larson Davis, US.). We instructed the subjects to record their activities in each environment using time activity diary and matched the data with the noise records. The dosimeters were used to measure the personal noise exposure level of twenty peoples between 09:00 am to 06:00 pm according to occupational pattern. Noise dosimeters were put into a small cross bag for the participant’s convenience and microphone with wind screen was located near the ear at a distance of 15 cm. All of the noise data was calibrated to be 94 dB and 114 dB at 1 KHz by using Calibrator (CAL150, Larson Davis, US) prior to each measurement and confirmed to be within 0.5 dB post-sampling. The instrument options are listed below.
The configuration of the dosimeter is as follows:
• Range: 33 - 123 dB.
• Time weighting: slow.
• Frequency weighting: A.
• Exchange rate: 3 dB and 5 dB.
• Threshold: 80 dB.
• Criteria level: 85 dB 90 dB.
• Logging: 1 minute interval.
And then, logging data in the noise dosimeters was downloaded into a notebook using Blaze program (PCE piezotronics Inc, US.). The criterion used to assess the exposure characteristic were equivalent noise level (Leq), maximum noise level (Lmax), minimum noise level (Lmin), and peak sound pressure level (Lpeak): Leq is frequency weighted equivalent-continuous sound pressure level in a given time period, Lmax is the maximum value of the frequency and exponential-time weighted sound level in a given time interval, Lmin is the minimum value of the frequency and exponential-time weighted sound level in a given time interval, Lpeak is the maximum value of the instantaneous frequency weighted sound pressure in a given time interval.
2.2. Statistical Analysis
All downloaded data was converted to the Leq by Equation (1).
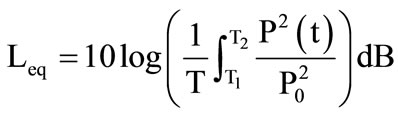 (1)
(1)
Leq: Equivalent continuous sound pressure level (dBA); P0: Reference pressure level = 20 µPa; PA: Acquired sound pressure in Pa; T1: Start time for measurement; T2: End time for measurement.
Sigma-Plot 8.0 (Systat Software Inc., US), Excel 2007 (Microsoft, US), and SPSS 18.0 (SPSS Inc, US) were used for the statistical analysis. A Shapiro-Wilk test was applied to confirm the normality of each noise level with the normal distributions. And then, one-way ANOVA was performed to compare the mean level and to confirm the significance for each group. As well, correlation analysis was carried out to identify correlations among the noise criterions by Spearman’s rho test.
3. RESULTS
3.1. Characteristics of the Noise Exposure Level
In this study, twenty subjects were participated belonging to nine groups. The total sample size was 55. Table 1 summarized the general characteristics of the participants. The mean age of the participants was 34.3 ± 11.2 and equivalent noise level (Leq) was 75.4 ± 9.8 dBA. Among the total participants, the noise levels in males were significantly higher than females (77.2 ± 10.6 dBA vs. 69.3 ± 3.2 dBA, p < 0.001). However, they were not exposed to significantly different levels of noises by their age (77.7
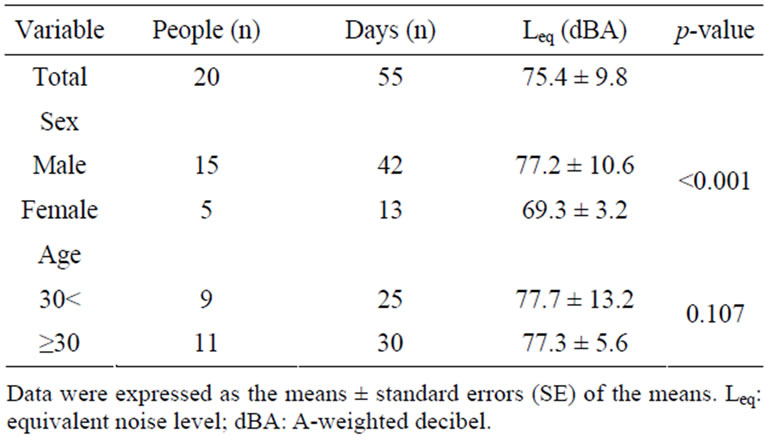
Table 1. General exposure characteristics by variables.
± 13.2 dBA vs. 77.3 ± 5.6 dBA, p = 0.107). Figure 1 shows the distribution of time weighted average noise level (TWA) for total 55 days. Among the 55 samples, 6 samples (11%) exceeded 90 dBA, 13 samples (24%) were over 80 dBA, and 36 samples (65%) were under 80 dBA. All of the 6 samples were from the Korean classical music students. Noise exposure levels of the nine groups are expressed in Table 2. The equivalent noise level was commonly used to assess the level of noise exposure. Additionally, we applied the criterion both TWA and dose that confirmed the level of risk. The TWA was analyzed with ACGIH and MOEL at the same time. The average TWA of the total subjects was 73.2 ± 11.5 dBA by ACGIH and 61.7 ± 15.8 by MOEL. Especially, Korean classical music students were highly exposed to the noise (93.2 ± 6.2 dBA, ACGIH). Next was the livestock farmers exposed to 78.4 ± 1.5 dBA, the hypermarket workers to 77.1 ± 3.9 dBA, the firefighters to 77.1 ± 4.1 dBA, the industrial hygienists to 75.9 ± 1.6 dBA, the high school students to 71.2 dBA, the housewives to 66.0 ± 5.4 dBA, the graduate students to 63.6 ± 5.4 dBA, and the office workers to 63.2 ± 6.6 dBA. In case of the Korean classical music student, the dose was 1339.2 ± 1403.7 by ACGIH, and 106.6 ± 85.2 by MOEL. It highly exceeded the standard (dose = 100), which has a high risk of hearing loss. However, other groups were not exposed to the noise over the standard (Figure 2). Figure 1 shows the distribution of TWA for total 55 days. Among the 55 samples, 6 samples (11%) exceeded 90 dBA, 13 samples (24%) were over 80 dBA, and 36 samples (65%) were under 80 dBA. All of the 6 samples were from the Korean classical music students.
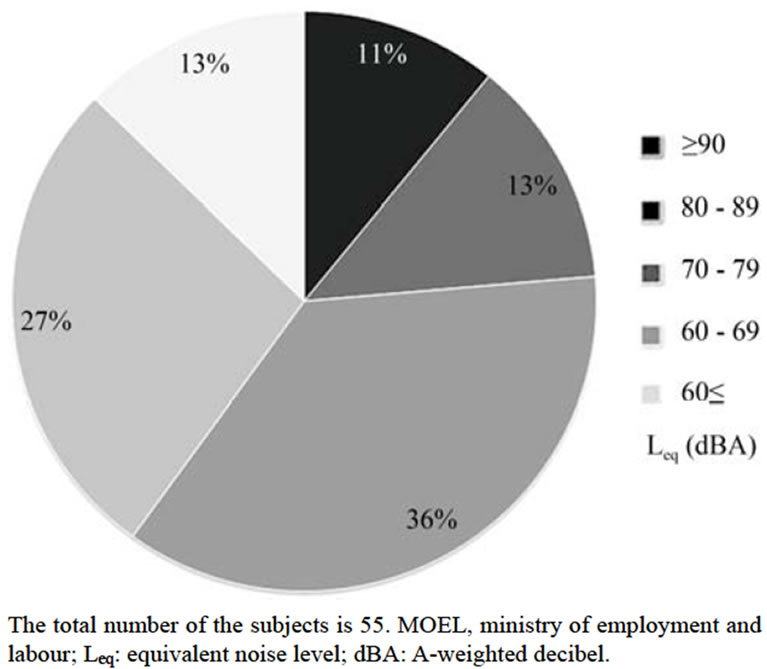
Figure 1. Percentage of time weighted average noise level (MOEL) for each group.
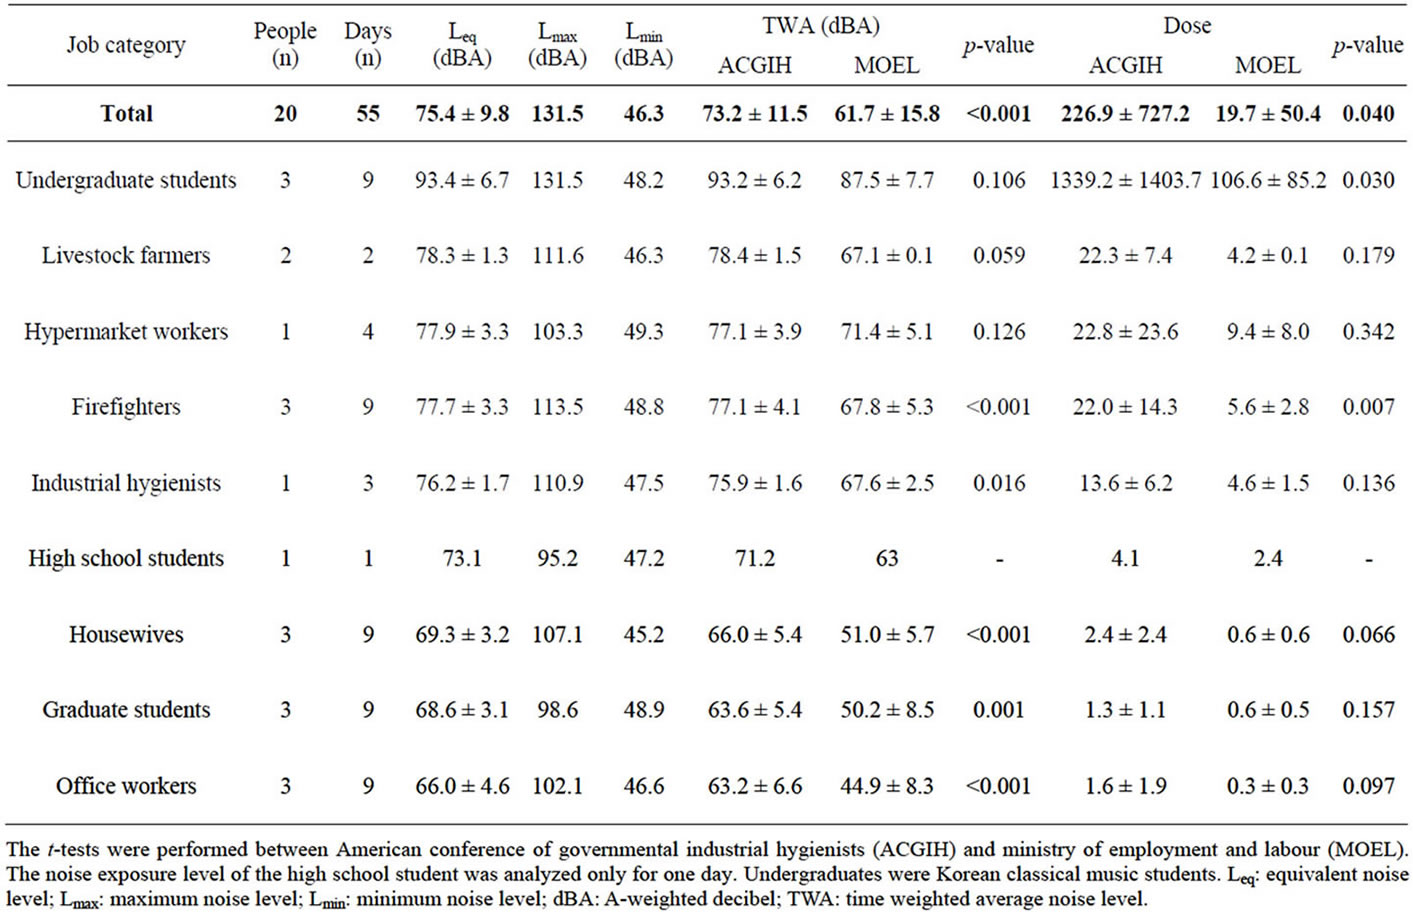
Table 2. Summary of noise exposure level.
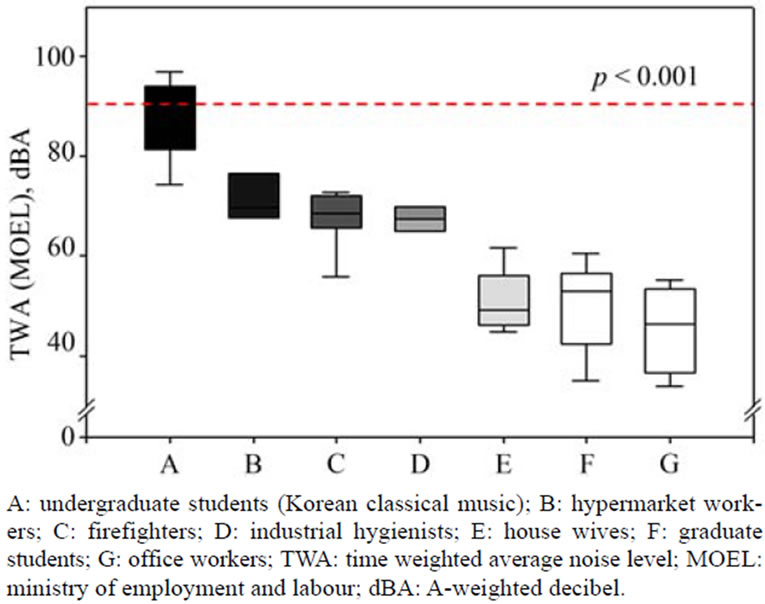
Figure 2. Comparison of noise level by group; values shown are median (line within box), 25th and 75th percentiles (bottom and top of the box), 5th and 95th percentiles (lower and upper bars on whisker).
3.2. Time History Exposure Level According to the Activities
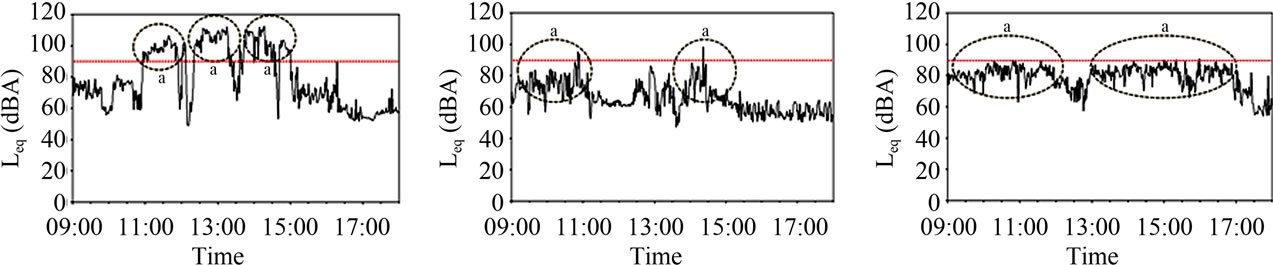
Noise levels according to the special activities are shown in Table 3. The activities occurred during the day time were expected to induce high levels of noised, thus we applied the criterion such as Maximum noise level (Lmax) and peak sound pressure level (Lpeak). The percentage of expose duration of event for undergraduate students, industrial hygienists, hypermarket workers, livestock farmers, house wives, firefighters, office workers, graduate students, and high school students were 25.8%, 15.9%, 46.9%, 44.8%, 6.2%, 22.5%, 72.9%, 12.6%, 17.1%, respectively. Especially, the Korean classical music students were exposed to the highest Lmax level of 131.5 dBA during the practicing. As well, the noise exposure of the industrial hygienists, hypermarket workers, and livestock farmers while they were measuring, working, and feeding were 110 dBA, 113.5 dBA, 111.6 dBA, and 110.9 dBA, respectively. Other groups were exposed to low levels of noises below 110 dBA. In general, the noise levels of housewives, firefighters, office workers, graduate students, and high school students during transporting, dispatching, working, transporting, and recreation were 107 dBA, 103.3 dBA, 102 dBA, 98.6 dBA, and 95.2 dBA, respectively. Figure 3 presents time history graph of the nine groups during the working hours (9:00 am-6:00 pm) where Leq was applied. The exposure patterns were similar as shown in Table 3.
3.3. Correlation of Noise Level among Criterion
Correlation between the noise level and criterion are shown in Table 4. Due to the lack of sample size, we used the Spearman’s rho correlation test. All criterions were significantly and positively correlated. Among the Leq, TWA by MOEL, and TWA by ACGIH, the highest positive correlation was shown (r = 0.98, p < 0.01). Additionally, another positive correlation was shown between TWA by MOEL and TWA by ACGIH (r = 0.97, p < 0.01).
4. DISCUSSION
In this study, we assessed the noise exposure levels of the nine groups. Most of all, Korean classical music students were highly exposed to the noise level exceeding the standard. There are some studies performed to investtigate the noise exposure of musicians according to their instruments. Phillips et al. (2008) carried out an assessment of the noise exposure level for music students in practice rooms [20]. The results implied that the students were exposed to different levels of noises depending to the instrument. For example, students played brass were exposed to the level of 95.2 dBA, string to 87.0 dBA, woodwind to 90.4 dBA, and percussion to 90.1 dBA [20]. Other studies for student musicians showed that the students were usually exposed to the noise exceeding 100 of does. Our results were consistent with the previous studies. The student musicians were at risk of the hearing loss [21,22]. According to previous studies of firefighters, the firefighters were exposed to high levels of noises over 92.7 dBA, which could cause the hearing loss. However, they were exposed to the level of 77.1 dBA in our study. Different measurement time in the process of sampling could be the reason for the discrepancy. We assessed 8 hours of noise exposure, and the previous studies were 24 hour [23,24]. Lpeak was slightly different from Lmax in terms of the event. Different time weight was suspected to cause the difference. Also, C-weighted decibel (dBC) applied to Lpeak and A-weighted decibel (dBA) to Leq or Lmax because of characteristics of frequency weighting. The Korean classical music students and firefighters were exposed to the highest Lmax at 151.8 dBC and 145.8 dBC, respectively, during the practicing and dispatching. These levels exceeded the noise standard of ACGIH (140 dBC) [25]. Given that the noise exposure over 140 dBC could induce temporary hearing loss or other hearing damage, the music students and the firefighters were at a high risk of such impairments [26]. Figure 3 presents time history graph of the nine groups during the working hours (9:00 am-6:00 pm) where Leq was applied. The exposure patterns were similar as shown in Table 3. There are various measures to control the noise: isolation, reduction and substitution. Hearing protection device (HPD) is the most efficient way to reduce the noise exposure with its usability, and practicality [27]. A previous study proved that ear plug of noise reduction ratio (NRR) is 20 - 40 dB,
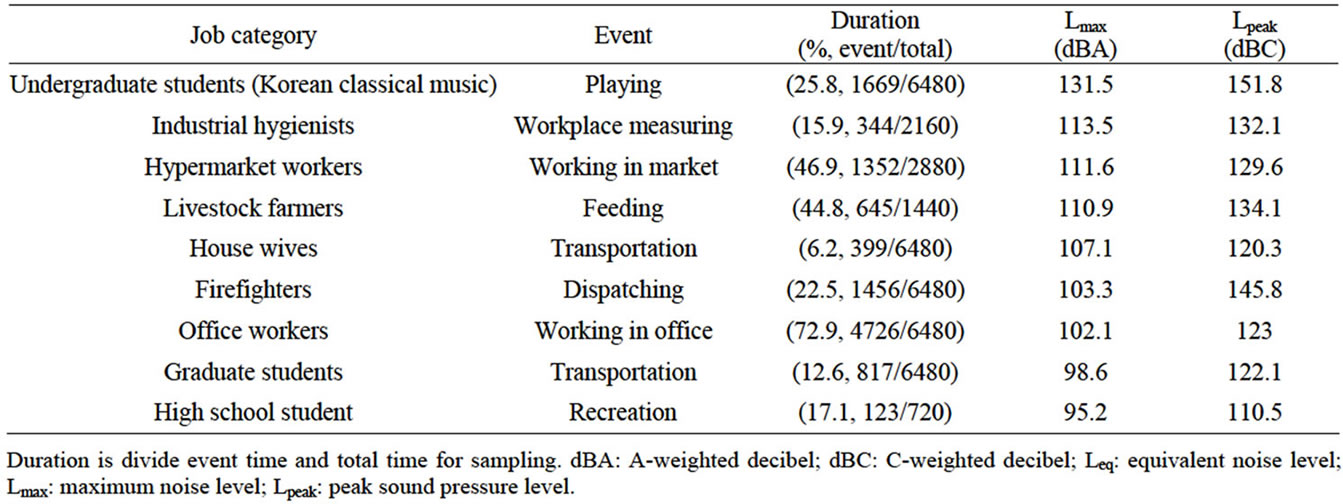
Table 3. Noise level according to the activity.
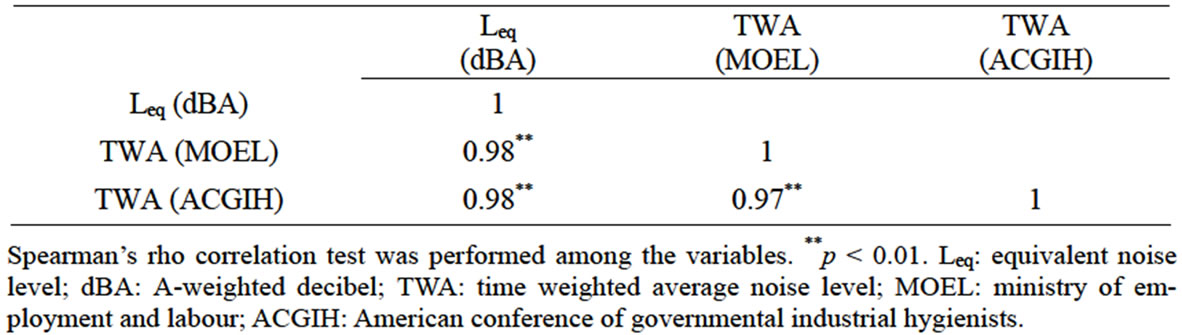
Table 4. Correlation coefficients among the noise criterion.
 (a)
(a)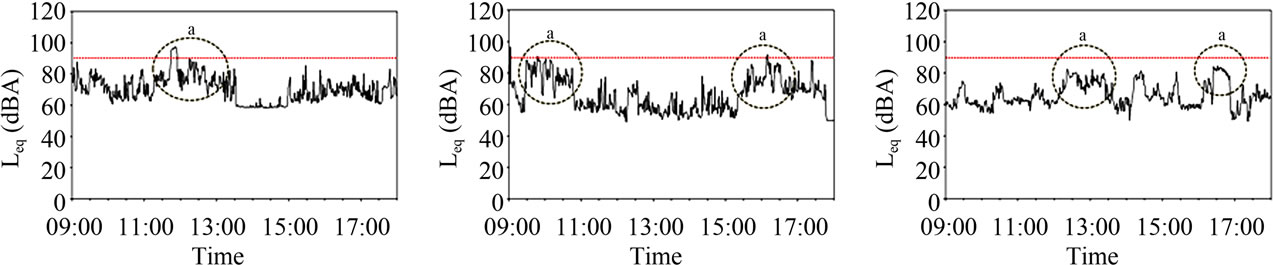 (b)
(b)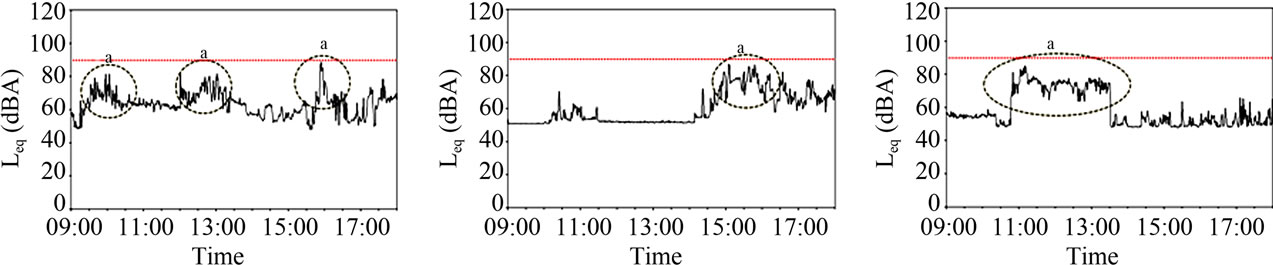 (c)
(c)
Figure 3. Time history pattern graph of each group. Circles shown are each activities (a) Undergraduate students (playing); (b) Livestock farmers (feeding); (c) Hypermarket workers (working); (d) Firefighters (dispatching); (e) Industrial hygienists (measuring); (f) High school student (recreation); (g) Housewives (transporting); (h) Graduate students (transporting); (i) Office workers (working).
which could reduce the risk of hearing loss [28,29]. Therefore, the measure such as using of hearing protection was essentially required to reduce the noise exposure during special activities. Spearman’s rho analysis result among the criterions showed that were significantly correlated. Unlike TWA and dose used a threshold that estimate the risk, Leq don’t applied the threshold. Generally, Leq is used to assess the noise level in the atmospheric environment for area sampling whereas TWA and dose is used in the workplace for personal sampling. Statistical results showed highly positive correlation among the criterions. Therefore, Leq and TWA are sufficient enough for the personal sampling. We evaluated the noise levels for the nine groups in this study. Conclusively, we found that the Korean classical music students were exposed to the highest noise level at 87.5 ± 7.7 dBA by MOEL on day time. The high risk activities included instrument playing for the Korean classical music students (Lpeak 151.8 dBC) and dispatching for the firefighters (Lpeak 145.8 dBC). Therefore, it is necessary to make some alternatives to reduce the noise exposure, for example, by using earplug and earmuff. This study is expected to provide basic data for further studies regarding health effects of the noise for the public.
REFERENCES
- Wheeler, D., et al. (1950) Noise-induced hearing loss. Archives of Otolaryngology, 51, 344-355. doi:10.1001/archotol.1950.00700020366006
- Wickremesinghe, N., et al. (1995) Noise induced hearing loss. Seychelles Medical and Dental Journal, 1, 10-12.
- Schmidt, C.W. (2005) Noise that annoys: Regulating unwanted sound. Environmental Health Perspectives, 113, 42-44. doi:10.1289/ehp.113-a42
- Ronald, H., et al. (2010) Noise-induced hearing loss in construction workers being assessed for hand-arm vibration syndrome. Canadian Journal of Public Health, 101, 226-229.
- Cohen, S. and Weinstein, N. (1981) Non-auditory effects of noise on behavior. Journal of Social Issues, 37, 36-70. doi:10.1111/j.1540-4560.1981.tb01057.x
- Öhrström, E. (1995) Effects of low levels of road traffic noise during the night. Journal of Sound and Vibration, 179, 603-615. doi:10.1006/jsvi.1995.0040
- Edward, T., et al. (2009) Minimizing sleep disturbance from blast noise producing training activities for residents living near a military installation. The Journal of the Acoustical Society of America, 125, 175-184. doi:10.1121/1.3026325
- Mark, B., et al. (2010) A field study of exposure-annoyance relationship of military shooting noise. The Journal of the Acoustical Society of America, 127, 2301-2311. doi:10.1121/1.3337234
- Petrick, M.E., Royster, L.H., Royster, J.D. and Reist, P. (1996) Comparison of daily noise exposures in one workplace based on noise criteria recommended by ACGIH and OSHA. American Industrial Hygiene Association Journal, 57, 924-928. doi:10.1080/15428119691014440
- Sriwattanatamma, P. and Breysse, P. (2000) Comparison of NIOSH noise criteria and OSHA hearing conservation criteria. American Journal of Industrial Medicine, 37, 334-338. doi:10.1002/(SICI)1097-0274(200004)37:4<334::AID-AJIM2>3.3.CO;2-Q
- Chung, I., Chu, I. and Cullen, M.R. (2012) Hearing effects from intermittent and continuous noise exposure in a study of Korean factory workers and firefighters. BMC Public Health, 12, 87. doi:10.1186/1471-2458-12-87
- Neitzel, R. and Yost, M. (2002) Task-based assessment of occupational vibration and noise exposures in forestry workers. American Industrial Hygiene Association Journal, 63, 617-627. doi:10.1080/15428110208984748
- Kotarbinska, E. and Koziowski, E. (2009) Measurement of effective noise exposure of workers wearing ear-muffs. International Journal of Occupational Safety and Ergonomics, 15, 193-200.
- Lee, S.-Y. and Choi, S.-J. (2008) Exposure to noise on railroad operators. Journal of Environmental Health Sciences, 34, 153-160. doi:10.5668/JEHS.2008.34.2.153
- Kim, K.-B., et al. (2011) Research on the characteristics and measures of noise exposure on worker wearing acoustic devices. Transactions of the Korean Society for Noise and Vibration Engineering, 21, 615-621. doi:10.5050/KSNVE.2011.21.7.615
- Lee, N., et al. (2010) Asymmetrical hearing loss and related factors among the noise exposed male workers. J Kor Soc Occup Environ Hyg, 20, 94-101.
- Ahmed, H., et al. (2001) Occupational noise exposure and hearing loss of workers in two plants in eastern Saudi Arabia. The Annals of Occupational Hygiene, 45, 371-380. doi:10.1016/S0003-4878(00)00051-X
- Noah, S., et al. (2001) Noise exposure among construction electricians. American Industrial Hygiene Association, 62, 615-621. doi:10.1202/0002-8894(2001)062<0615:NEACE>2.0.CO;2
- Fernández, M.D., et al. (2009) Noise exposure of workers of the construction sector. Applied Acoustics, 70, 753-760. doi:10.1016/j.apacoust.2008.07.014
- Phillips, S.L. and Mace, S. (2008) Sound level measurements in music practice rooms. Music Performance Research, 2, 36-47.
- Miller, V., et al. (2007) Noise exposure levels for student musicians. Medical Problems of Performing Artists, 22, 160.
- McBride, D., et al. (1992) Noise and the classical musiscian. British Medical Journal, 305, 19-26.
- Reischl, U., et al. (1979) Fire fighter noise exposure. American Industrial Hygiene Association Journal, 40, 482-489. doi:10.1080/15298667991429868
- Tubbs, R.L. (1991) Occupational noise exposure and hearing loss in fire fighters assigned to airport fire stations. American Industrial Hygiene Association Journal, 52, 372-378. doi:10.1080/15298669191364893
- Lee, L., et al. (2011) Noise exposure according to the time activity pattern and duties of firefighters. Journal of Environmental Health Sciences, 37, 94-101. doi:10.5668/JEHS.2011.37.2.094
- Garnither, G.R., et al. (1968) Hazardous exposure impulse noise. The Journal of the Acoustical Society of America, 43, 336-343. doi:10.1121/1.1910785
- Melamed, S., et al. (1996) Usefulness of the protection motivation theory in explaining hearing protection device use among male industrial workers. Health Psychology, 15, 209-215. doi:10.1037/0278-6133.15.3.209
- Schroeter, J. and Poesselt, C. (1986) The use of acoustical test fixtures for the measurement of hearing protector attenuation. Part II: Modeling the external ear, simulating bone conduction, and comparing test fixture and real-ear data. The Journal of the Acoustical Society of America, 80, 505-527. doi:10.1121/1.394046
- Neitzel, R. and Seixas, N. (2005) The effectiveness of hearing protection among construction workers. Journal of Occupational and Environmental Hygiene, 2, 227-238. doi:10.1080/15459620590932154