Journal of Environmental Protection
Vol. 4 No. 1 (2013) , Article ID: 27343 , 11 pages DOI:10.4236/jep.2013.41018
Sources Affecting PM2.5 Concentrations at a Rural Semi-Arid Coastal Site in South Texas
![]()
1Department of Environmental Engineering, Texas A&M University-Kingsville, Kingsville, USA; 2Department of Mechanical and Energy Engineering, University of North Texas, Denton, USA.
Email: kuruvilla.john@unt.edu
Received June 30th, 2012; revised October 21st, 2012; accepted November 22nd, 2012
Keywords: Positive Matrix Factorization (PMF2); Principal Component Analysis/Absolute Principal Component Scores (PCA/APCS); Coastal; Industrialized Urban
ABSTRACT
Principal component analysis/absolute principal component scores (PCA/APCS) and positive matrix factorization (PMF2), an advanced factor analysis technique were employed to apportion the sources influencing the PM2.5 levels measured during 2003 through 2005 at a rural coastal site located within the Corpus Christi urban airshed in South Texas. PCA/APCS identified five sources while PMF2 apportioned an optimal solution of eight sources. Both PCA/APCS and PMF2 quantified secondary sulfates to be the major contributor accounting for 47% and 45% of the apportioned PM2.5 levels. The other common sources apportioned by the models included crustal dust, fresh sea salt and traffic emissions. PMF2 successfully apportioned distinct sources of fresh and aged sea salt along with biomass burns while PCA/APCS was unsuccessful in identifying aged sea salt and biomass burns; however it successfully identified secondary organic aerosols from photochemical oxidations and also emitted by petrochemical refineries. The influence of long range transport was noted for sources such as secondary sulfates, biomass burns and crustal dust affecting the region. Continued collection of speciation data at the rural and urban sites will enhance the understanding of local versus regional source contributions for air quality policy makers and stakeholders.
1. Introduction
Epidemiological studies conducted over the past decade have provided ample confirmation of the adverse effects of PM2.5 on human health and welfare, and thus reiterating the need for source identification and quantification. Scientific studies over the past decade focussed on multiple techniques of source apportionment of PM2.5 measured in urban and rural locations with wide variations in geographic, climatic and emission conditions. Chemical mass balance (CMB), one of several traditional source receptor models requires input of specific source profiles and thus is regarded to be highly subjective. On the other hand, statistical models including principal component analysis/absolute principal component scores (PCA/APCS), UNMIX and positive matrix factorization (PMF) are data driven and need no prior knowledge of site specific source profiles and thus have been widely applied in several air quality studies spread across the globe [1-4].
Principal component analysis (PCA)/absolute principal component analysis (APCS) [5] have been successfully applied by various researchers to assess sources contributing PM2.5, PM10, and polycyclic aromatic hydrocarbons [6-9]. The process of data collection including field sampling and chemical analysis using instrumentation involves uncertainties or errors which are not considered in the PCA/APCS analysis. Paatero (1997) has developed an advanced multivariate factor analysis model Positive Matrix Factorization 2 (PMF) based on least squares approach which also incorporates an optimization process to improve the source apportionment using uncertainty or error estimates involved in sample collection and analysis [10]. This technique has been employed by various researchers to apportion sources contributing to the ambient levels of fine and coarse particulate matter as well as ozone precursors including volatile organic compounds (VOC) [11-18].
Prior studies have demonstrated the spatial variability in the chemical composition of PM2.5 measured at urban and rural monitoring sites [19-22]. Researchers thus have employed the source receptor models not only to identify and quantify local anthropogenic sources but also to study the impact of long-range transport from highly polluted regional sources [4,23,24].
Corpus Christi, located along the Gulf of Mexico in South Texas, is a fast growing industrialized urban region. A more recent comprehensive source apportionment study using PMF2 on the PM2.5 speciation data measured during 2003 through 2008 at an industrialized urban site in Corpus Christi showed the influence of both local anthropogenic sources and long-range transport from regional sources [25]. These regional air pollution events included smoke plumes from biomass burning in Central America and Mexico during spring, sub-Saharan dust transport from Africa during summer and regional scale continental transport of haze from industrialized areas of Texas, surrounding states and the Midwest during the fall months. In addition to the urban site in Corpus Christi, the Texas Commission on Environmental Quality (TCEQ) collected twenty four hour averaged filter samples during January 2003 through August 2005 at a rural coastal site located along the Gulf of Mexico. The monitoring site was located in a pristine coastal national park area with minimal impact from anthropogenic sources in the neighbouring urban airshed of Corpus Christi, Texas. In the present study, the primary objective was to apportion the key sources affecting the measured PM2.5 concentrations at the rural coastal monitoring site and to understand the impact of transported levels of pollution into the coastal region from source-rich upwind regions. Since source profiles specific for the study region were not available and creating one was beyond the scope of this study, hence statistical data driven models including PCA/APCS and PMF2 were employed for source apportionment of the measured PM2.5 levels. Conditional probability function analysis (CPF) was performed by coupling the APCS and PMF2 apportioned source contributions with the meteorological data to identify the wind directional sectors associated with source-rich regions in order to locate major PM2.5 contributors. The results from this study will provide stake-holders and policy makers a better understanding and quantification of local versus regional sources affecting the Corpus Christi urban airshed. This study will also assist researchers in identifying the best source apportionment models applicable for a coastal urban area similar to the study region.
2. Data and Methodology
The Corpus Christi urban airshed is the eighth largest Consolidated Metropolitan Statistical Area (CMSA) in Texas and is home to a cluster of energy related Industries adjacent to the sixth largest port in USA. TCEQ operates and maintains about sixteen continuous ambient monitoring stations measuring ozone, particulate matter, meteorological parameters and other pollutants including sulphur dioxide (SO2), hydrocarbons, and oxides of nitrogen (NOx) within this urban airshed.
2.1. Data Acquisition
Continuous ambient monitoring station (CAMS) 314 is situated in a rural location at 20420 Park road (27˚25'N, 97˚17'W) within the Padre Island National Seashore park and is classified as a coastal rural site. TCEQ has collected twenty four hour averaged PM2.5 filter samples once every six days at CAMS 314 during January 2003 through August 2005 for chemical characterization purposes. Figure 1 shows the geographical location of the monitoring site on a map of South Texas.
The samples were collected on pre-conditioned and pre-weighed 47-mm diameter Whatman Teflon and quartz filters. Gravimetric analysis of the Teflon filters was performed to measure the mass of PM2.5 collected. The filters were then stored at 4˚C and shipped to Research Triangle Institute (RTI), North Carolina for further chemical analysis. Filter samples acquired were preconditioned to room temperature and were analyzed for elements (energy dispersive x-ray fluorescence: ED-XRF), water soluble ions (ion chromatograph: IC) and carbon species (total optical transmittance: TOT). Speciation data along with method detection limits and analytical uncertainty were then reported to TCEQ. For the purpose of this study, the speciation data set measured at the rural site (CAMS 314) during January 2003 through August 2005 was acquired from TCEQ.
2.2. Principal Component Analysis/Absolute Principal Component Scores (PCA/APCS)
PCA is a statistical model which identifies principal components or factors to explain the variance in the provided
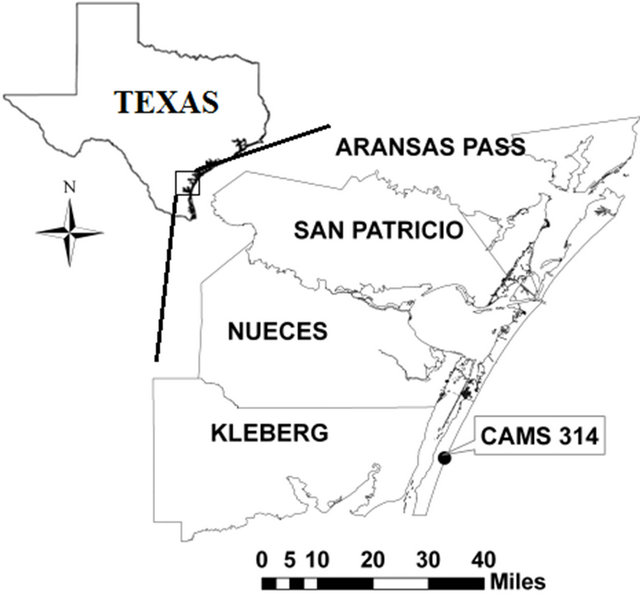
Figure 1. Map of the Corpus Christi urban airshed with the monitoring site location identified.
raw or correlated data [5]. To reduce the bias in the factor identification, species with at least 70% of observations above method detection limit (MDL) were selected for the analysis [6,26]. For the selected species any observations below MDL were replaced with half of the MDL value and those with missing data with the observed mean values. Thus the processed dataset consisted of 149 observations and 17 species for the monitoring site during the study period. Statistica© software was employed to conduct the principal component analysis. Principal components were selected based on Kaiser criterion and subsequently varimax normalized rotation was applied to maximize the variance of the species loadings as shown in earlier studies [4,27,28]. Species with factor loadings greater than 0.5 for the selected principal components were used to classify the sources. The corresponding factor scores along with an additional observation with zero concentrations were used to estimate the absolute principal component scores. Linear regression analysis was then performed on the absolute principal component scores and the measured concentrations to obtain the true source contributions.
2.3. Positive Matrix Factorization 2 (PMF2)
PMF is an advanced factor analysis technique developed for source apportionment analysis [10]. It employs a weighted least squares approach with an optimization function to minimize the chi-square based on the measured concentrations and their corresponding error estimates [17,29]. It uses non-negativity constraints and FPEAK parameter to reduce the rotational ambiguity of the identified sources. An optimal solution with minimum rotational ambiguity, objective function value and relatively constant sum of scaled residuals is typically obtained by iterative runs of PMF2.
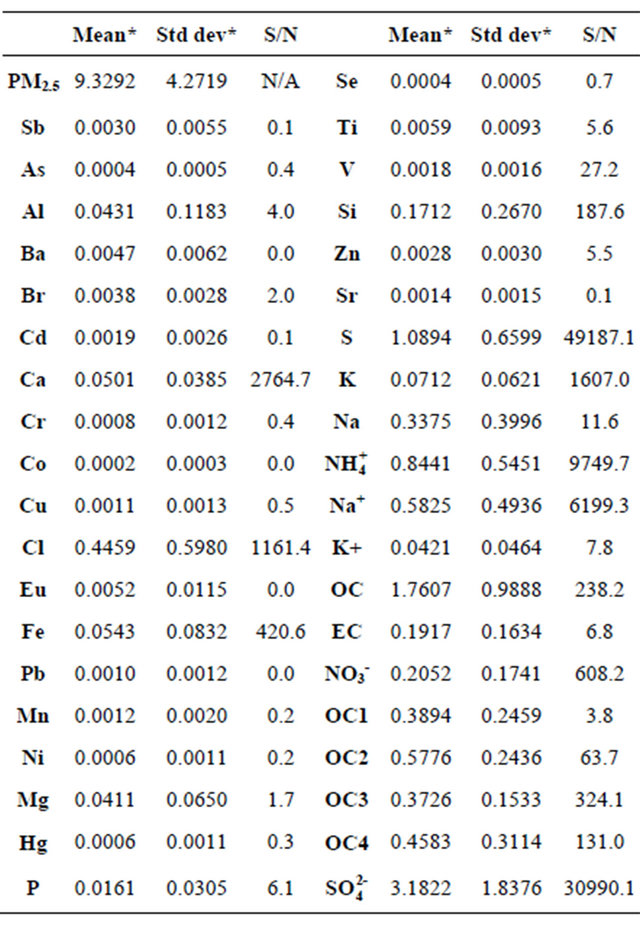
The speciation dataset acquired from TCEQ consisted of concentrations of 55 species where some species typically recorded below method detection limit (MDL). Traditional signal-to-noise (S/N) ratio approach applied by other researchers was employed to select key species for further analysis [22,29]. Species with S/N ratio greater than 2.0 were classified as strong and those with S/N ratios ranging from 0.2 to 2.0 were identified as moderately weak variables and only these species were used in the analysis as shown in Table 1. Validated speciation datasets consisting of 30 species including elements, water soluble ions, elemental and organic carbon for a total of 149 observations measured at CAMS 314 were used in the PMF based source apportionment analysis. Any missing concentrations in the samples were replaced with the arithmetic mean and those below MDL with half of the MDL values. Uncertainty is a key input for the PMF analysis, hence for concentrations above MDL the analytical uncertainty provided by TCEQ was
Table 1. Statistics of the measured PM2.5 species.
used, and for those below MDL the value was set to 5/6 of the MDL and for those with missing values, it was set to four times the arithmetic mean. With the processed concentration and uncertainty files as input the model was run in a robust mode to reduce the impact of any outliers in the data. Iterative runs of PMF2 were performed to identify the solution with optimal objective function value “Q” (which is defined as Q = No. of species × No. of samples). Further iterative runs with varing FPEAK were performed to identify the optimal solution with a minimum rotational ambiguity [3,22,29,30].
2.4. Conditional Probability Function Analysis (CPF)
Conditional probability function analysis is the probability measure of the concentrations in a wind sector being above a certain threshold level. It is characterized as the ratio between the number of samples in a wind sector above the given threshold to the total number of samples in that sector [25,30]. The prevailing meteorological conditions including the resultant wind speed and resultant wind direction measured during the sampling days were acquired from TCEQ’s website for CAMS 314. The hourly wind speed and wind direction data were then coupled with the APCS and PMF2 apportioned concentrations and sorted into wind sectors of 30˚ bins. The 75th percentile of apportioned concentrations was then used as the threshold to estimate the probability associated with each sector for a source [25,30].
3. Results
Corpus Christi urban airshed is currently in compliance with both the primary and secondary NAAQS for PM2.5, however a gradual increasing trend has been observed over the years. The annual average filter mass concentrations of ambient PM2.5 (based on the total mass from filter samples) measured at CAMS 314 during 2003 through 2005 were observed to be 7.19 µg×m−3, 8.06 µg×m−3 and 10.77 µg×m−3, respectively.
Filter samples were analyzed for a total of 55 PM2.5 species. Statistical analysis was performed on the speciation data to identify the major chemical constituents of PM2.5 and is shown in Table 1.
Sulfates were identified to be the largest chemical component in the measured PM2.5 accounting for approximately 33.9% of the total filter mass. Organic carbon and its constituents including OC1, OC2, OC3, and OC4 were calculated to be the second largest component totaling 25.9% of the measured PM2.5. The other key species included sulfur (11.7%), ammonium ion (10.5%), chloride ion (5.3%), sodium ion (4.5%), EC (4.1%), and nitrate ion (2.3%). Trace species such as Ba, Br, As, Hg and Pb accounted for the remainder (1.8%).
Seasonal variations in the chemical compositions were also observed at these sites indicating an impact of both local anthropogenic emissions and long range transport during regional pollution events as noted in earlier studies [25,31]. Data driven factor analysis models including PCA/APCS and PMF2 were employed to apportion the various sources influencing the rural site. The seasonal variations in the apportioned mass and the influence of local emissions versus transported levels of pollution affecting the measured PM2.5 concentrations within the study region were further analyzed.
3.1. PCA/APCS Source Apportionment Results
PCA identified five principal component scores with eigen values greater than 1.0 (Kaiser criterion) explaining 84% of variance in the measured PM2.5 levels. Source profiles were classified using the factor loadings of species greater than 0.5 as employed in earlier source apportionment studies [6,32]. The factor loadings, eigen values along with source classification and percent contribution are shown in Table 2.
As shown in Table 2, PC1 explaining 30% of the variance in PM2.5 levels measured at CAMS 314 comprised of S,  and
and . Secondary aerosols, pri
Table 2. Source apportionment: PCA/APCS analysis.
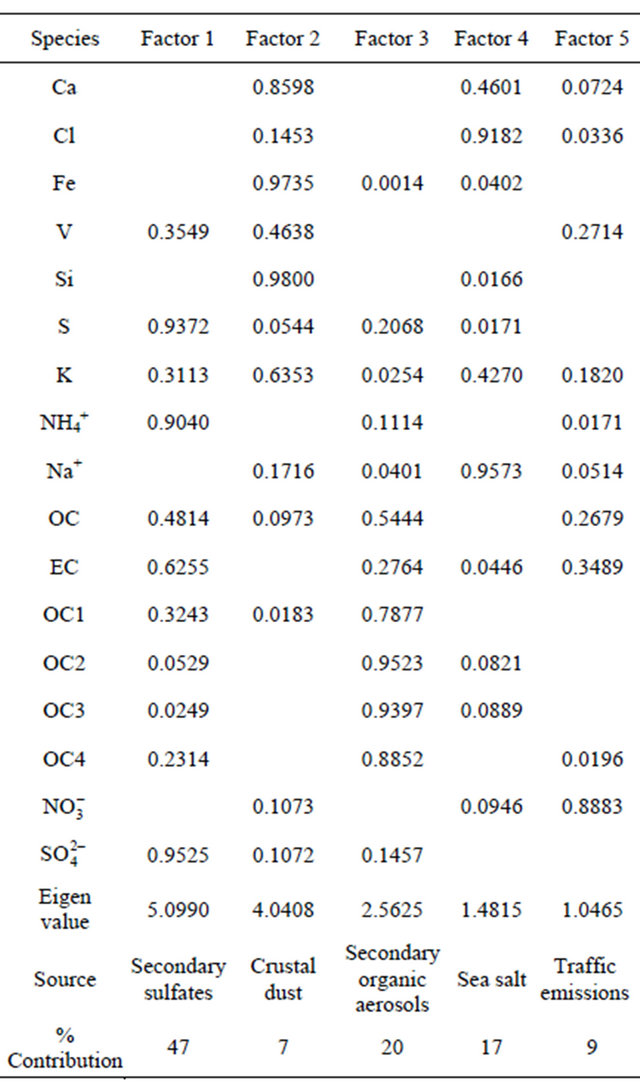
marily sulfates contributed by local anthropogenic sources such as petrochemical refineries and also associated with long-range transport during regional haze events, have been identified and quantified as the major contributor of PM2.5 in this study. Similar findings were also reported in earlier studies and this factor was classified as “Secondary sulfates” [32,33]. APCS identified secondary sulfates as a major contributor to the observed PM2.5 concentrations and it accounted for 47% of the apportioned mass.
PC2 with significant presence of elements such as Ca, Fe, Si and K, as shown in Table 2, was classified as “Crustal dust” similar to earlier studies [7,26]. This component explained 24% of the variance while APCS apportioned it to quantify 7% of the measured PM2.5 concentrations.
Secondary organic aerosols are produced primarily by photochemical oxidation of volatile organic compounds from petrochemical complexes, oil refineries, mobile emissions and biomass burning. Thus, PC3 characterized by OC, OC1, OC2, OC3 and OC4 (Table 2) was classified as “Secondary organic aerosols” accounting for 20% of the PM2.5 levels [34,35].
PC4 with high factor loadings of Na+ and Cl as shown in Table 2 accounted for 9% of the variance. Sea spray has been characterized with a dominant presence of Na, Na+, Cl is a major source along coastal margins [32,33, 36]. Hence PC4 was identified as “Sea salt” and was quantified by APCS to account for 17% of the PM2.5 levels measured at CAMS 314.
Traffic sources have typically been characterized with OC, EC, Cu, Zn,  and
and  contributed by the vehicle exhaust along with minor contribution of wear and tear in brake line and tires with composition of Cu, Zn and Cr [7,19]. PC5 with high factor loadings of
  along with the presence of OC and EC with 6% of variance were classified as “Traffic emissions” which accounted for 9% of the PM2.5 mass as shown in (Table 2).
3.2. PMF2 Source Apportionment Results
PMF2 identified an optimal solution of eight sources with minimum rotational ambiguity at FPEAK 0.0 influencing the ambient PM2.5 levels measured at the rural coastal site (CAMS 314).
Secondary sulfates were identified to be the major contributor of PM2.5 concentrations measured at the rural coastal site as reported by other researchers [29,36,37]. PMF2 apportioned two sources of secondary sulfates. Source 1 rich in S,  ,
,  and P was classified as “Secondary sulfates I” which accounted for 12% of the apportioned mass while source 2 contributing 33% with significant composition of S,
  , and
, and  was classified as “Secondary sulfates II (Table 3). A similar source was identified for the nearby industrialized site by Karnae and John [25]. This was quantified as a major source contributing 32% of the total apportioned PM2.5 concentrations.
Table 3. PMF source compositions and contribution.

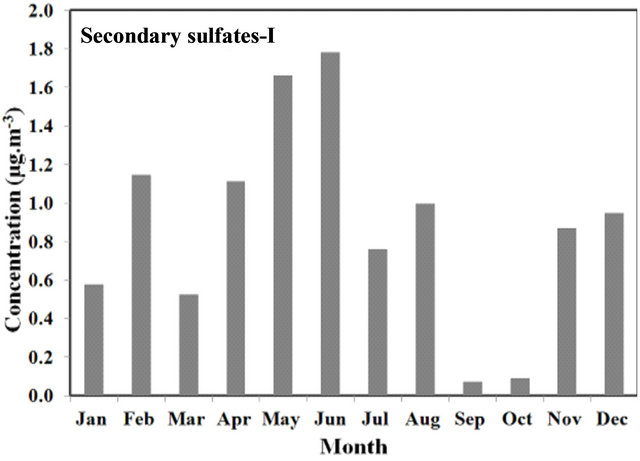
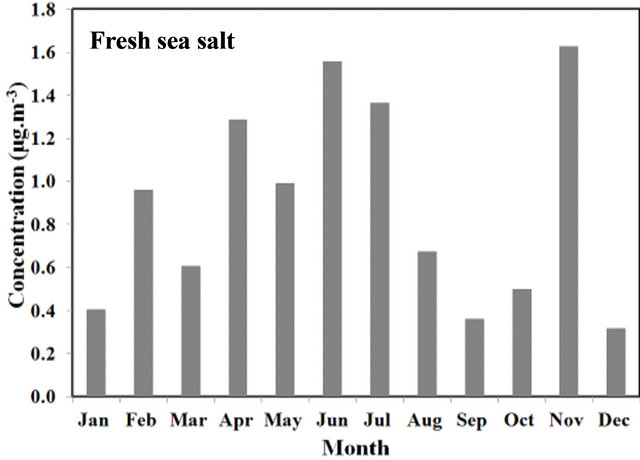
Seasonal variations were noted in secondary sulfates-I with higher concentrations during summer months while elevated concentrations of secondary sulfates-II were recorded during fall suggesting the influence of two separate sulfate sources. Source 3 accounting for 13% of the apportioned mass was identified to be the second largest source influencing PM2.5 levels measured at the coastal rural site as shown in Table 2. The dominant species included K and K+ contributed by residential wood combustion and agricultural burning and thus was classified as “Biomass burns” [26,40]. The source contributions estimated by PMF2 exhibited seasonal variations with high concentrations during the spring months of April and May as shown in Figure 2. With relatively larger composition of Cl, Na and Na+ typically contributed by fresh marine aerosols, source 4 was classified as “Fresh sea salt” and this accounted for 11% of the apportioned mass [31,33]. As shown in Figure 2 elevated levels were recorded during winter. Source 5 rich in Na, Na+ along with S,  and
and  was classified as “Aged sea salt”. It accounted for 8% of the apportioned mass. Aged sea salt source with similar compositions of Na, Na+, S,
  and
and  displacing Cl from the fresh marine aerosols was apportioned by PMF2 in other source apportionment studies conducted at coastal locations [33,38,39]. Figure 2 demonstrates seasonal variations in the apportioned concentrations of aged sea salt from 2003 through 2005. Higher mass fractions of
  and Zn along with significant levels of Cu, OC, EC, OC1, OC2, OC3, OC4,
  and S were observed in source 6 which accounted for 10% of the apportioned PM2.5 levels. This source composition typically represents anthropogenic emissions from on road sources including gasoline and diesel vehicles, along with wear and tear of tires and off road sources including gas compressors, local construction equipment and lawn mowers [38,40,41]. As indicated by the time series shown in Figure 3 higher levels were noted during January.
Air borne soil and crustal dust sources with elemental composition including Ca, Fe, Ti and Si has been identified by several studies influencing the urban and rural air quality [17,29]. Thus, source 7 in the current study with similar chemical composition as shown in Table 3 accounting for 9% of the apportioned mass was classified as “Crustal dust”. Elevated levels of crustal dust source were noted during summer months (June and July) as shown in Figure 3.
Heavy oil usage for combustion in the compressors has been identified as the primary source of metals includeing V and Ni along with OC and its components [32,33]. Oil and natural gas exploration activities have been reported on nearby Padre Island along with off shore operations in the Gulf of Mexico.
 (a)
(a)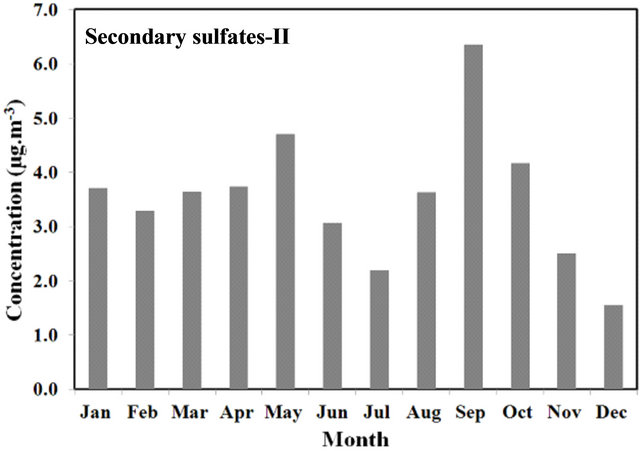 (b)
(b) (c)
(c)
Figure 2. Time series analysis of sources apportioned by PMF2 - (a) Secondary sulfates II and (b) Biomass burns, and (c) Secondary sulfates I
Thus, source 7 with rich composition of V, OC and its components including OC1, OC2, OC3 and OC4 was classified as “Combustion source”, which accounted for 4% of the apportioned PM2.5 mass.
3.3. Conditional Probability Function Analysis Results (CPF)
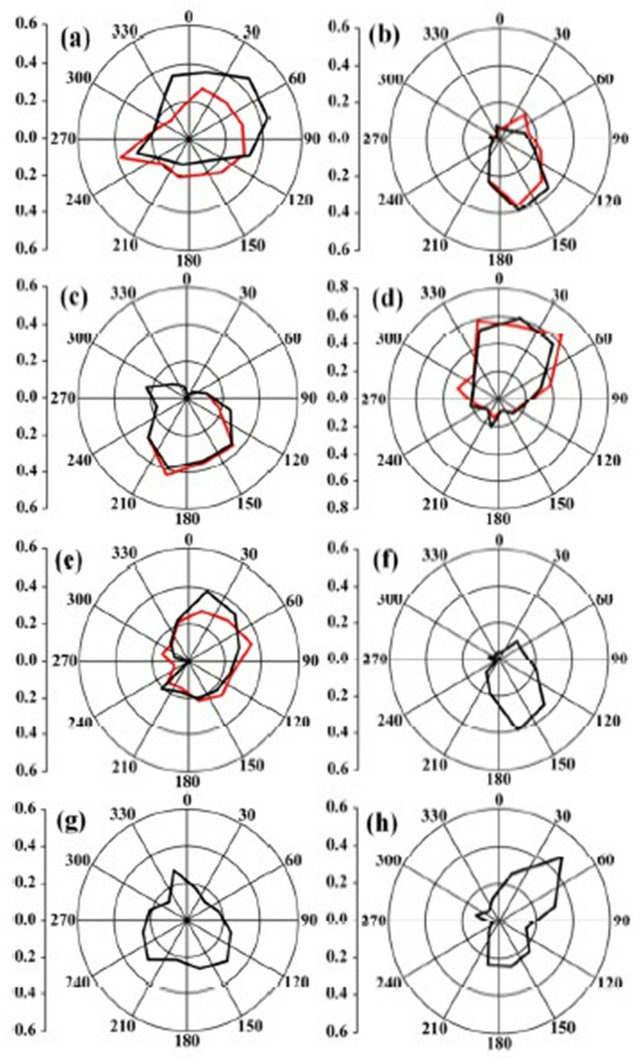
The CPF analysis of the sources apportioned by PCA/ APCS and PMF2 influencing the PM2.5 levels measured at CAMS 314 are shown in Figure 4. Winds from the northeast were observed to be the dominant contributors of secondary sulfates (Secondary sulfates II apportioned by PMF and secondary sulfates apportioned by PCA/ APCS). The urban airshed is located to the northwest of the monitoring site, while Laguna Madre (a hyper saline water body between the main land and the barrier island) is located to the west. Thus, secondary sulfates measured at CAMS 314 could be attributed to the anthropogenic sources located in the urban airshed and due to longrange continental scale transport from the northeast. In addition, sulfates associated with marine aerosols from Laguna Madre are also a contributor. As shown by the high probability directional sectors in Figure 4, aerosols from fresh marine aerosols from the Gulf of Mexico located to the southeast of the monitoring site were identified to be the major contributors of fresh sea salt (Figure 4). Winds from southeast and southwest sectors were associated with crustal dust as shown in Figure 4. Dust from dry agricultural fields located to the southeast and southwest of CAMS 314 along with longrange transport of sub-Saharan dust during the summer months were identified as probable sources of crustal dust.
The CPF analysis of traffic emission source apportioned by both PMF2 and PCA/APCS at CAMS 314 showed the influence of the northeast and northwest wind sectors. Vehicular emissions from a nearby recreational vehicle (RV) park located to the northeast of the monitoring site along with the heavy oil combustion in offshore oil and natural gas exploration activities were identified to be the probable contributors of this source. PMF2 apportioned combustion source and PCA/APCS apportioned secondary organic aerosol consisted of significant loadings of organic carbon and its components along with V. As shown by the CPF analysis (Figure 4) the dominant wind sector was noted to be northeast. The Padre Island National seashore has rich underground mineral wealth and thus active oil and gas explorations have been noted particularly in close proximity to the monitoring site. The Corpus Christi urban airshed which is home to several petrochemical refineries is located to the north of the monitoring site. Thus, secondary organic aerosols from local oil and natural gas exploration activities along with the transport of pollutants from anthropogenic sources located in the nearby urban airshed were identified to be the major sources of secondary organic aerosols.
The CPF analysis of the two unique sources apportioned by PMF2 including aged sea salt and biomass
 (a)
(a)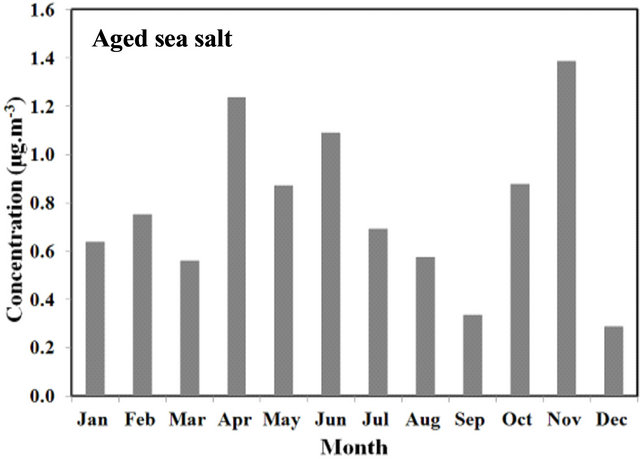 (b)
(b)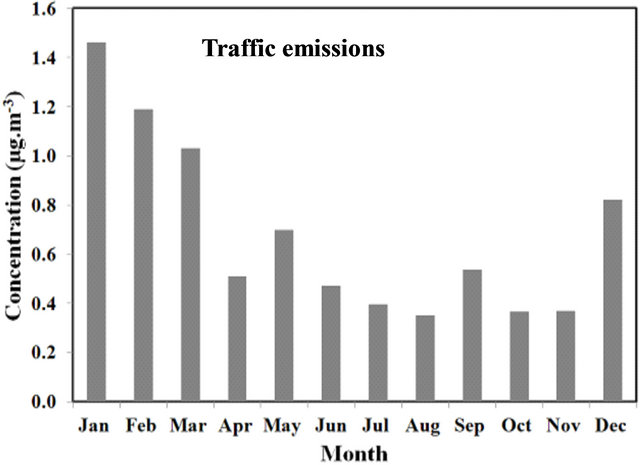 (c)
(c)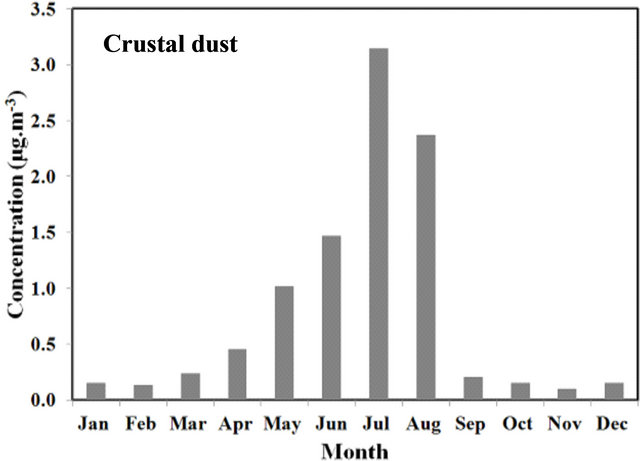 (d)
(d) (e)
(e)
Figure 3. Time series analysis of sources apportioned by PMF2: (a) Fresh sea salt; (b) Aged sea salt; (c) Traffic emissions; (d) Crustal dust; and (e) Combustion source.
burns along with secondary sulfates I are shown in Figure 4. As shown in Figure 4 southeast wind sectors were associated with aged sea salt levels. Aged marine aerosols from the Gulf of Mexico located to the southeast of the monitoring site were a primary contributor. Dominant contribution from southeast, southwest and northwest was observed to influence the secondary sulfates I source apportioned by PMF2. Secondary sulfates emitted by the local industries within the nearby urban airshed along with those emitted from the combustion of heavy oil were observed to be the primary contributors of this source. Influence of aged marine aerosols from hyper saline Laguna Madre located to the southwest was also noted. The CPF analysis of biomass burns apportioned by PMF2 at CAMS 314 as illustrated in Figure 4 showed similar directional probabilities with major contribution from the northeast and significant levels from southsoutheast. Emissions from controlled wild grass fires along the Padre Island National Seashore Park located to the northeast of CAMS 314 also had an influence on the fine particulate levels measured at CAMS 314. In addition, as stated by TCEQ and as shown by previous studies, the urban airshed has been impacted by long range transport from Mexico and Central America during biomass burns in April and May under favorable south and southeasterly winds [25,32,42].
4. Discussion
PMF2 apportioned two distinct sources of secondary sulfates contributed by anthropogenic emissions and photochemical formed aged aerosols while PCA/APCS aggregated both into one single source. The study area is located along the coast and thus significantly influenced by marine aerosols including both fresh and aged. PCA/APCS could not distinguish between fresh and aged sea salt, however PMF2 was successful in apportioning
 PMF2
PMF2 PCA/APCS
Figure 4. CPF plots of the sources apportioned by PCA/APCS and PMF2 at the rural coastal site (a) Secondary sulfates, (b) Sea salt, (c) Crustal dust, (d) Traffic emissions, (e) Secondary organic aerosols, (f) Aged sea salt, (g) Secondary sulfates I, and (h) Biomass burns.
distinct sources for both aerosol types. In addition, the PCA/APCS was unsuccessful in apportioning the biomass burns. PCA identified secondary organic aerosol source with significant loadings of organic carbon components which was apportioned by APCS to be the second largest source (20%) influencing PM2.5 levels measured at CAMS 314, while PMF2 apportioned a similar source contributing only 4% of the mass. Wood combustion also results in organic carbon thus, PMF2 apportioned significant levels of organic carbon and its components into the biomass burns source resulting in a variation in naming the sources and their distinct contributions.
A larger speciation dataset (July during 2003 through December 2008) at the industrialized urban site was used in an earlier source apportionment study conducted by Karnae and John [25]. Even though different sizes of speciation dataset were used, PMF2 apportioned similar sources with similar percent contributions. Secondary sulfates were apportioned to be the major contributor accounting for 30.4% as opposed to 32% by PMF2 and 47% by PCA/APCS in the present study. The industrial site showed a larger impact of anthropogenic sources as compared to the rural site, however a higher percentage of secondary sulfates have been apportioned at the rural site. Marine aerosols contributing to both fresh and aged sea salt collectively were apportioned to be the second largest contributor in the earlier study by Karnae and John [25]. Time series analysis of the PMF2 apportioned sources in the current study exhibited elevated concentrations of crustal dust during summer months and biomass burns source during spring months similar to the findings in the earlier study.
The primary limitation of the current study was the lack of availability of speciation data points beyond August 2005 at the coastal rural site due to discontinuation of sampling by TCEQ. Continued collection of speciation data at the rural site will most certainly enhance our understanding of local versus regional source contributions of PM2.5.
5. Conclusion
PCA/APCS apportioned five sources explaining 84% of variance in the PM2.5 concentrations measured at the rural coastal monitoring site (CAMS 314) adjacent to the Corpus Christi urban airshed. PMF2, the advanced factor analysis model, apportioned an optimal solution of eight sources at CAMS 314. Secondary sulfates were apportioned to be the major contributor influencing the PM2.5 levels measured at CAMS 314 accounting for 47% by PCA/APCS. PMF2 also identified secondary sulfates to be the major contributor however it was successful in identifying two distinct sources including “Secondary sulfates-I” contributed by local emissions (12%) and “Secondary sulfates-II” contributed by the photo chemically aged aerosols (33%). PCA/APCS apportioned seconddary organic aerosols with higher factor loadings of organic carbons contributed to 20% of the apportioned PM2.5 mass. PMF2 also apportioned secondary organic aerosols accounting for 4% of the mass. PMF2 apportioned significant levels of organic carbon and it’s components into the biomass burn source resulting in lower percentage of contribution by secondary organic aerosol source as compared to PCA/APCS. PMF2 apportioned traffic emissions source accounting for 10% while PCA/ APCS quantified it as 9%. The major contributors of the source were a nearby RV park along with the vehicular traffic on the beach. Crustal dust source was apportioned by both models accounting for 7% and 9% of the apportioned mass. PCA/APCS was unsuccessful in apportioning distinct sources of fresh and aged sea salt at both the sites, while PMF2 apportioned the two sources successfully accounting for 11% and 8%, respectively. PMF2 apportioned a unique source of biomass mass accounting for 13% of the apportioned mass contributed by local residential wood combustion and major biomass burn events in Mexico and Central America during the spring months. Using the data available as demonstrated by this study, PCA/APCS has successfully apportioned secondary sulfates and organic aerosols, however was unsuccessful in identifying natural sources including fresh and aged sea salt and the contribution of biomass burns. Both techniques have unique strengths and some identifiable weaknesses. While, the PMF2 resolved a larger number of sources, PCA/APCS resolved fewer unique sources. A hybrid approach to source apportionment will possibly enhance our understanding of the impact and influence of sources affecting the measured ambient PM2.5 concentrations.
6. Acknowledgements
The authors would like to thank the Office of Compliance and Monitoring Division at the Texas Commission on Environmental Quality (TCEQ) for providing the PM2.5 speciation data used in this study.
REFERENCES
- B. A. Begum, S. K. Biswas and P. K. Hopke, “Source Apportionment of Air Particulate Matter by Chemical Mass Balance (CMB) and Comparison with Positive Matrix Factorization (PMF) Model,” Aerosol and Air Quality Research, Vol. 7, No. 4, 2007, pp. 446-468.
- W. C. Wang, K. S. Chen, S. T. Chen, C. C. Lin, J. H. Tsai, C. H. Lai and S. K. Wang, “Characteristics and Receptor Modeling of Atmospheric PM2.5 at Urban and Rural Sites in Pingtung, Taiwan,” Aerosol and Air Quality Research, Vol. 8, No. 2, 2008, pp. 112-129.
- A. A. Karansasiou, P. A. Siskos and K. Eleftheriadis, “Assessment of Source Apportionment by Positive Matrix Factorization Analysis on Fine and Coarse Urban Aerosol Size Fractions,” Atmospheric Environment, Vol. 43, No. 21, 2009, pp. 3385-3395. doi:10.1016/j.atmosenv.2009.03.051
- S. Kong, B. Han, Z. Bai, L. Chen, J. Shi and Z. Xu, “Receptor Modeling of PM2.5, PM10 and TSP in Different Seasons and Long-Range Transport Analysis at a Coastal Site of Tianjin, China,” Science of Total Environment, Vol. 408, No. 20, 2010, pp. 4681-4694. doi:10.1016/j.scitotenv.2010.06.005
- R. C. Henry and G. M. Hidy, “Multivariate Analysis of Particulate Sulfate and Other Air Quality Variables by Principal Components-I. Annual Data from Los Angeles and New York,” Atmospheric Environment, Vol. 13, No. 11, 1979, pp. 1581-1596. doi:10.1016/0004-6981(79)90068-4
- G. D. Thurston and J. D. Spengler, “A Quantitative Assessment of Source Contributions to Inhalable Particulate Matter Pollution in Metropolitan Boston,” Atmospheric Environment, Vol. 19, No. 1, 1985, pp. 9-25. doi:10.1016/0004-6981(85)90132-5
- M. Viana, X. Querol, A. Alastuey, J. I. Gil and M. Menéndez, “Identification of PM Sources by Principal Component Analysis (PCA) Coupled with Wind Direction Data,” Chemosphere, Vol. 65, No. 11, 2006, pp. 2411- 2488. doi:10.1016/j.chemosphere.2006.04.060
- M. F. Khan, K. Hirano and S. Masunaga, “Quantifying the Sources of Hazardous Elements of Suspended Particulate Matter Aerosol Collected in Yokohma, Japan,” Atmospheric Environment, Vol. 44, No. 21-22, 2010, pp. 2646-2657. doi:10.1016/j.atmosenv.2010.03.040
- S. Gupta, K. Kumar, A. Srivastava and V. K. Jain, “Size Distribution and Source Apportionment of Polycyclic Aromatic Hydrocarbons (PAHs) in Aerosol Particle Samples from the Atmospheric Environment of Delhi, India,” Science of the Total Environment, Vol. 409, No. 22, 2011, pp. 4674-4680. doi:10.1016/j.scitotenv.2011.08.008
- P. Paatero, “Least Squares Formulation of Robust NonNegative Factor Analysis,” Chemometrics and Intelligent Laboratory System, Vol. 37, No. 1, 1997, pp. 23-25. doi:10.1016/S0169-7439(96)00044-5
- P. D. Hien, V. T. Bac and N. T. H. Thinh, “PMF Receptor Modelling of Fine and Coarse PM10 in Air Masses Governing Monsoon Conditions in Hanoi, Northern Vietnam,” Atmospheric Environment, Vol. 38, No. 2, 2004, pp. 189-201. doi:10.1016/j.atmosenv.2003.09.064
- H. Jorquera and B. Rappenglück, “Receptor Modeling of Ambient VOC at Santiago, Chile,” Atmospheric Environment, Vol. 38, No. 25, 2004, pp. 4243-4263. doi:10.1016/j.atmosenv.2004.04.030
- Z. Yuan, A. Kai Hon Lau, H. Zhang, J. Z. Yu, P. K. K. Louie and J. C. H. Fung, “Identification and Spatiotemporal Variations of Dominant PM10 Sources Over Hong Kong,” Atmospheric Environment, Vol. 40, No. 10, 2006, pp. 803-1815. doi:10.1016/j.atmosenv.2005.11.030
- K. R. Bullock, R. M. Duvall, G. A. Norris, S. R. McDow and M. D. Hays, “Evaluation of the CMB and PMF Models Using Organic Molecular Markers in Fine Particulate Matter Collected During the Pittsburgh Air Quality Study,” Atmospheric Environment, Vol. 42, No. 29, 2008, pp. 6897-6904. doi:10.1016/j.atmosenv.2008.05.011
- Y. Song, W. Dai, M. Shao, Y. Liu, S. Lu, W. Kuster and P. Goldan, “Comparison of Receptor Models for Source Apportionment of Volatile Organic Compounds in Beijing, China,” Environmental Pollution, Vol. 156, No. 1, 2008, pp. 174-183. doi:10.1016/j.envpol.2007.12.014
- M. S. Callén, M. T. De La Cruz, J. M. Lopez, M. V. Navarro and A. M. Mastral, “Comparison of Receptor Models for Source Apportionment of the PM10 in Zaragoza (Spain),” Chemosphere, Vol. 76, No. 8, 2009, pp. 1120- 1129. doi:10.1016/j.chemosphere.2009.04.015
- P. Lestari and Y. D. Mauliadi, “Source Apportionment of Particulate Matter at Urban Mixed Site in Indonesia in Using PMF,” Atmospheric Environment, Vol. 43, No. 10, 2009, pp. 1760-1770. doi:10.1016/j.atmosenv.2008.12.044
- Y.-C. Chan, O. Hawas, D. Hawker, P. Vowles, D. D. Cohen, E. Stelcer, R. Simpson, G. Golding and E. Christensen, “Using Multiple Type Composition Data and Wind Data in PMF Analysis to Apportion and Locate Sources of Air Pollutants,” Atmospheric Environment, Vol. 45, No. 2, 2010, pp. 439-449. doi:10.1016/j.atmosenv.2010.09.060
- S. Rodriguez, X. Querol, A. Alastuey, M. Viana, M. Alarcón, E. Mantilla and C. R. Ruiz, “Comparative PM10 - PM2.5 Source Contribution Study at Rural, Urban, and Industrial Sites During PM Episodes in Eastern Spain,” Science of the Total Environment, Vol. 328, No. 1-3, 2004, pp. 95-113. doi:10.1016/S0048-9697(03)00411-X
- R. L. Tanner, W. J. Parkhurst, M. L. Valente and D. W. Philips, “Regional Composition of PM2.5 Aerosols Measured at Urban, Rural and Background Sites in the Tennessee Valley,” Atmospheric Environment, Vol. 38, No. 20, 2004, pp. 3143-3153. doi:10.1016/j.atmosenv.2004.03.023
- C. Hueglin, R. Gehrig, U. Baltensperger, M. Gysel, C. Monn and H. Vonmont, “Chemical Characterization of PM2.5, PM10 and Coarse, Particles at Urban, Near-City and Rural Sites in Switzerland,” Atmospheric Environment, Vol. 39, No. 4, 2005, pp. 637-651. doi:10.1016/j.atmosenv.2004.10.027
- H. Lee, S. S. Park, K. W. Kim and Y. J. Kim, “Source Identification of PM2.5 Particles Measured in Gwangju, Korea,” Atmospheric Research, Vol. 88, No. 3-4, 2008, 199-211. doi:10.1016/j.atmosres.2007.10.013
- R. J. Park, D. J. Jacob, B. D. Field, R. M. Yantosca and M. Chin, “Natural and Transboundary Pollution Influences on Sulphate-Nitrate-Ammonium Aerosols in the United States: Implications for Policy,” Journal of Geophysical Research, Vol. 109, No. D15, 2004, pp. 1-17. doi:10.1029/2003JD004473
- D. D. Cohen, J. Crawford, E. Stelcer and T. V. Bac, “Long Range Transport of Fine Particle Windblown Soils and Coal Fired Power Station Emissions into Hanoi Between 2001 to 2008,” Atmospheric Environment, Vol. 44, No. 31, 2008, pp. 3761-3769. doi:10.1016/j.atmosenv.2010.06.047
- S. Karnae and K. John, “Source Apportionment of Fine Particulate Matter Measured in an Industrialized Coastal Urban Area of South Texas,” Atmospheric Environment, Vol. 45, No. 23, 2011, pp. 3769-3776. doi:10.1016/j.atmosenv.2011.04.040
- D. Nyanganyura, W. Maenhaut, M. Mathuthu, A. Makarau and F. X. Meixner, “The Chemical Composition of Tropospheric Aerosols and Their Contributing Sources to a Continental Background Site in Northern Zimbabwe from 1994 to 2000,” Atmospheric Environment, Vol. 41, No. 12, 2007, pp. 2644-2659. doi:10.1016/j.atmosenv.2006.11.015
- H. Guo, T. Wang and P. K. K. Louie, “Source Apportionment of Ambient Non-Methane Hydrocarbons in Hong Kong: Application Component Scores (PCA/APCS) Receptor Model,” Environmental Pollution, Vol. 129, No. 3, 2010, pp. 489-498. doi:10.1016/j.envpol.2003.11.006
- M. Amodio, E. Andriani, I. Cafagna, M. Caselli, B. E. Daresta, G. D. Gennaro, A. D. Gillio, M. Placentino and M. A. Tutino, “A Statistical Investigation About Sources of PM in South Italy,” Atmospheric Research, Vol. 98, No. 2-4, 2010, pp. 207-218. doi:10.1016/j.atmosres.2010.03.023
- E. Kim, T. V. Larson, P. K. Hopke, C. Slaughter, L. E. Sheppard and C. Claiborn, “Source Identification of PM2.5 in an Arid Northwest U.S. City by Positive Matrix Factorization,” Atmospheric Research, Vol. 66, No. 4, 2003, pp. 291-305. doi:10.1016/S0169-8095(03)00025-5
- B. A. Begum, S. K. Biswas, A. Markwitz and P. K. Hopke, “Identification of Sources of Fine and Coarse Particulate Matter in Dhaka, Bangladesh,” Aerosol and Air Quality Research, Vol. 10, 2010, pp. 345-353.
- S. Hellebust, A. Allanic, I. P. O’Connor, C. Jourdan, D. Healy and J. R. Sodeau, “Sources of Ambient Concentrations and Chemical Compositions PM2.5-0.1 in Cork Harbour, Ireland,” Atmospheric Research, Vol. 95, No. 2-3, 2010, pp. 136-149. doi:10.1016/j.atmosres.2009.09.006
- S. Karnae and K. John, “Source Apportionment Analysis of Measured Fine Particulate Matter in a Semi-Arid Urban Airshed in Corpus Christi, USA,” Advances in Geosciences, Vol. 16, 2010, pp. 227-239.
- E. Kim, L. Turkiewicz, S. A. Zulawnick and K. L. Magliano, “Sources of Fine Particles in the South Coast Area, California,” Atmospheric Environment, Vol. 44, No. 26, 2010, pp. 3095-3100. doi:10.1016/j.atmosenv.2010.05.037
- J. Pey, X. Querol, A. Alastuey, S. Rodriguez, J. P. Putaud and R. V. Dingenen, “Source Apportionment of Urban Fine and Ultra-Fine Particle Number Concentration in a Western Mediterranean City,” Atmospheric Environment, Vol. 43, No. 29, 2009, pp. 4407-4415. doi:10.1016/j.atmosenv.2009.05.024
- M. Zheng, F. Wang, G. S. W. Hagler, X. Hou, M. Bergin, Y. Cheng, L.G. Salmon, J. J. Schauer, P. K. K. Louie, L. Zeng and Y. Zhang, “Sources of Excess Urban Carbonaceous Aerosol in the Pearl River Delta Region China,” Atmospheric Environment, Vol. 45, No. 5, 2011, pp. 1175- 1182. doi:10.1016/j.atmosenv.2010.09.041
- N. N. Maykut, J. Lewtas, E. Kim and T. V. Larson, “Source Apportionment of PM2.5 at an Urban IMPROVE Site in Seattle, Washington,” Environmental Science & Technology, Vol. 37, No. 22, 2003, pp. 5135-5142. doi:10.1021/es030370y
- Y. Qin, E. Kim and P. K. Hopke, “The Concentrations and Sources of PM2.5 in Metropolitan New York City,” Atmospheric Environment, Vol. 40, No. 2, 2006, pp. S312- S332. doi:10.1016/j.atmosenv.2006.02.025
- E. Kim and P. K. Hopke, “Source Characterization of Ambient Fine Particles at Multiple Sites in the Seattle Area,” Atmospheric Environment, Vol. 42, No. 24, 2008, pp. 6047- 6056. doi:10.1016/j.atmosenv.2008.03.032
- R. J. Park, D. J. Jacob, B. D. Field, R. M. Yantosca and M. Chin, “Natural and transboundary pollution influences on Sulphate-Nitrate-Ammonium Aerosols in the United States” Implications for Policy,” Journal of Geophysical Research, Vol. 109, No. D15, 2004, pp. 1-17. doi:10.1029/2003JD004473
- I. Hwang and P. K. Hopke, “Estimation of Source Apportionment and Potential Source Locations at PM2.5 at a West Coastal IMPROVE Site,” Atmospheric Environment, Vol. 41, No. 3, 2006, pp. 506-518. doi:10.1016/j.atmosenv.2006.08.043
- J. Yin, R. M. Harrison, Q. Chen, A. Rutter and J. J. Schauer, “Source Apportionment of Fine Particles at Urban Background and Rural Sites in the UK Atmosphere,” Atmospheric Environment, Vol. 44, No. 6, 2010, pp. 841- 851. doi:10.1016/j.atmosenv.2009.11.026
- Texas Commission on Environmental Quality, Air Quality Events, Retrieved May 12 2012.