Atmospheric and Climate Sciences
Vol.3 No.4(2013), Article ID:37976,5 pages DOI:10.4236/acs.2013.34060
Determination of Instantaneous Frequencies of Low Plasma Waves in the Magnetosheath Using Empirical Mode Decomposition (EMD) and Hilbert Transform (HT)
1Department of Physics, Akwa Ibom State University, Ikot Akpaden, Nigeria
2Department of Physics, University of Uyo, Uyo, Nigeria
Email: *nyaknojimmyg@yahoo.com, nyaknojimmyg@gmail.com
Copyright © 2013 Ekong Ufot Nathaniel et al. This is an open access article distributed under the Creative Commons Attribution License, which permits unrestricted use, distribution, and reproduction in any medium, provided the original work is properly cited.
Received September 8, 2013; revised October 6, 2013; accepted October 14, 2013
Keywords: Plasma Waves; Instantaneous Frequency; Empirical Mode Decomposition (EMD); Hilbert Transform (HT)
ABSTRACT
The observations of in-situ spacecraft mission in the magnetosheath and a region of thermalized subsonic plasma behind the bow shock reveal a non-linear behaviour of plasma waves. The study of waves and optics in Physics has given the understanding of the effect of many waves coming together to form a wave field or wave packet. The common aspect of such study shows that two or more waves can superimpose constructively or destructively. The sudden high magnetic field data in the magnetosheath displays such possibility of superposition of waves. In this paper, we use the empirical mode decomposition (EMD) and Hilbert transform (HT) techniques to determine the instantaneous frequencies of low frequency plasma waves in the magnetosheath. Our analysis has shown that the turbulent behavior of magnetic field in the magnetosheath within the selected period is due to superposition of waves.
1. Introduction
From the study of the waves arising from the events on the upstream of the bow shock, there is a process of events leading to another regime of waves with turbulent or complex behaviour in the downstream region otherwise called the magnetosheath. Magnetosheath is an interface between the bow shock and the magnetopause. It is a region of thermalized subsonic plasma behind the bow shock. The plasma in the magnetosheath is denser and hotter than that in the solar wind. Also the magnetic field strength in the magnetosheath is higher than the magnetic field strength in the solar wind [1,2].
Many analysts have chosen different techniques for the analysis of resultant waves of space plasma aimed at understanding these waves. Most analyses of plasma waves have been carried out with Fourier transform (FT) or Wavelet Transform (WT). Detailed investigations of the dynamic properties of space plasma have been limited by the use of these standard techniques. This limitation is due to the assumptions of linearity and stationary (using FT) or linearity and non-stationary (using WT) behaviours of these waves leading to wrong determination of the frequency and other properties of these waves.
The truth is that space plasma data are observational data that exhibit unsteady character (non-linearity) [3,4] in oscillations throughout the data. Therefore, the use of the standard spectral analysis techniques limits the possibility of investigating the details of the dynamics of such data. In order to investigate the details of the dynamics of space plasma especially the plasma waves in the magnetosheath, there is a need for an approach that will decompose the complex waves into simple or mono-component waves, an approach that is based upon the local characteristic time scale of the signal. There is also a need for an approach that will help construct the time evolutions of the signal.
In this paper, we use the combination of empirical mode decomposition (EMD) technique and Hilbert transform (HT) to determine the instantaneous frequencies of plasma waves in the magnetosheath which could be used in the detailed investigation of space plasma behaviour.
2. Brief Comparison of Fourier Transform (FT), Wavelet Transform (WT) and Empirical Mode Decomposition (EMD)-Hilbert Transform Combination Methods
Fourier Transform (FT) is a type of global transform that is most suitable for linear and stationary signals. It provides a general technique for the examination of the global energy-frequency distribution [5]. Huang has further revealed the dependence of FT on linearity. It is true that many natural events can be approximated by linear systems.
It is also true that they also have tendency to be nonlinear. The imperfection of our probes (or numerical schemes) can lead to non-linear behaviour when there is interaction between the imperfect probes and the linear system. Fourier Transform can deal with the linear case and not the non-linear case.
Wavelet Transform (WT) is an adjustable window Fourier Transform. It can supply localised information in time-frequency domain, as it possesses the multi-scale property and mathematical microscope ability that makes it to detect the sudden component of the signals [6]. WT is a better approach than Fourier Transform in the analysis of non-stationary signals.
EMD technique generates a collection of intrinsic mode functions (imf). The decomposition is based on the direct extraction of the energy associated with various intrinsic timescale. According to Huang et al., 1998, the decomposition can be viewed as an expansion of the data in terms of the imfs. After the extraction of the imfs using EMD, the Hilbert Transform (HT) Approach as used in Carozzi et al., 2004 can be applied on each imf. The local energy and the instantaneous frequency derived from each imf through Hilbert Transform can give a full energy-frequency-time distribution of data.
Table 1 [5,7] displays the comparison between empirical mode decomposition (EMD)-Hilbert Transform (HT) approach, Fourier and Wavelet Transform. Various qualities have been considered for this comparison between the second and the last rows. This table shows at a glance that the EMD-HT approach is robust for the nonlinear and non-stationary signal analysis.
3. EMD-HT Method
Empirical mode decomposition (EMD)-Hilbert transform (HT) is a signal processing technique simply called Hilbert-Huang Transform (HHT). This technique is local and adaptive in the analysis of time-frequency signal. The study of waves and optics in Physics has shown that a wavefield can be composed of superimposed monocomponent waves. Since Physics deals with signals such as nature, there is need to decompose the signal into series of mono-component called intrinsic mode functions
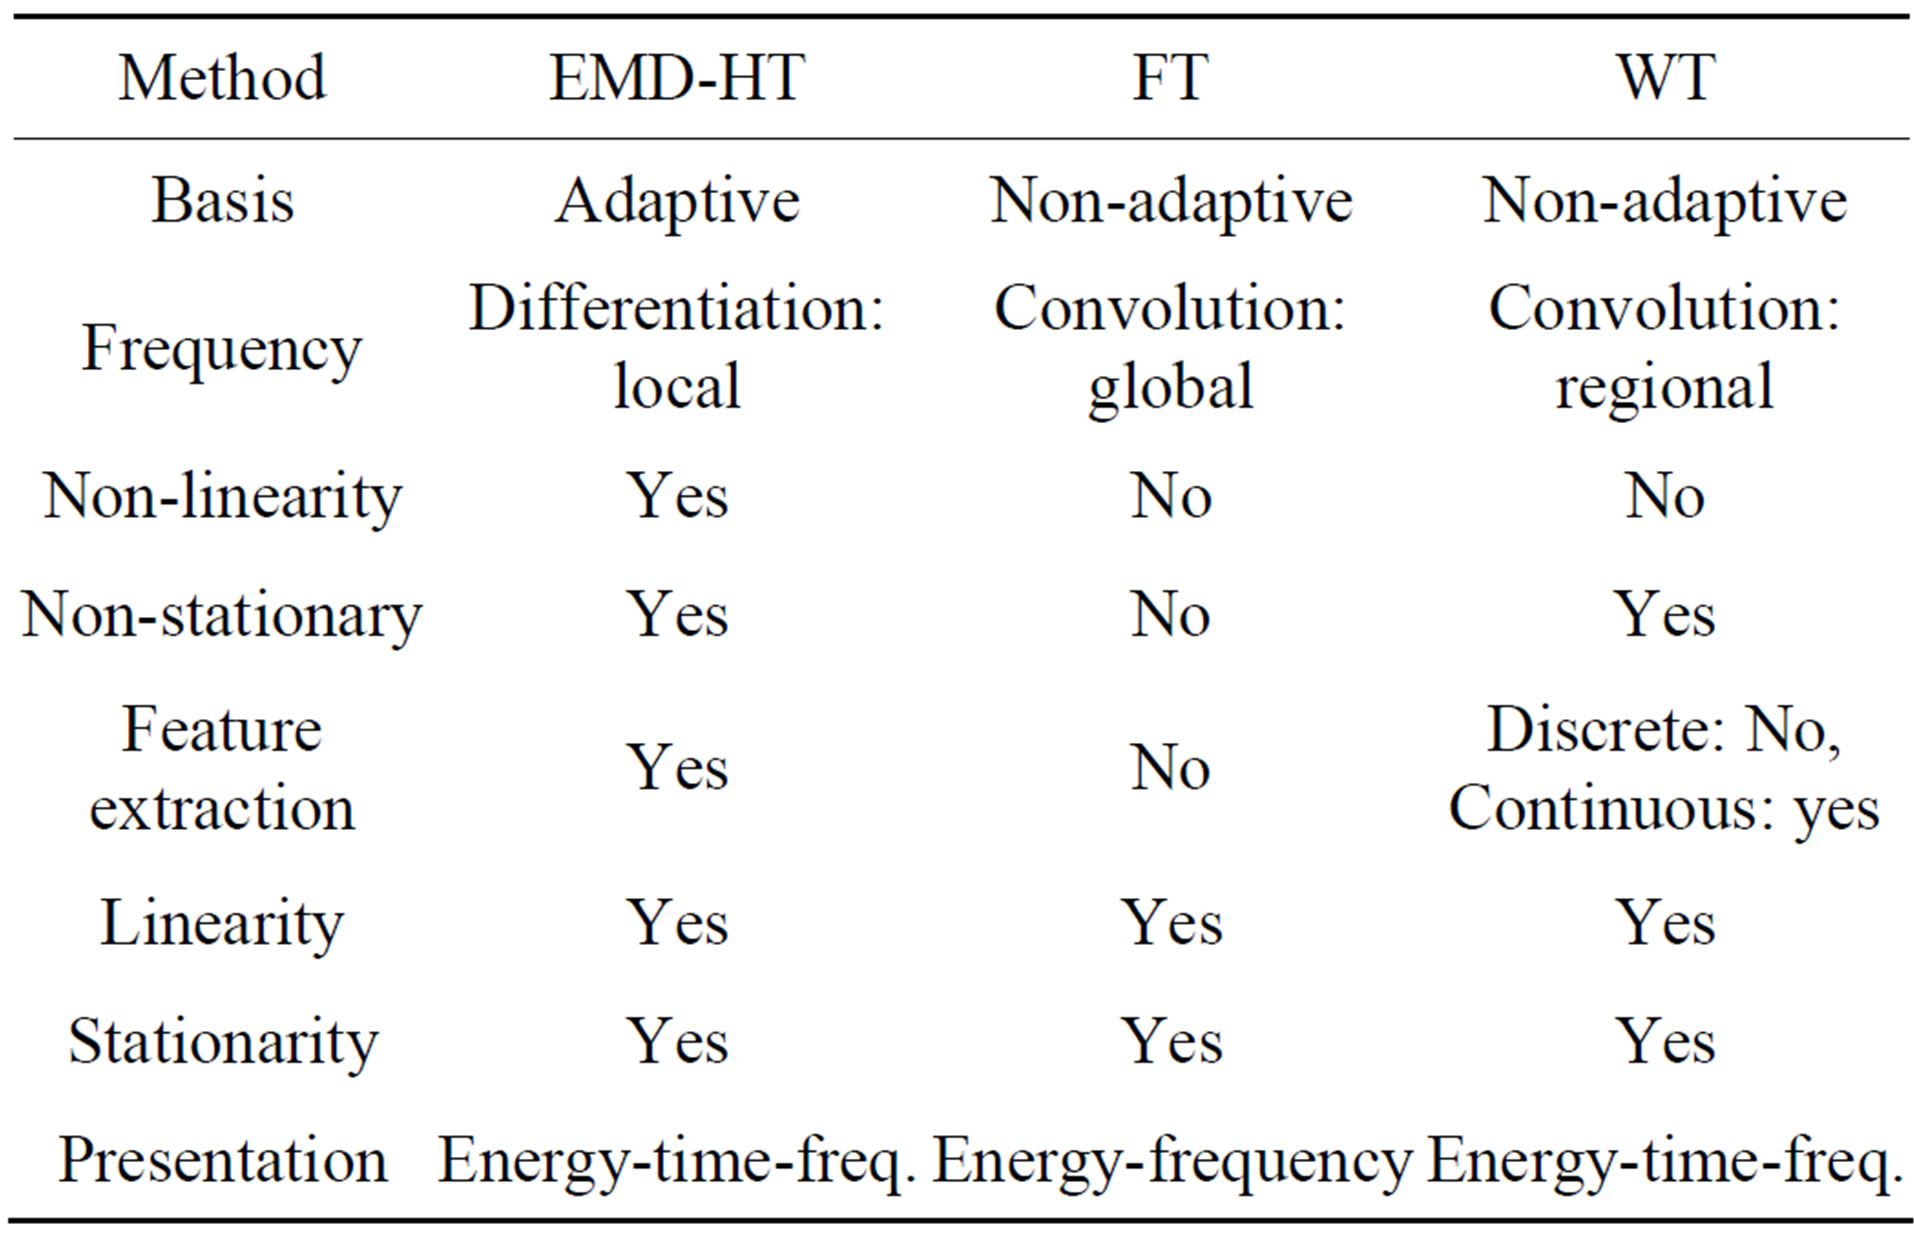
Table 1. Summary of comparison between Fourier Transform, Wavelet Transform and EMD-HT approach at a glance.
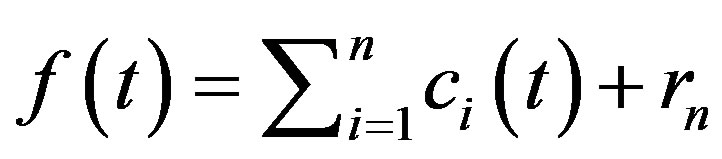
(imf) [5]. According to Huang et al.; 1998, a signal  can be decomposed into imfs such that
  becomes
 (1)
(1)
where ,
,  contains the shortest period component of the signal.
  is the residue which is constant.
The extracted intrinsic mode functions (imf) have the number of extrema and the number of zero crossings equal or differing at most by one, and the mean value between the upper and the lower envelope equal to zero at any point [5,8]. This means that the imfs are symmetric. One imf has a unique instantaneous frequency different from the others. Each imf is a mono-component signal. Hilbert Transform is easily applied to each imf for the determination of instantaneous frequency of each imf [3,9-11].
For , the Hilbert Transform [5,7,12-15] is given as
 (2)
(2)
where H is the Hilbert Transform operator P. V means the Cauchy principal value of the integral.
Let  be.
be.  and
and  form a complex conjugate pair defining an analytic signal
  [16-18].
 (3)
(3)
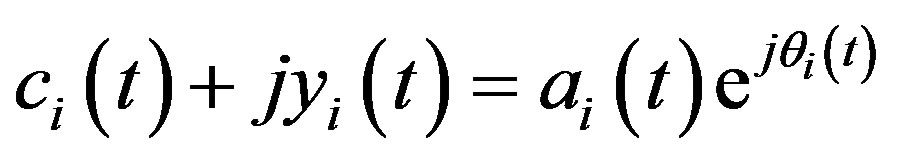 (4)
(4)
where  is the instantaneous amplitude defined as
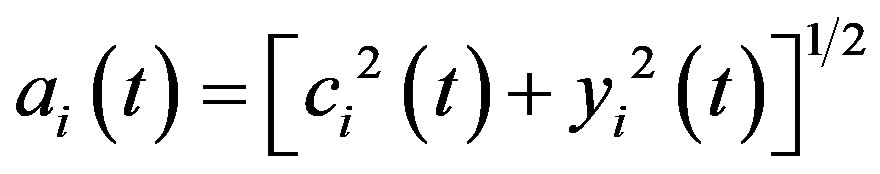 (5)
(5)
And  is the instantaneous phase defined as
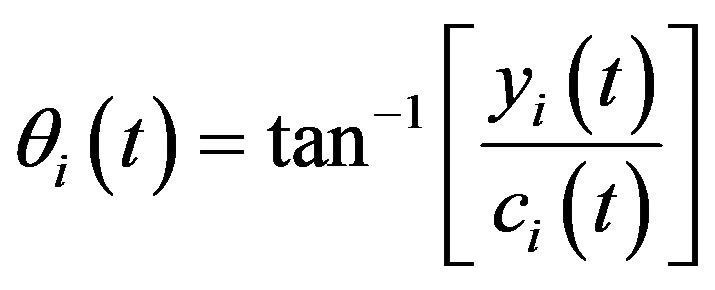 (6)
(6)
Therefore, instantaneous frequency is computed as
 (7)
(7)
The original signal  can be expressed as
 (8)
(8)
Equation (8) enables the instantaneous envelopment and the instantaneous frequency to be represented in three dimensions as a function of time. R in Equation (8) is the real part operator.
4. Observations
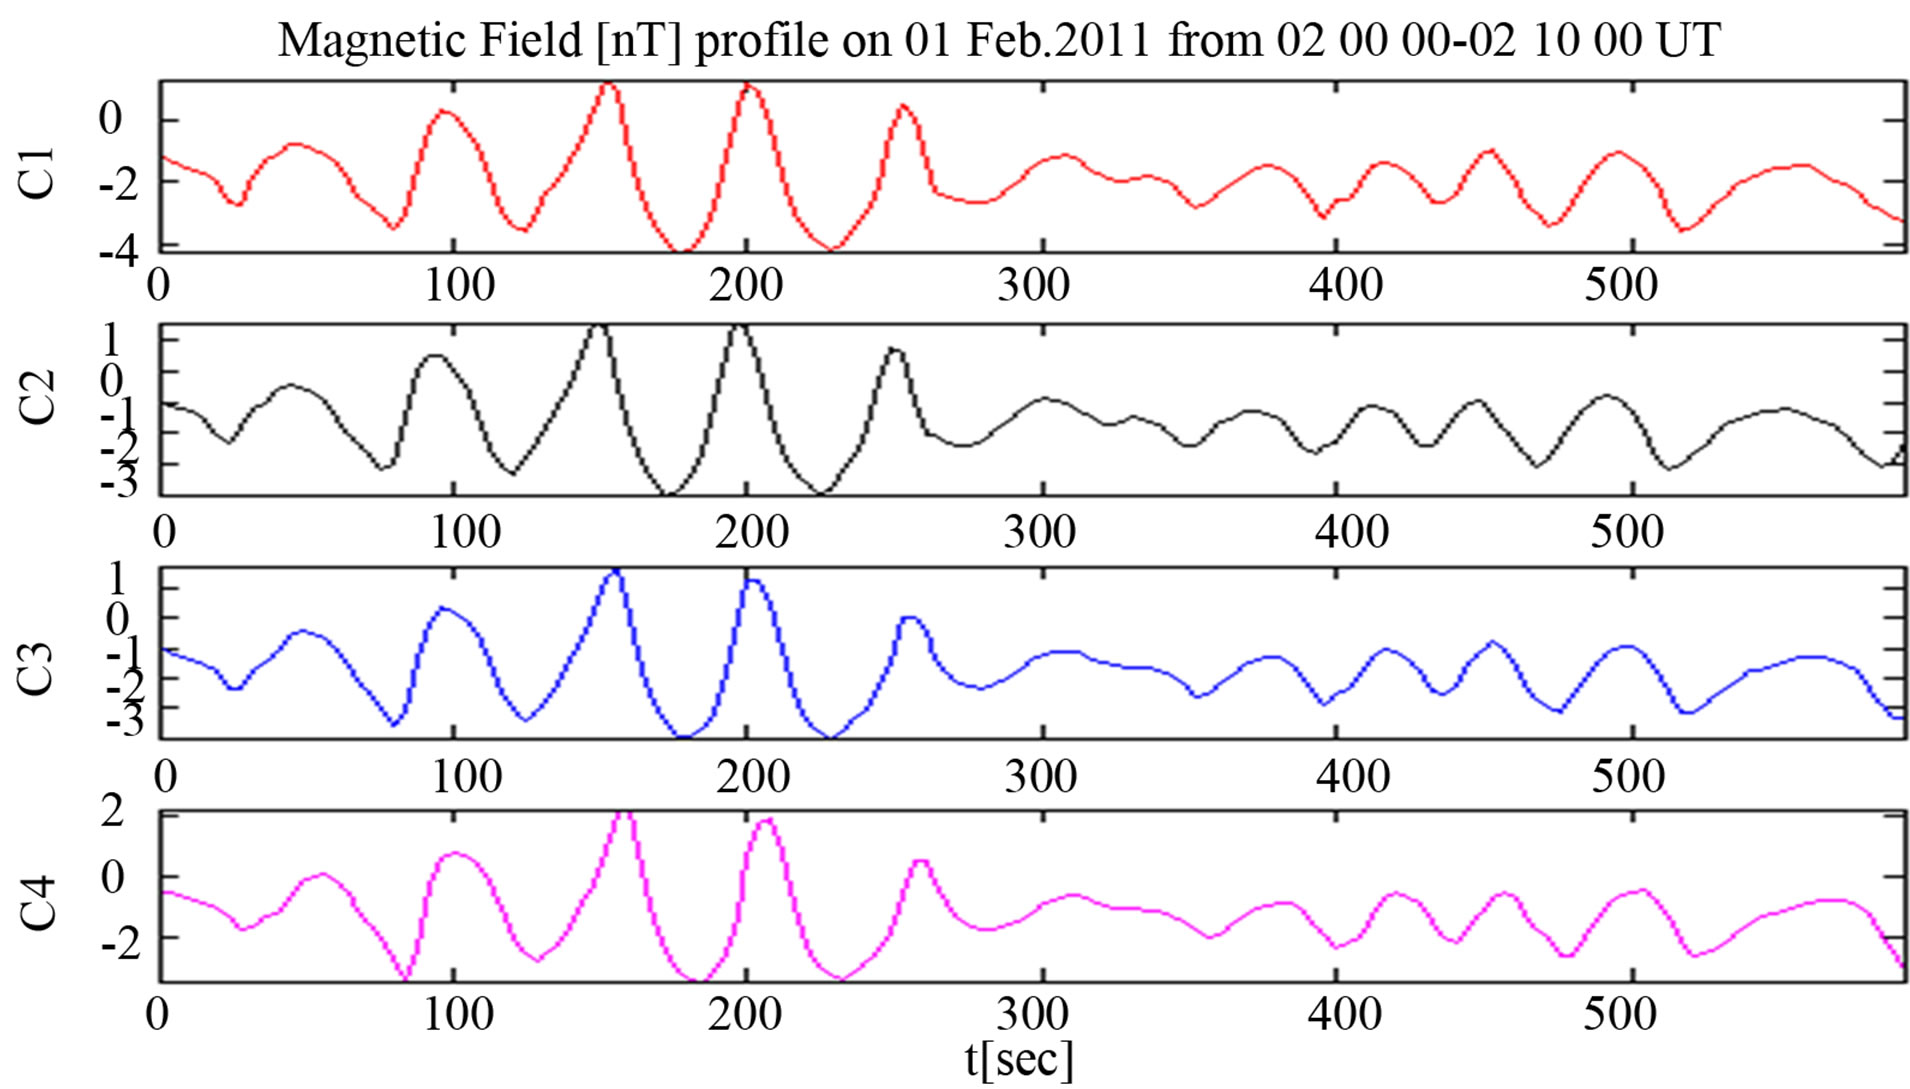
In the analysis of space plasma data collected within the magnetosheath using Fluxgate Magnetometer (FGM) instrument of Cluster spacecraft, the existence of some remarkable difference between the upstream and the downstream shows the possibility of the generation of more waves. This could be due to instabilities arising from the upstream of bow shock, within the magnetosheath or responses of the magnetosphere. The magnetosphere responses to the variations in the magnetosheath through reconnection at the magnetopause which aid transport of mass, momentum, and energy into the magnetosphere which changes the dynamic pressure of the solar wind [19]. In this paper, ten (10) minutes data from FGM instrument taken between the period 02 00 00 and 02 00 10 UT on 01 01 2001 is selected to determine the instantaneous frequency. From magnetic field profile on 01 012001 showing magnitude and all components (x, y, z) of four Cluster spacecraft crossing the bow shock into the magnetosheath in Figure 1, the selected magnetic field profile of 10-mins data is shown below, featuring a waveform that is modulated in both amplitude and frequency (see Figure 2" target="_self"> Figure 2(a))
5. Results
EMD has been used for the extraction of the various constituent signals embedded in the data. This leads to the determination of instantaneous envelopment in Figure 2(b). This is achieved by forming envelopes on maxima and minima. The envelopes of the maxima and minima alongside their mean are shown in Figure 2(b) determined using cubic spline fitting. The subtraction of the mean from the original data gives the first imf (imf1) if the sifting conditions are met. This process continues until the sifting is completed. Using the y-components of the magnetic field selected with the magnetosheath region between the period 300 - 1000 s in Figure 1, the decomposition of the original data (signal) using EMD gives first, second, third, fourth imfs and the residue (constant) (see Figure 3). Using Hilbert Transform (HT) on the extracted imfs; the first, second, third and the
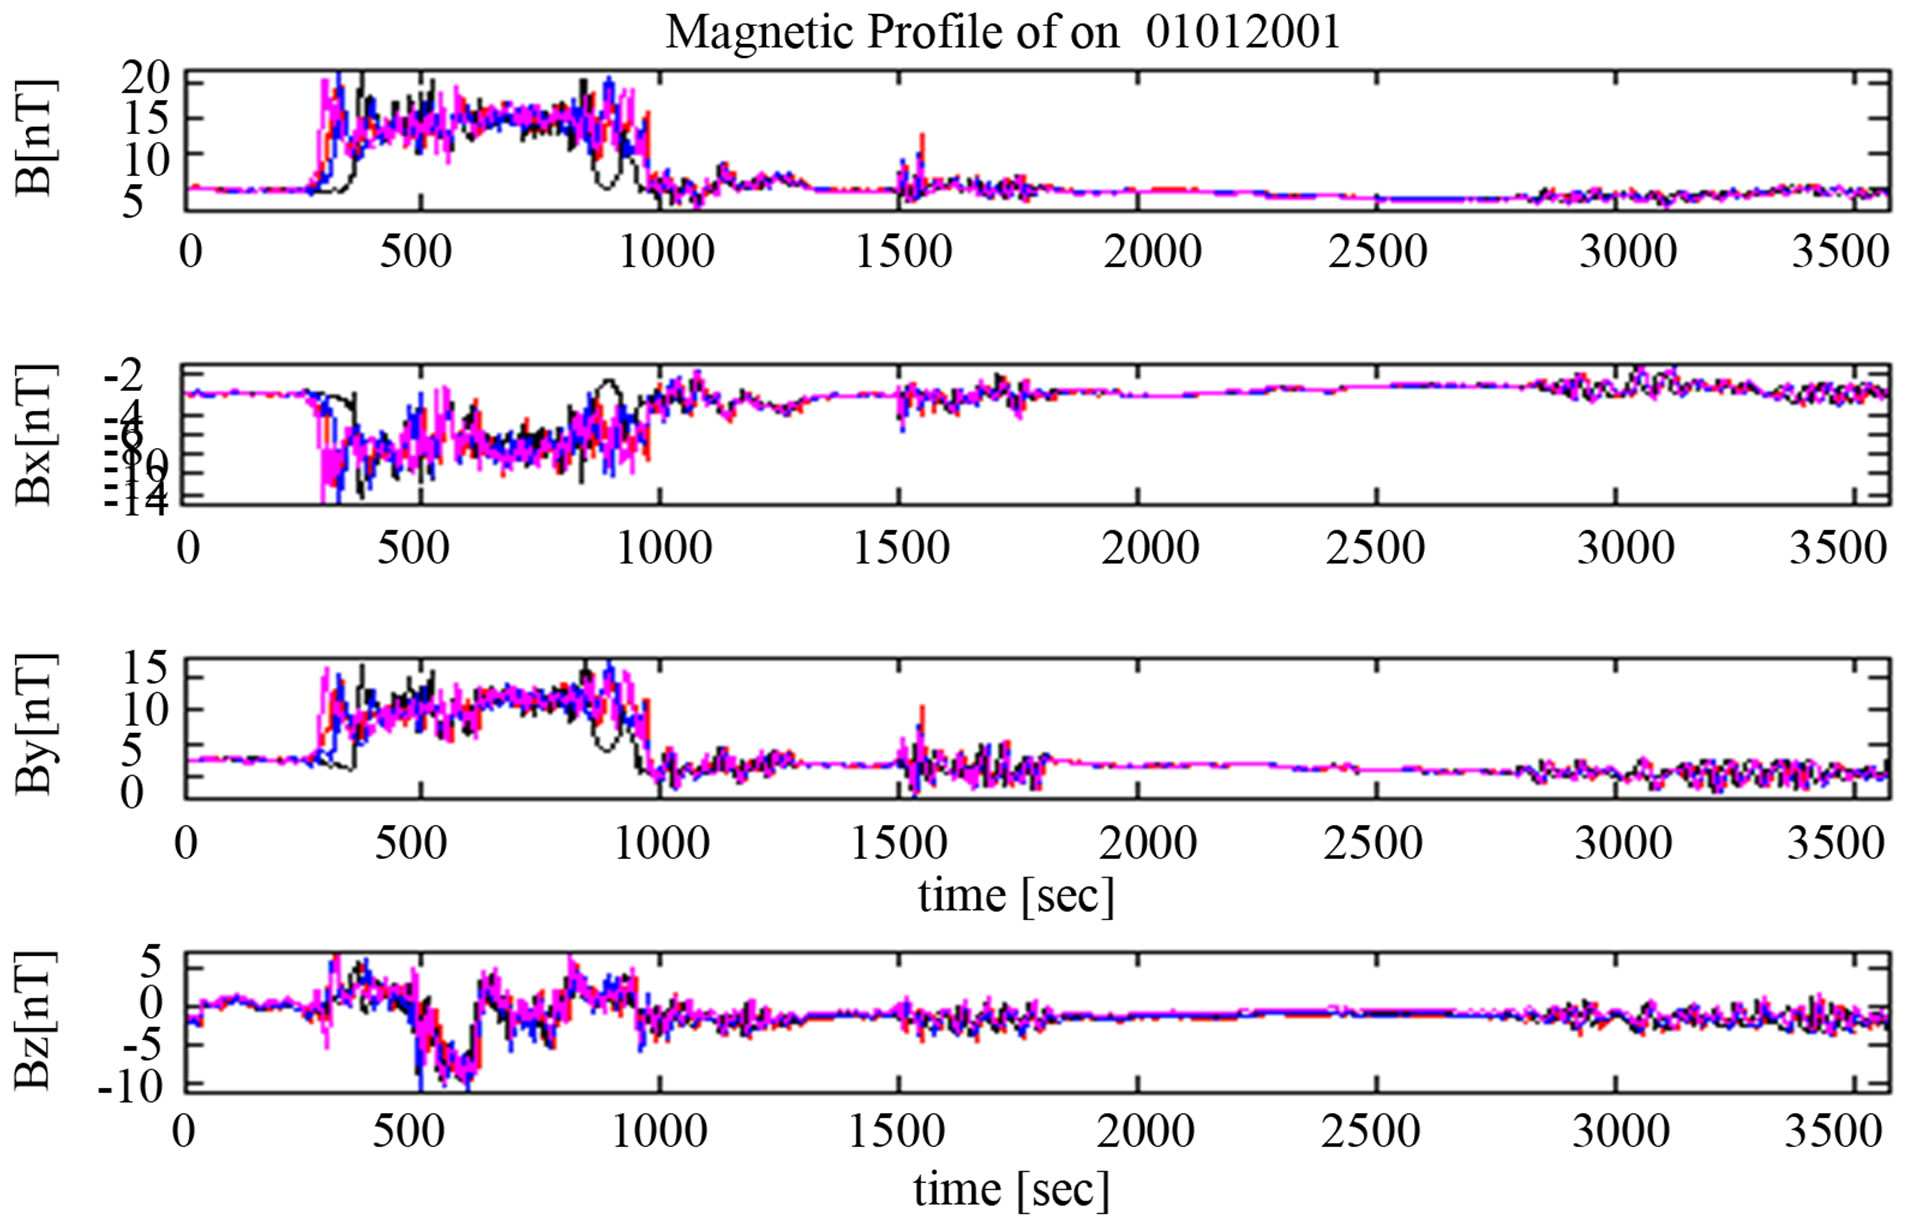
Figure 1. The magnetic profile on 01 Feb 2001. Cluster C1 is red, C2 is black, C3 is blue and C4 is magenta.
 (a)
(a)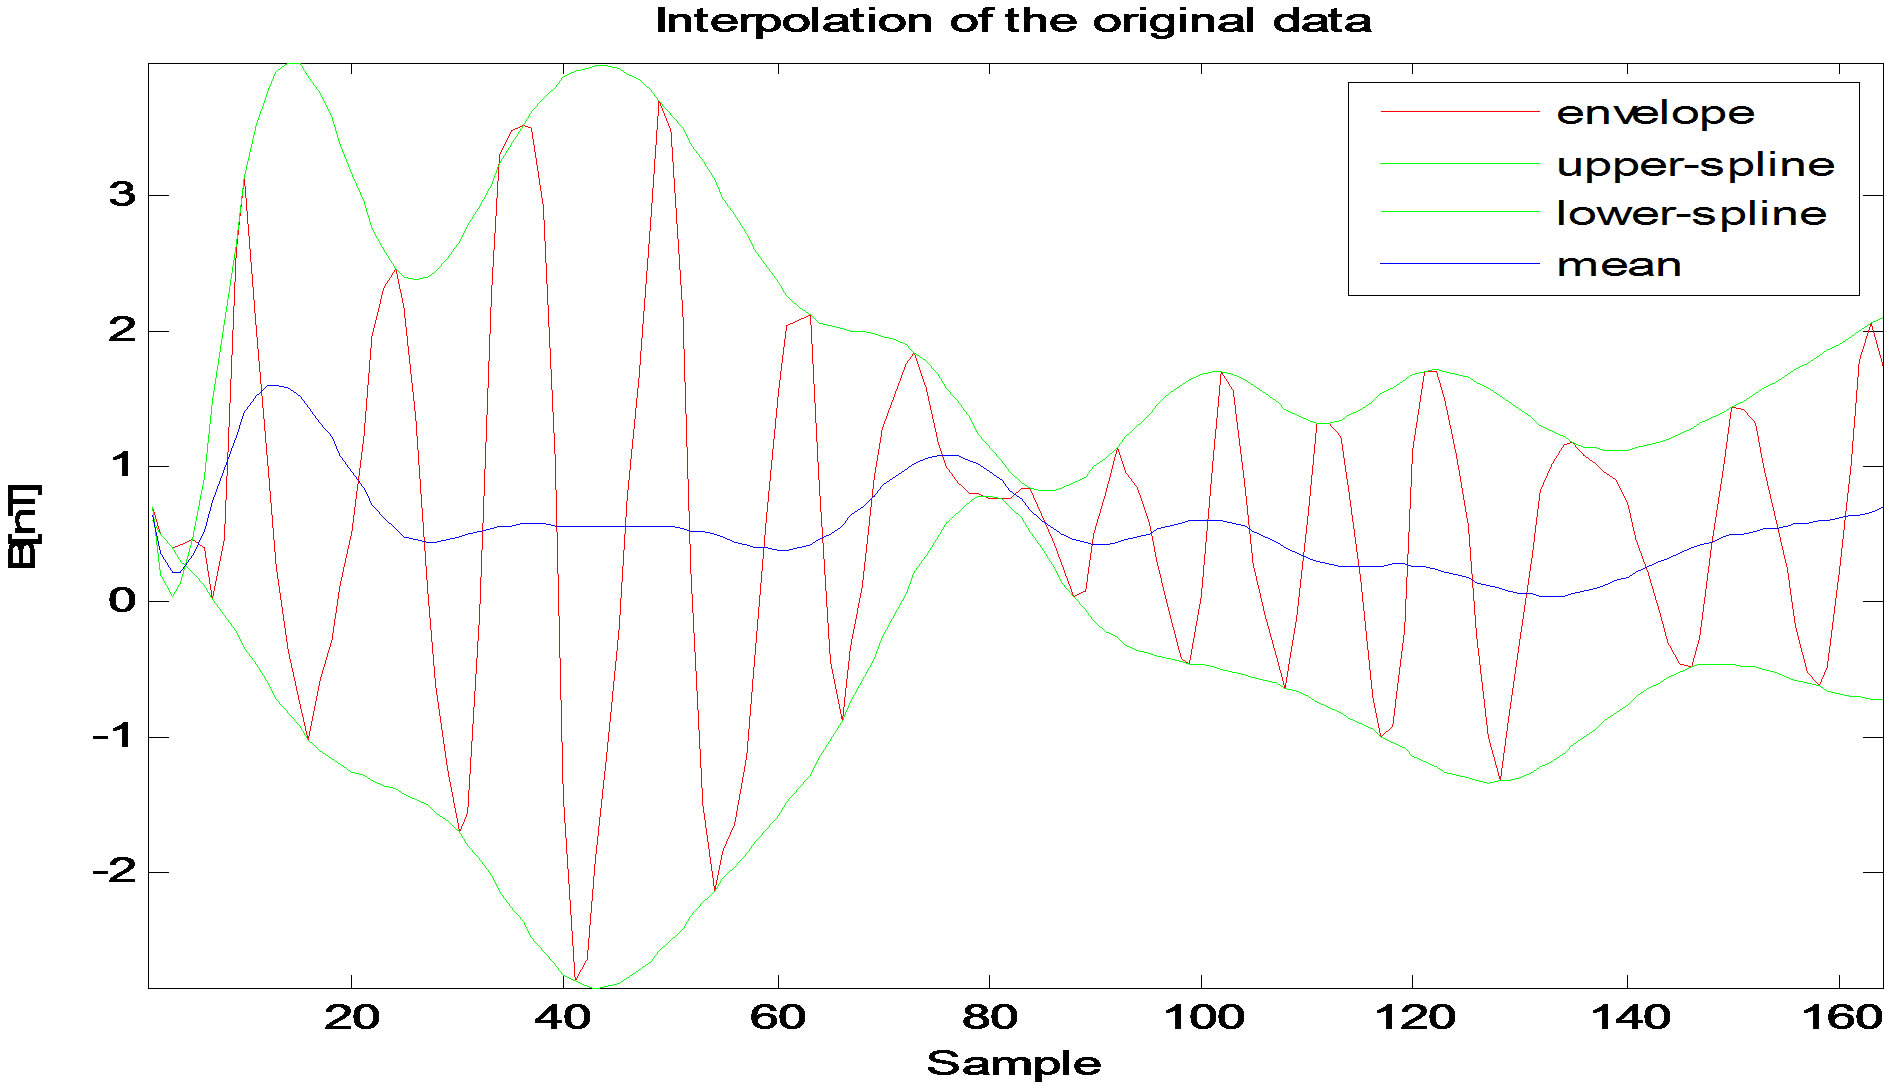 (b)
(b)
Figure 2. (a) Ten (10) minutes magnetic field data from FGM instrument taken between the period 02 00 00 and 02 00 10 UT on 01 01 2001; (b) The envelopment of the maxima and minima and the mean of the envelope of magnetic field data. The number of sample n, which is an integer and the sampling period T were used for a signals (data) which were discretized for time t = nT.
fourth imf, the instantaneous frequencies are determined as shown in Figure 4" target="_self"> Figure 4. The original data used in all these have been sampled with frequency having a nyquist frequency of about 0.13 Hz. This simply informs that the power spectra of the imf above this value will alias. The plot of instantaneous frequencies of imf2 and imf3 has been divided into portion A, B and C as shown in Table 2. Correlation and coherency table has been formed for the different portions A, B and C of the instantaneous frequencies of imf2 and imf3 as shown below.
6. Discussion
In Figure 4, the frequency axis allows us to see the time instant of the frequency of the imf. It is obvious from this figure that imf1 has frequency modulation that exceeds the Nyquist frequency (0.13 Hz). It is also very clear that
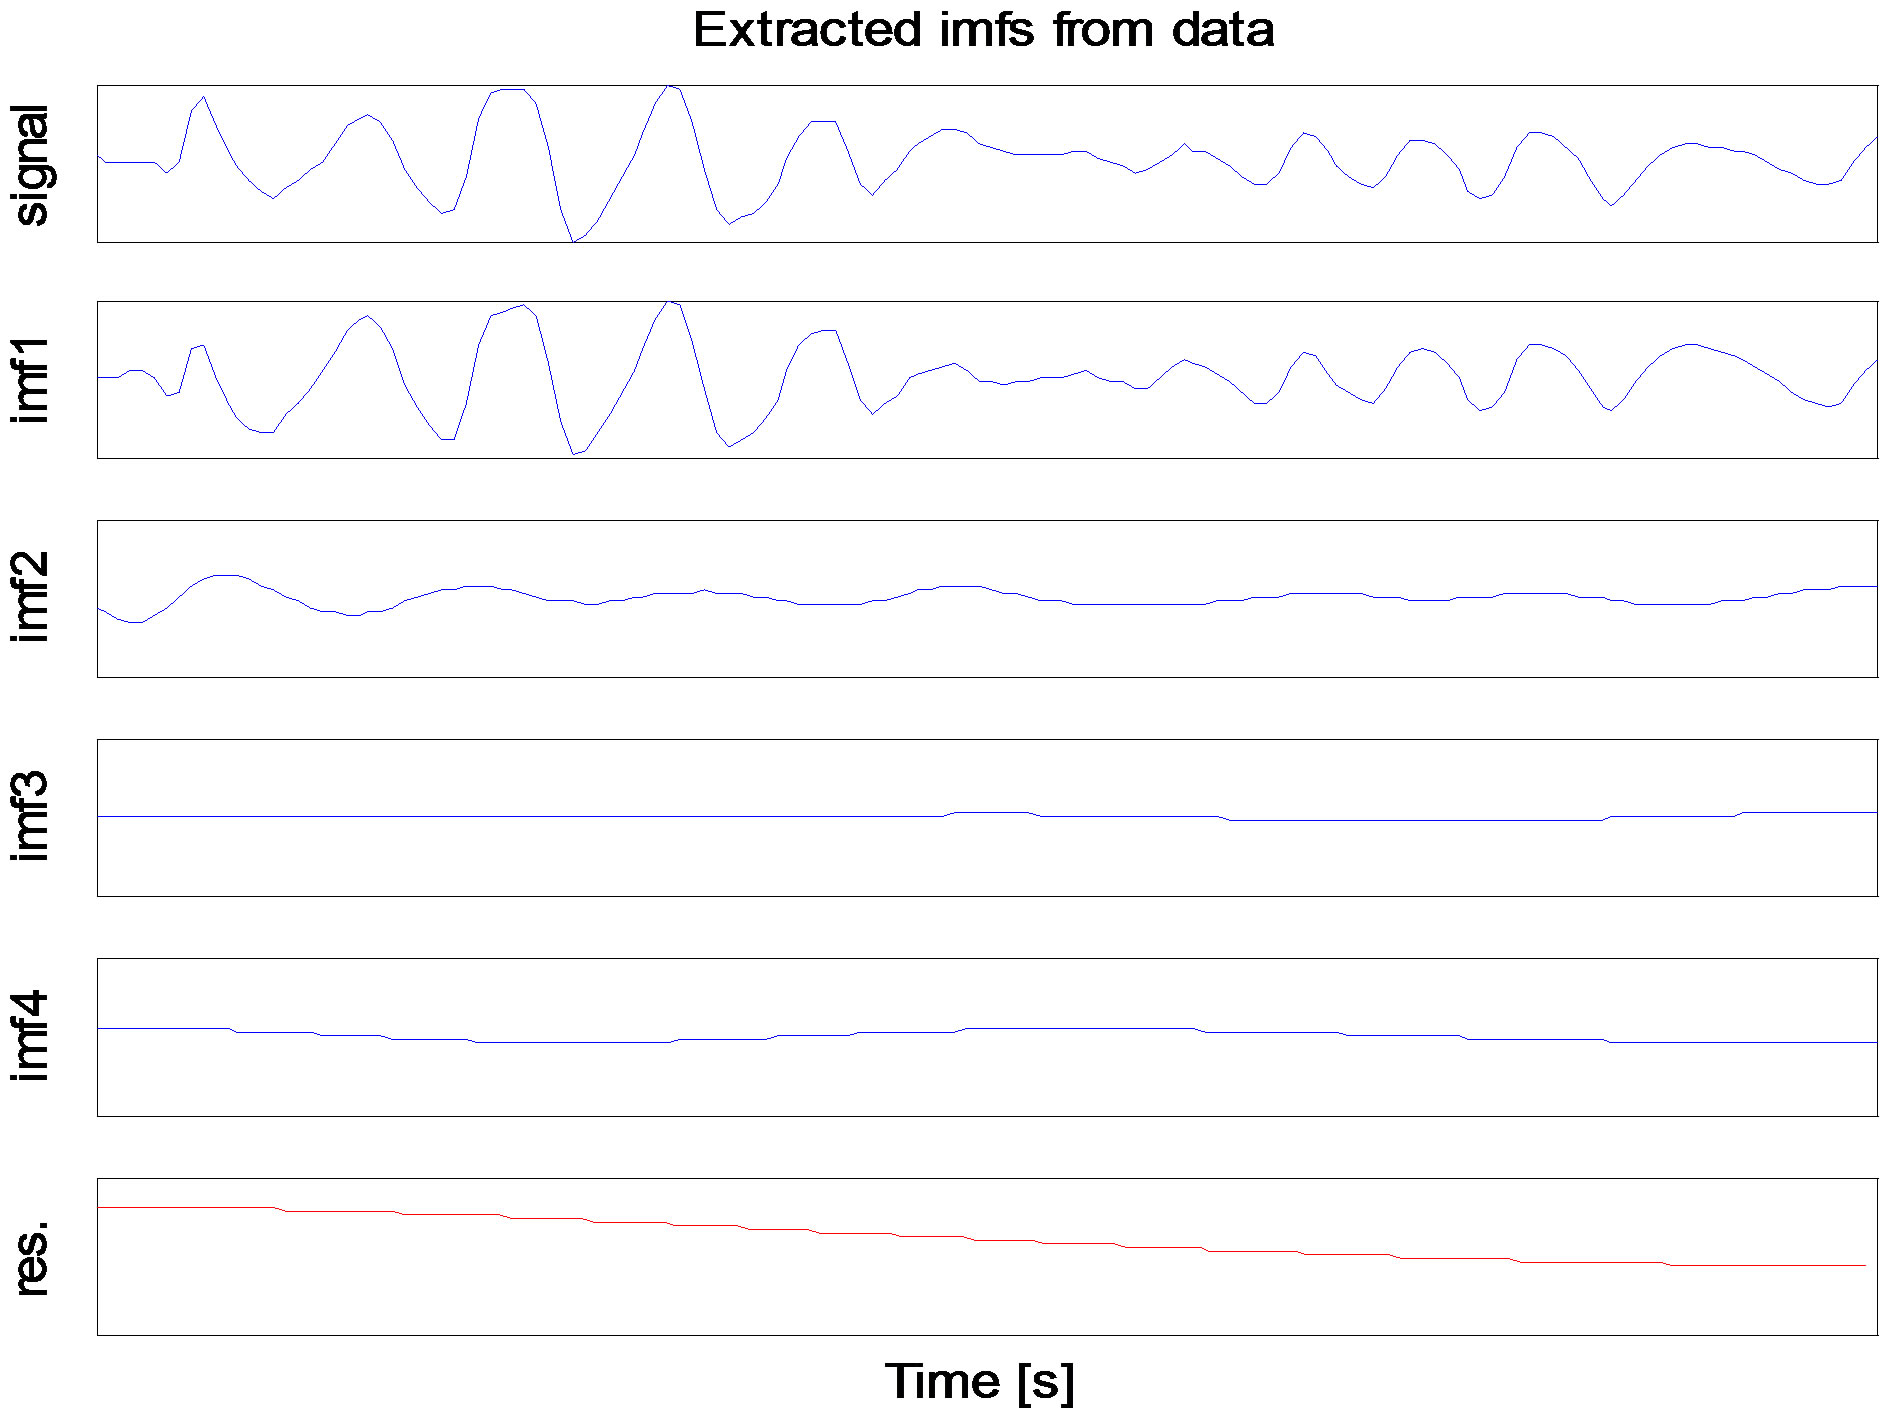
Figure 3. The extracted imfs using EMD. From top to bottom: First panel displays the original data, second panel displays the first imf, third panel shows the second imf, fourth panel shows the third imf, fifth panel shows the fourth imf and the bottom panel shows the residue.
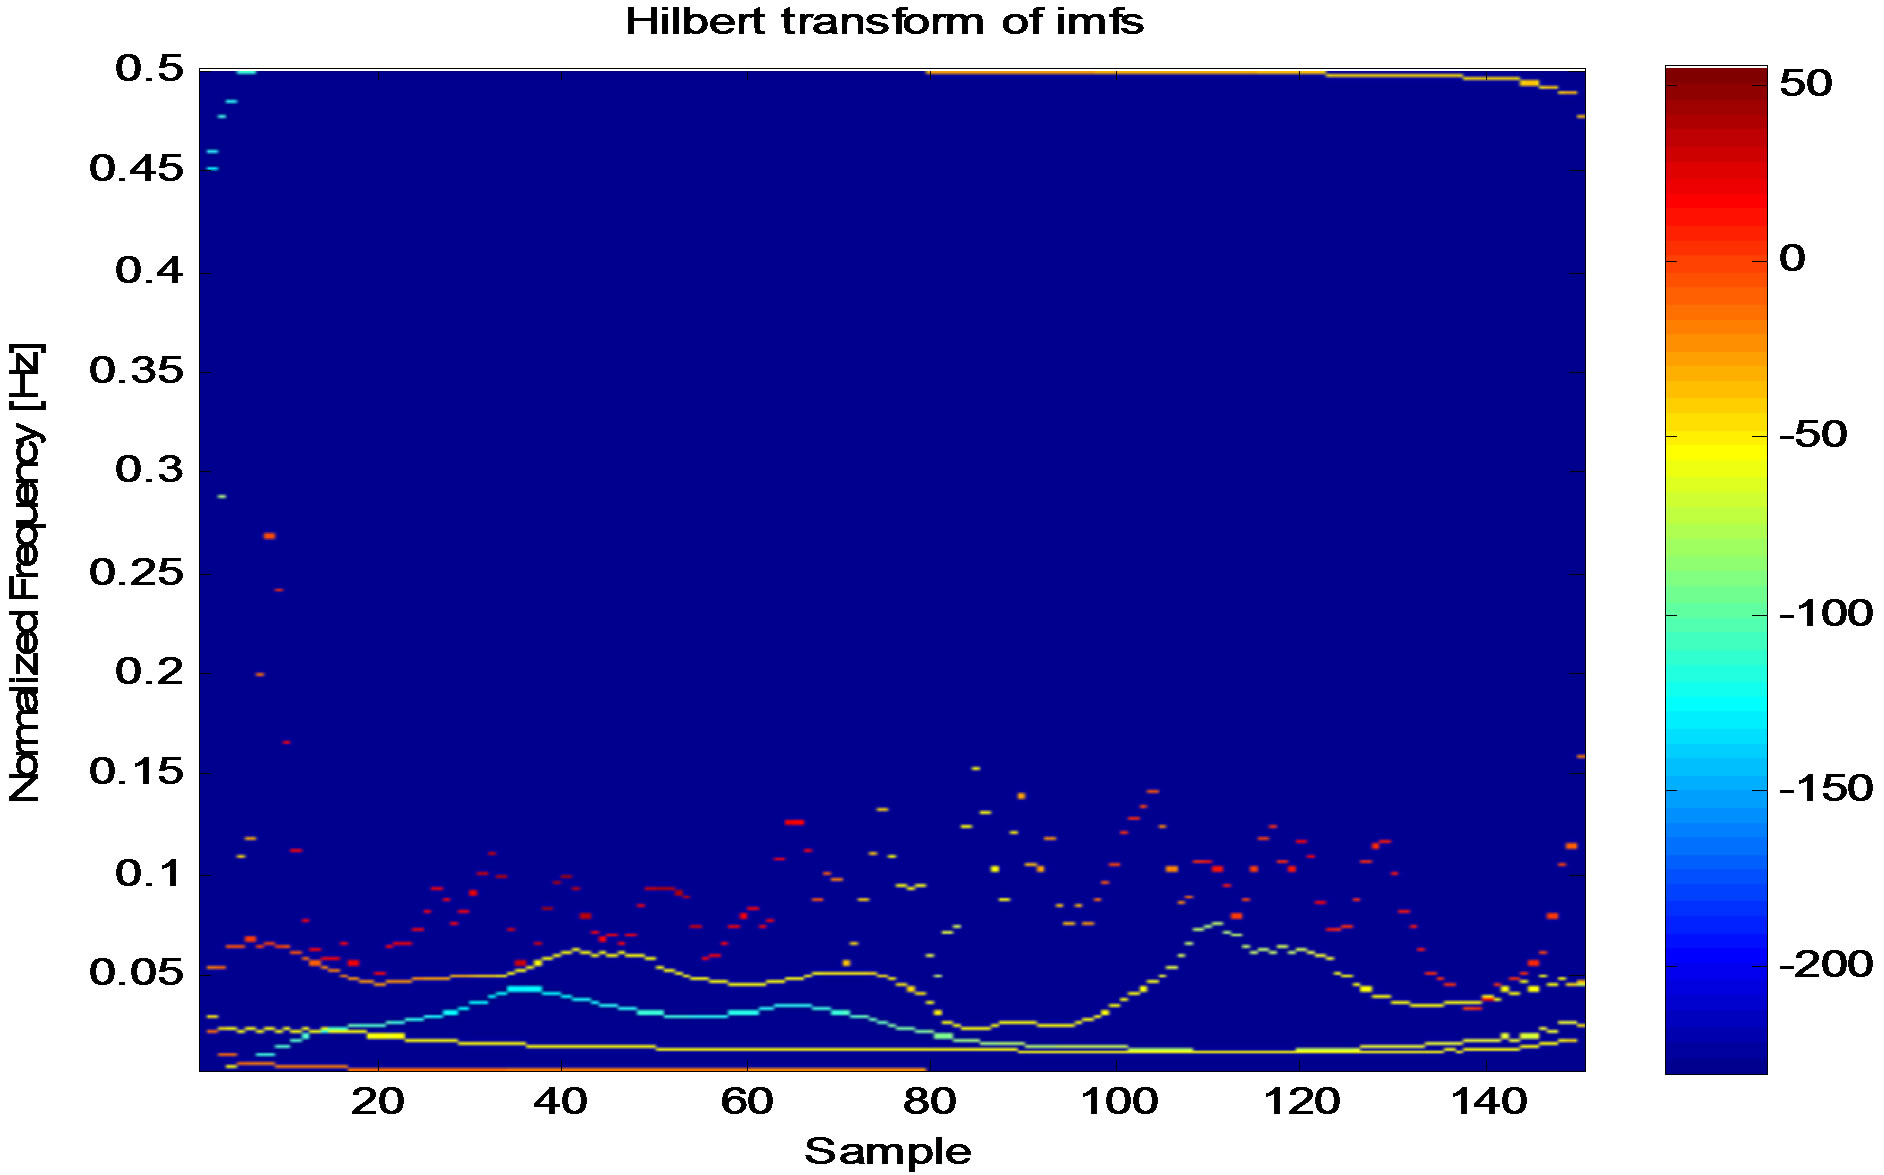
Figure 4. The instantaneous frequencies (IF) of all the extracted intrinsic modes from magnetic field data on 01 Feb. 2001 from 02 00 00 - 02 10 00 UT using Simple Hilbert Transform.
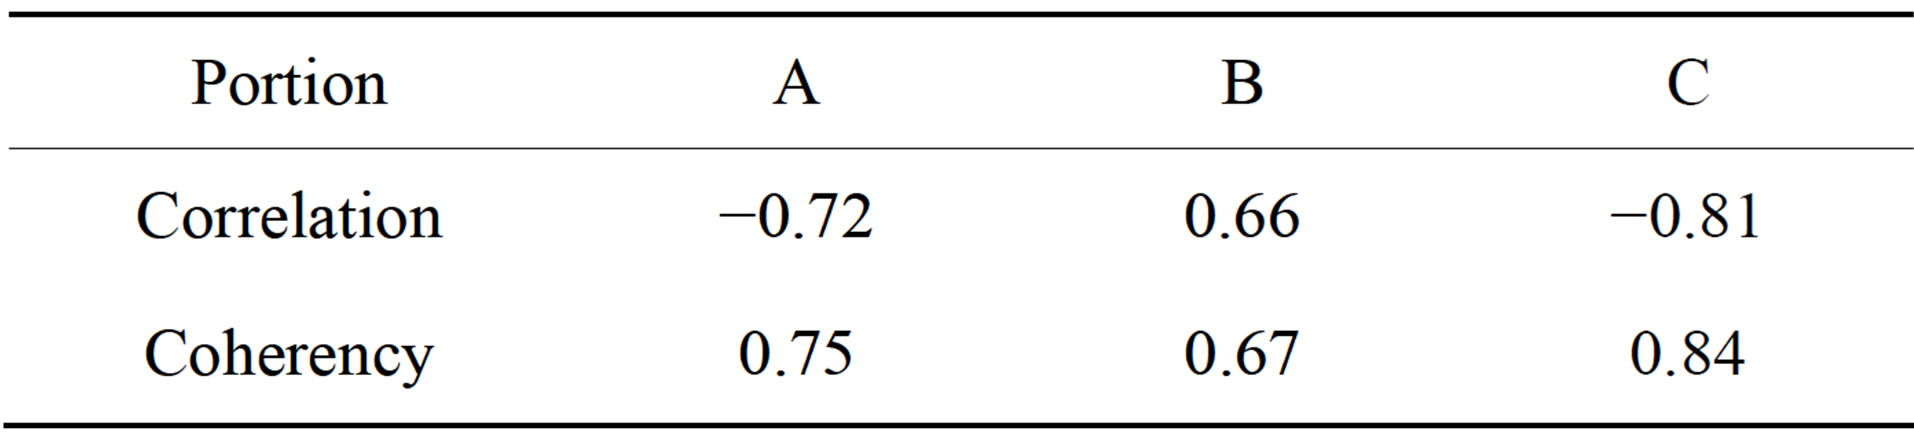
Table 2. Correlation and coherency table for the instantaneous frequencies of imf2 and imf3 divided into portions A, B and C.
the instantaneous frequencies of imf2, imf3 and imf4 modulate with slow variation in the amplitude. Imf2 and imf3 show clear modulation in frequency. But imf4 shows a steady instantaneous very low frequency. The instantaneous frequencies (IF) of 2nd and 3rd imfs have been shown in Figure 4. The instantaneous frequency of the second imf varies between 0.00 and 0.04 Hz, while the instantaneous frequency of the third imf varies between 0.02 and 0.07 Hz. The mean value of frequency of imf2 is about 0.02 Hz (20 mHz) and the mean value of the frequency of imf3 is about 0.045 Hz (45 mHz) (see Figure 5" target="_self"> Figure 5). This plot has been divided into A, B, and C portions. Portion A covers 1 - 20 samples, B covers 20 - 80 samples, and C covers 100 - 125 samples. Portion A shows anti-phase superposition of two instantaneous frequencies, B shows in-phase superposition and C shows another anti-phase superposition. Figure 5" target="_self"> Figure 5: The instantaneous frequencies (IF) of 2nd and 3rd imfs of magnetic field data on 01 Feb, 2001 from 02 00 00 - 02 10 00 UT using simple Hilbert transform. From the Table 1, the correlation and coherency have been computed and for 2nd and 3rd imfs, and the result shows superposition between the two frequency modes. An obvious negative correlation and a strong coherency in portion A explains the attenuated waveform in that portion of the original 10-minute data which is due to out of phase superposition. Positive correlation and strong coherency in portion B shows an in-phase superposition which is also found in enhanced amplitude of the 10-minute magnetic field data. Portion C has a high negative correlation and a very strong coherency that explains the high attenuation in the waveform of the 10-minutes magnetic field data of Figure 2.
7. Conclusion
All of the above analysis confirms the statistical significance of the second and the third imf extracted using EMD and the subsequent application of the Hilbert transform to determine the instantaneous frequencies. The magnetic field data in Figure 1 show an active
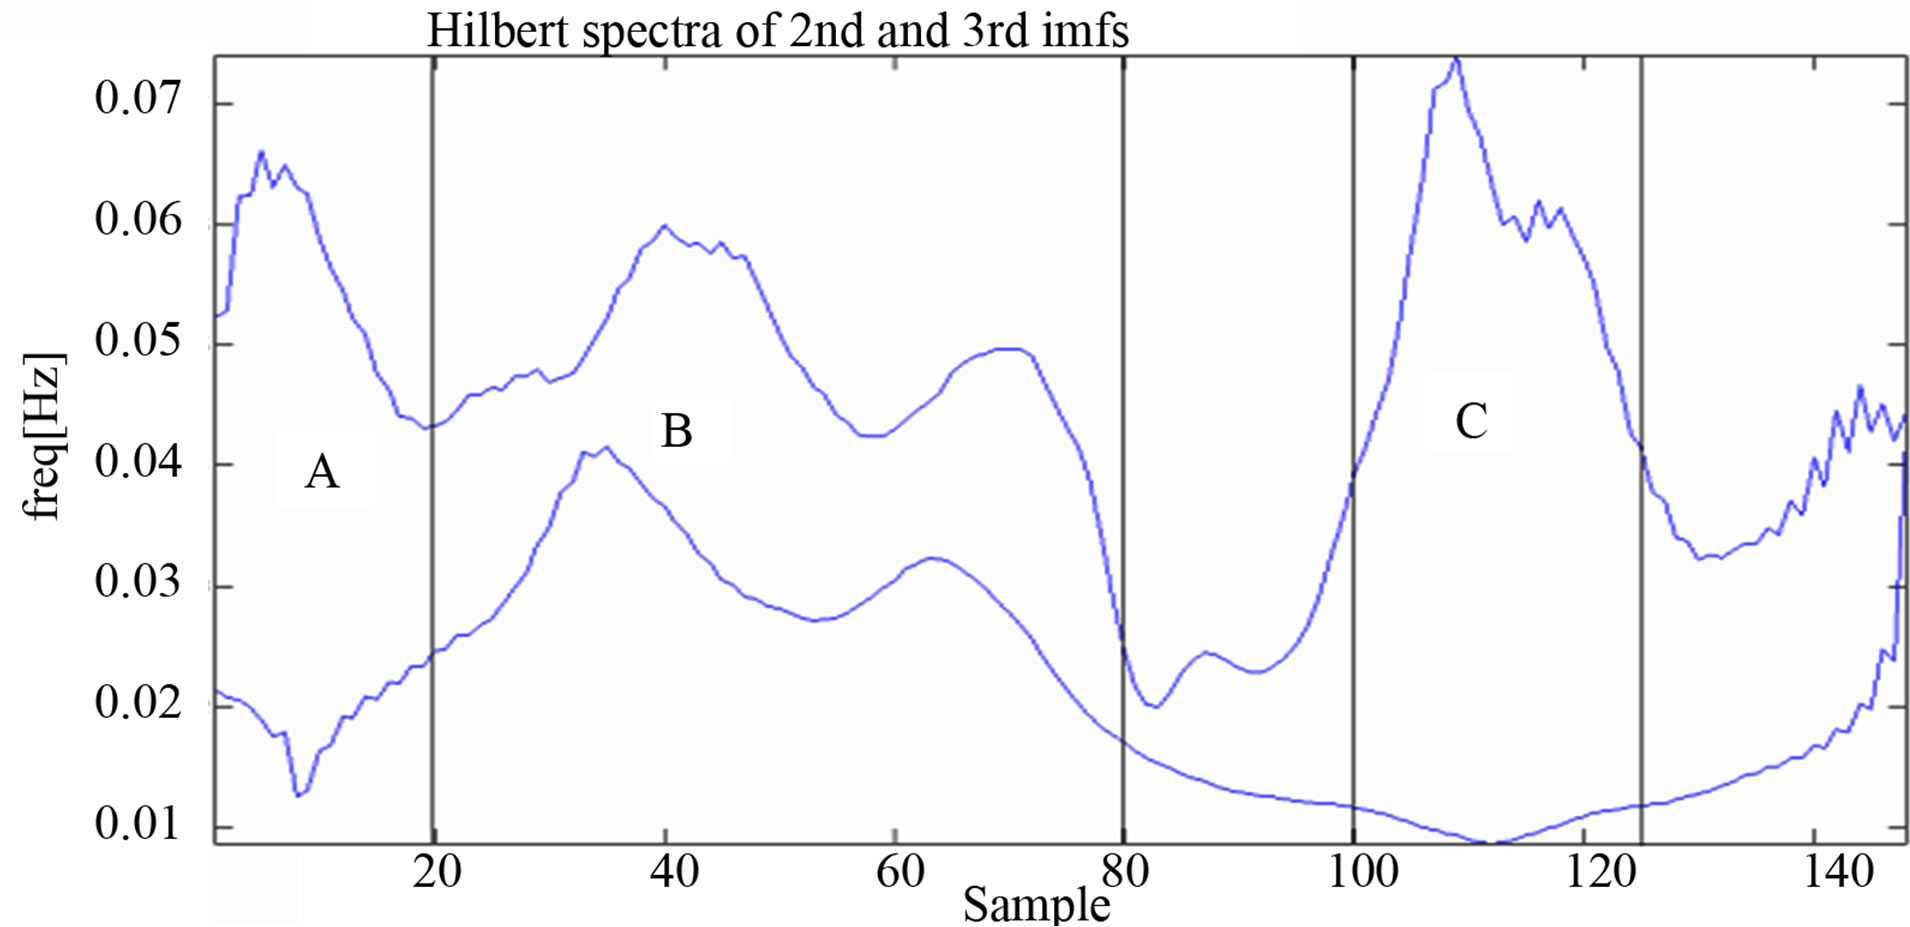
Figure 5. The instantaneous frequencies (IF) of 2nd and 3rd imfs of magnetic field data on 01 Feb. 2001 from 02 00 00 - 02 10 00 UT using Simple Hilbert Transform.
magnetic field profile as the spacecraft move from the solar wind regime into a turbulent regime crossing the bow shock. The waveform informs that this region of magnetosheath requires special attention. The analysis above shows that it is possible that the complex behaviour (non-linear) is due to superposition of more waves. These waves could be due to the activity at both the up stream of the bow shock and the magnetosphere across magnetopause. We have shown that the complex waveform of the selected magnetic field has waves that have been superimposed. The determined instantaneous frequencies can be used to determine the wave vectors which will give detailed understandings of behavior of plasma waves in the region (magnetosheath).
REFERENCES
- W. Baumjohann and R. A. Treumann, “Basic Space Plasma Physics,” Imperial College Press, London, 1996.
- M. G. Kivelson and C. T. Russell, “Introduction to Space Physics,” Cambridge University Press, Cambridge, 1995.
- B. Boashash, “Estimating and Interpreting the Instantaneous Frequency of a Signal. Part 1: Fundamentals,” Proceedings of the IEEE, Vol. 80, No. 4, 1992, pp. 520-538. http://dx.doi.org/10.1109/5.135376
- T. Berkant and P. J. Loughlin, “Instantaneous Frequency and Time-Distributions,” Proceedings of the IEEE, Vol. 2, No. 5, 1995, pp. 1013-1016.
- N. E. Huang, Z. Shen, S. R. Long, M. C. Wu, H. H. Shih, Q. Zheng, N.-C. Yen, C. C. Tung, H. H. Liu, N. E. Huang, Z. Shen, S. R. Long, M. C. Wu, H. H. Shih, Q. Zheng, N. Yen, C. C. Tung and H. H. Liu, “The Empirical Mode Decomposition and the Hilbert Spectrum for Nonlinear and Non-Stationary Time Series Analysis,” Proceedings of the Royal Society of London A, Vol. 454, No. 1971, 1998, pp. 903-995. http://dx.doi.org/10.1098/rspa.1998.0193
- J. S. Cheng, D. J. Yu and Y. Yang, “Research on the Intrinsic Mode Function (IMF) Criterion in EMD Method,” Mechanical Systems and Signal Processing, Vol. 20, No. 4, 2006, pp. 817-824. http://dx.doi.org/10.1016/j.ymssp.2005.09.011
- E. U. Nathaniel, “Analysis of Low Frequency Plasma Waves in the Turbulent Magnetosheath; Downstream of the Earth’s Bow Shock,” Ph.D Thesis, University of Sussex, 2010.
- E. Delechelle, J. Lemoine and O. Niang, “Emperical Mode Decomposition: An Analytical Approach for Sifting Process,” IEEE Signal Processing Letters, Vol. 12, No. 11, 2005, pp. 764-767. http://dx.doi.org/10.1109/LSP.2005.856878
- T. D. Carozzi, A. M. Buckley and M. P. Gough, “Instantaneous Wave-Vector Estimation from Multi-Spacecraft Measurements Using Few Spatial Points,” Annales Geophysicae, Vol. 22, 2004, pp. 2633-2641. http://dx.doi.org/10.5194/angeo-22-2633-2004
- L. Cohen, “Time-Frequency Analysis,” Prentice Hall PTR, Upper Saddle River, 1995.
- R. C. Sharpley and V. Vatchev, “Analysis of the Intrinsic Mode Functions,” Technical Report, Department of Mathematics, University of South Carolina, 2004.
- P. Flandrin, G. Rilling and P. Goncalves, “Empirical Mode Decomposition as a Filter Bank,” Signal Processing Letters, Vol. 11, No. 2, 2004, pp. 112-114. http://dx.doi.org/10.1109/LSP.2003.821662
- N. E. Huang, M. Wu, W. Qu, S. R. Long and S. Shen, “Application of Hilbert-Huang Transform to Non-Stationary Financial Time Series Analysis,” Applied Stochastic Models in Business and Industry, Vol. 19, No. 3, 2003, pp. 245-268.
- N. Huang, “Hilbert-Huang Transform and Its Applications,” World Scientific Publishing Co. Pte Ltd., Singapore City, 2005.
- G. Rilling and P. Flandrin, “On the Influence of Sampling on the Empirical Mode Decomposition,” IEEE International Conference on Acoustics, Speech and Signal Processing, Vol. 3, Toulouse, 14-19 May 2006, p. 4.
- E. Bedrosian, “A Product Theorem for Hilbert Transform,” Proceedings of the IEEE, Vol. 51, No. 5, 1963, pp. 868- 869. http://dx.doi.org/10.1109/PROC.1963.2308
- D. Gabor, “Theory of Communication,” Journal of IEE, Vol. 93, Part III, No. 26, 1946, pp. 429-457.
- L. Helong, X. Deng and H. Dai, “Structural Damage Detection Using the Combination Method of EMD and Wavelet Analysis,” Mechanical Systems and Signal Processing, Vol. 21, No. 1, 2007, pp. 298-306. http://dx.doi.org/10.1016/j.ymssp.2006.05.001
- G. K. Parks, “Physics of Space Plasmas: An Introduction,” Addison-Wesley Publishing Company, Redwood City, 1991.
NOTES
*Corresponding author.