Journal of Signal and Information Processing
Vol. 3 No. 3 (2012) , Article ID: 22142 , 8 pages DOI:10.4236/jsip.2012.33054
A New Algorithm for Automatic Double Bright Fringe of Multiple-Beam Fizeau Fringe Skeletonization Using Fourier Transform Method of Fringe Pattern Analysis
![]()
1Physics Department, College of Science and Humanitarian Studies, Salman Bin Abdulaziz University, Al-Kharj, KSA; 2Physics Department, Faculty of Science, Mansoura University, New Damietta, Egypt.
Email: elmorsym@yahoo.com
Received May 18th, 2012; revised June 20th, 2012; accepted June 29th, 2012
Keywords: Automatic Fringe Analysis; Multiple-Beam Fizeau Fringe; Fourier Transform
ABSTRACT
The interferogram of multiple-beam Fizeau fringe technique plays an important role to investigate the optical properties of fiber because this interferogram provides us with useful information which can used to determine the dispersion curve of the fiber sample. A common problem in any interferogram analysis is the accuracy in locating fringe centers (fringe skeleton). There are a lot of computer-aided algorithms, which depend on the interferogram types, used to fringe skeleton extraction of various digital interferogram. In this paper, as far as I know, a novel algorithm for fringe skeleton extraction of double bright fringe of multiple-beam Fizeau fringe is presented. The proposed algorithm based on using the different order of Fourier transform and the derivative-sign binary image. Also the proposed algorithm has been successfully tested by using a computer simulation fringe and an experimental pattern. The results are compared with the original interferogram and shown a good agreement.
1. Introduction
Nowadays, the intensive progress in development of laser sources and optical elements has challenged scientists to use the interferometry as an important diagnostic tool for accurate and gross field measurements of a various phenomena. These challenges have resulted in an accurate measurement in almost all engineering domains. For example in chemical engineering, materials science and physical fields, refractive index measurement is frequently needed.
There are many non-invasive interferometric techniques for measuring the refractive index profile and other related optical properties of fibers [1-4]. All of these techniques have their own advantages and disadvantages. The main advantages of these interferometric techniques, with respect to well established techniques, are that the sensitivity, accuracy, and non-contact characteristics. Furthermore, the most important of interferometric techniques over other techniques is that they are full-field, i.e. information about all points in the field can be recorded and observed simultaneously.
All of interferometric techniques based on the transformation of the phase differences of the wave fields, which is in turn related to a variety of physical properties, into observable intensity variation. In other words, the direct result of an interferometric technique is generally fringe pattern or interferogram. This interferogram provides us with rich quantitative information regarding sample material behavior.
In the past, the interferogram must be photographed and enlarged to a suitable magnification then the required data are obtained from the magnified image [5-8]. The manual quantitative analysis process is time consuming and very tedious, furthermore cannot make a full use of the interferogram’s data. For this reason, automatic image processing of these interferograms is an active topic in recent literature [9-11].
Recently, the trend has been toward the development of image processing algorithms capable of digitizing the image of the interferogram by using CCD camera. Each point is referred to as a pixel or picture element. The camera digitizes each pixel to a value between 0 (black) and 255 (bright) depends on the brightness of the pixel being digitized. The digital interferogram contains several millions of pixels. How to correctly interpret and make a full use of the digital interferogram data by eye is a big difficult task.
Over the last thirty years or so, due to the greet ability of the image processing techniques, there are a lot of computer-aided processing algorithms, which depend on the image types, that can be used to process various digital interferometric fringe patterns to enable semiautomatic or fully automatic analysis of the fringe pattern [12-18].
Because of the location of the geometric fringe centers or fringe skeleton are very convenient for fringe analysis. One of the basic steps in fringe analysis is to extract fringe center lines or the fringe skeleton. A number of methods for extracting the skeleton have been published and developed and many aspects of these techniques have been deeply investigated [19-24].
In short, although a variety of methods for extracting the fringe skeleton exist, these methods can be classified into two main groups. In the first group, the fringe pattern is first threshold to provide a binary gray level image. Then horizontal or vertical scan lines are used to determine the midpoints of each dark and bright region [25].
In the second group, the intensity variation within a fringe is used in devising algorithms for fringe skeleton determination by using two methods. The first method is a thinning algorithm which erodes the fringes from all sides [26-29]. The disadvantage of this algorithm is that it usually requires numerous iteration in order to peel the fringe pattern. The second method consists of differential filter techniques [24,30], this algorithm is very simple because it requires one step to find the center line of the fringe.
It is evident from the above paragraphs that the algorithm for determining the fringe center lines (skeletons) is a valuable task in the automatic fringe analysis technique and is still open.
Multiple-beam Fizeau interferometer is a well known technique frequently used to investigate the optical and structural properties of fiber [31]. The power of multiplebeam Fizeau interferometer changed dramatically with the introduction of automated method of detection and analysis of its fringe patterns [32,33]. But, in general, it is well known that most algorithms for fringe analysis are tailored to a specific type of interferogram and thus may require substantial modifications when applied to other types of interferogram.
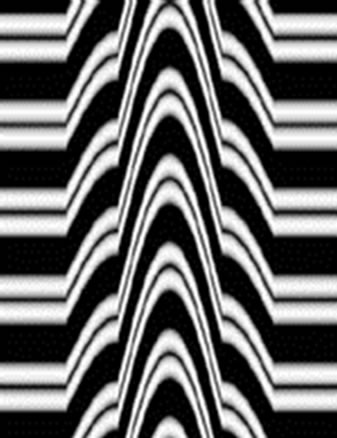
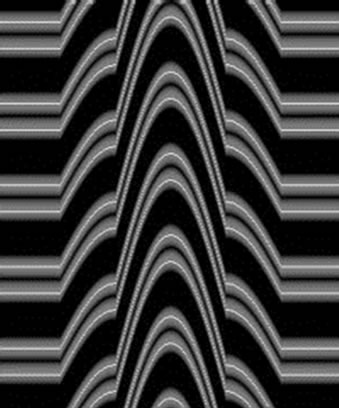
In General, the multiple-beam Fizeau fringes characteristic by sharp bright fringe on a dark background31, as shown in Figure 1(a). But in some cases the light source not gives only one wavelength but it gives a light having two wavelengths simultaneously. For example the sodium lamp gives two wavelengths 5890 Å and 5896 Å. So the interferogram, as shown in Figure 1(b), characteristics by double bright fringe on a dark background.
In this paper all type of multiple-beam Fizeau fringe are fully automated for determination of the contour line using different order of Fourier transform technique.
2. Description of the Algorithm
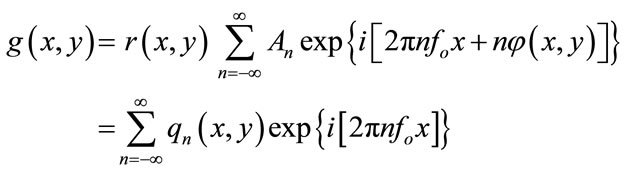
The principle problem in accurately measuring the refractive index using multiple-beam Fizeau fringe system, is how to determine the contour line of the fringe pattern for; 1) interference fringe shift [3] or 2) the area enclosed under the fringe shift [34,35], and interfringe spacing. The proposed algorithm based on determine the spectrum of the Fourier transform and the derivative-sign binary image of the multiple-beam Fizeau interferogram. This algorithm is summarized as follows. The intensity data contained in such a fringe pattern can be written as
 (1)
(1)
where
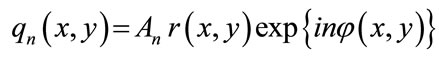
where r(x, y) is a fringe constant factor that depends on non-uniform illumination and reflection from the object surface, An is a Fourier coefficient, n is the order of the Fourier series, fo is the carrier frequency, and j(x, y) is the phase of the object. The algorithm consists of four simple steps:
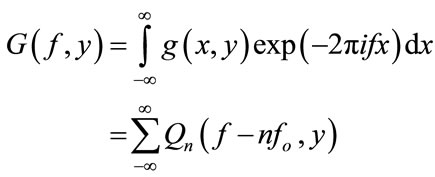
Step 1 Applying Fourier transform (FT) algorithm, we compute the one dimension (1-D) Fourier transform of Equation (1) for the variable x only, with y being fixed. The Fourier transform of Equation (1) is given by
 (2)
(2)
 (a)
(a)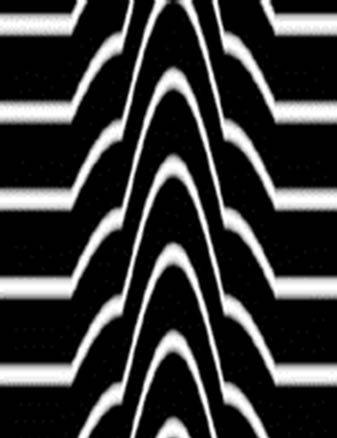 (b)
(b)
Figure 1. Simulated Microinterferogram of multiple-beam Fizeau technique in transmission in case of optical fiber as a object.
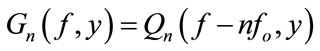
where G(f, y) and Qn(f, y) are the 1-D Fourier spectra of g(x, y) and qn(x, y), respectively. It is clear from Equation (2) that the Fourier spectrum consists of many peaks. These peaks is generally separated by carrier frequency fo. Figure 2 shown the Fourier spectrum of the interferograms shown in Figure 1, where 0, ±1, ±2, ±3 orders Fourier component are shown.
Step 2 we select the suitable order component (this order depend on the interferogram as we will explain after) and the unwanted orders are filtered out.
 (3)
(3)
and using the inverse Fourier transform, if we compute the inverse Fourier transform to Equation (3) with respect to f, the resulting function is a complex function. We select only the real part.
Step 3 we determine the derivative signs binary image [33,36] to the real part. In the binary image, if the deriva-
 (a)
(a)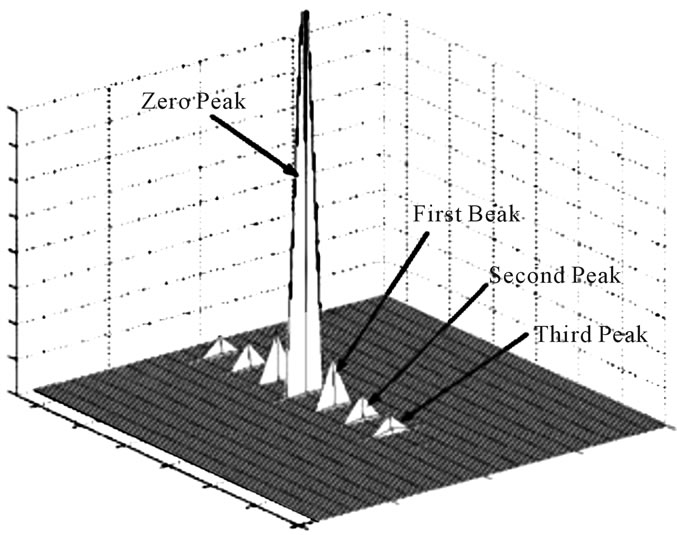 (b)
(b)tive signs of the real part are positive, the points are setsto be a bright value. On the other hand, if the derivative signs of the real part are negative, the points are sets to be a dark value.
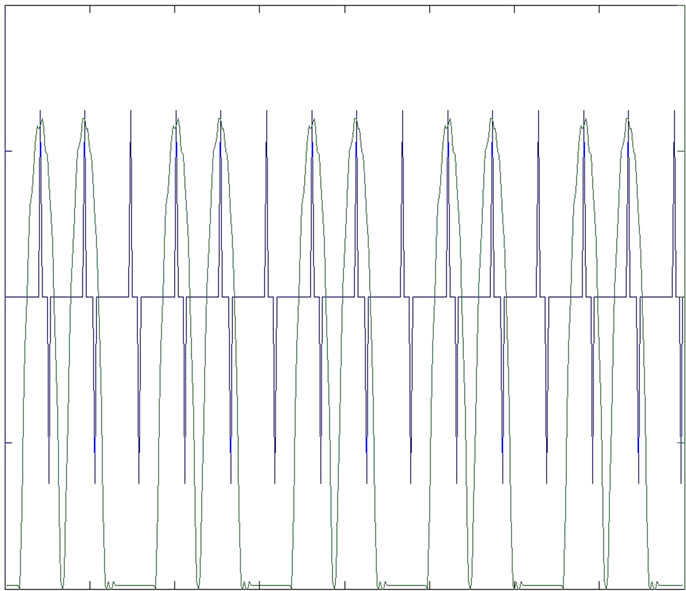
Step 4 After constructing the derivative sign binary image, it is easy to extract the fringe center lines using the following two steps: First, we select the positive peaks of the derivative sign and cancel the negative peaks by applying the threshold process over all the derivative sign binary image. Second examine each point neighborhood and quantify the slope then the result is the fringe center lines over the image field. Figure 3, show the intensity distribution for column 100 of Figure 1(b)
 (a)
(a)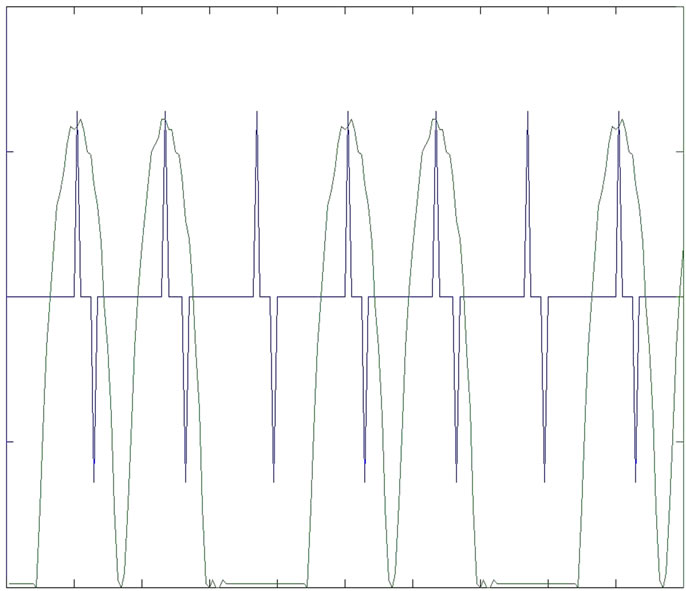 (b)
(b)
Figure 3. (a) Superimposed the one line intensity distribution (column 100) of (a) with the derivative data of its derivative-sign binary, (b) is magnified part of (a) for more clearly illustrate.
with its derivative sign. From Figure 3, one can easily see that the boundaries of the positive peaks on the derivative sign are exactly the center line of the original fringes without any deviation.
3. Results
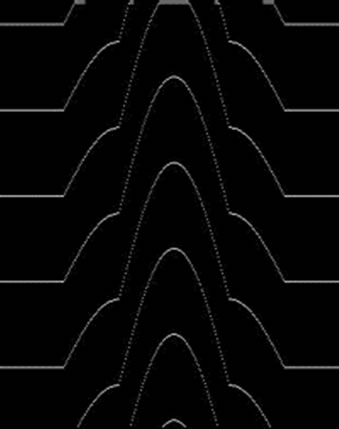
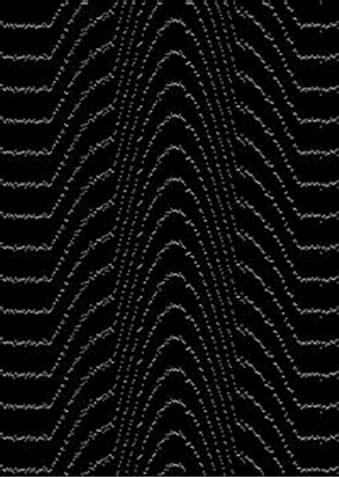
To verify this algorithm, first the algorithm was tested by using a computer simulated of multiple-beam Fizeau fringe in case of the refractive index of the immersion liquid is mismatching with the refractive index of the clad of the optical fiber, which shown in Figure 1(a). Figure 4(a) shows the contour lines plotted inside the original pattern of the interferogram, while Figure 4(b) shows the extracting fringe contour lines in a dark background. Figure 4 is obtained by applying the suggested algorithm and using the first order Fourier transform, in other words, in the step 2 of the algorithm, the first peak is selected and the other peaks are filtered out.
Figure 5 represents the result of applying the algo-
 (a)
(a)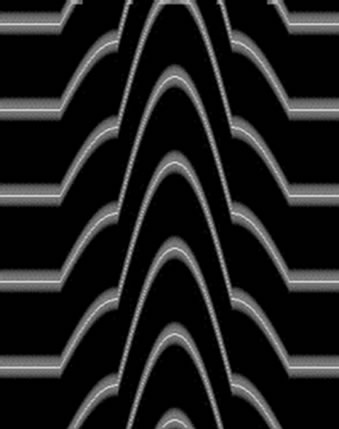 (b)
(b)
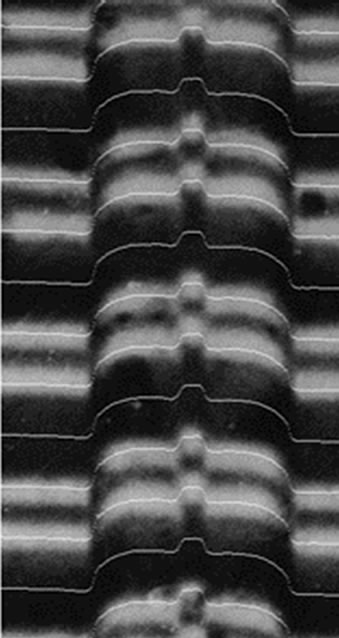
Figure 4. Extracted fringe skeleton of Figure 1(a), the first order Fourier transform, (a) Shown on the background of the original interferogram; (b) Shown on a dark background.
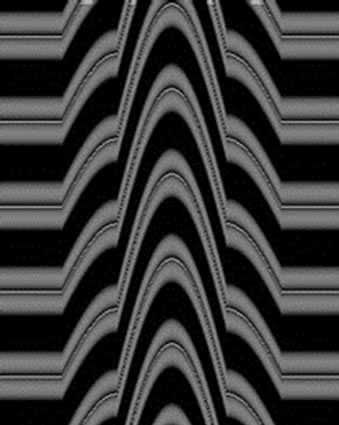
Figure 5. Extracted fringe skeleton of Figure 1(b), obtained by using the first order Fourier transform, shown on the background of the original interferogram.
rithm with the first order transform. From Figure 5, it is clear that the algorithm with the first order transform cannot obtain the contour line of the double bright fringe on a dark background.
Figure 6 is the same as in Figure 5 but Figure 6(a) obtained by using the third order Fourier transform, in other words, in the step 2 of the algorithm, the third peak is selected and the other peaks are filtered out. It is clear that the algorithm successes to determine the contour lines not only of the bright fringe but also the dark fringe. In fact the wanted results are get out from the bright fringes only in case of the multiple-beam Fizeau technique in transmission, So if we want the contour lines of the bright fringe only we should be select the first, second, and third peaks together as shown in Figure 6(b).
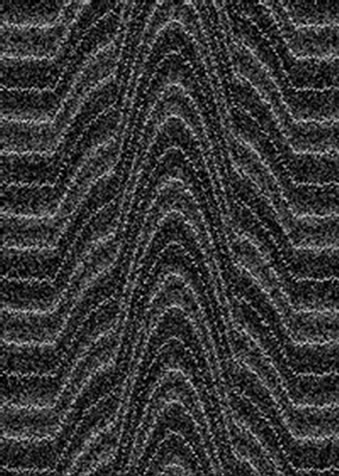
The previous test was done with free noise interferogram. In most case of practical application, various noises can be introduced into interferogram by various intrinsic or extrinsic adverse experimental conditions. So it is instructive to test the algorithm with noise interferogram. Without of using any filtering process, Figure 7 and Figure 8 show the result of testing in case of four different random noise ratio added to the original interferogram (Figure 1) by using MatLab7 program.
The results clearly illustrate the capability of the algorithm to construct the contour lines for the bright and dark fringes simultaneously and the effect of random noise is very small. Figure 9(a) shows the one line intensity distribution (column 100) of Figure 4(b) with Figure 8(d). It is clear that the difference between the intensity distribution is small and the two curves nearly coincide with each other and tend to be one curve. Figure 9(b) is magnified part of Figure 9(a) for more clearly illustrate, the difference is one pixel, this meaning from the point of view of accuracy that the algorithm has the advantage of having a high resistance to the noise.
The algorithm was tested by using an experimental
 (a)
(a)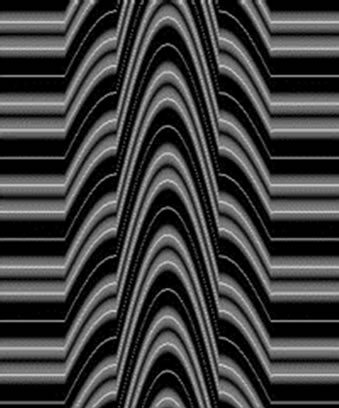 (b)
(b)
Figure 6. The same as in Figure 5 but (a) The third peak of the Fourier spectrum is selected; (b) The first, second and third peaks are selected together.
 (a)
(a)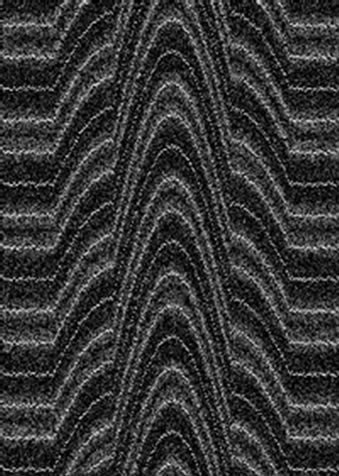 (b)
(b)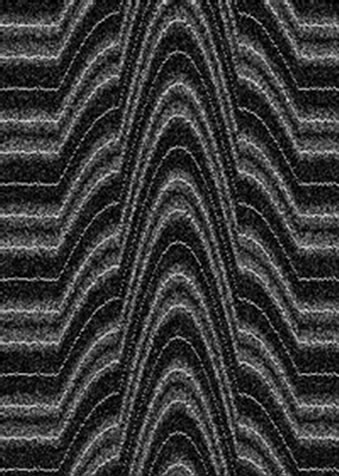 (c)
(c)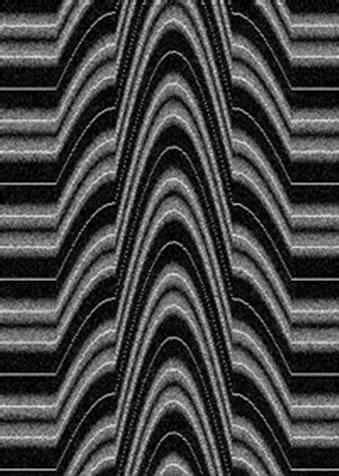 (d)
(d)
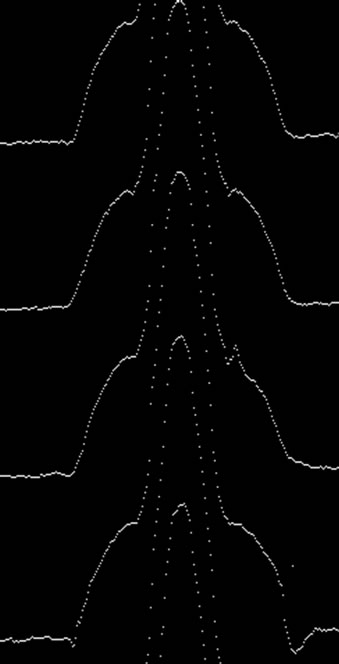
Figure 7. Extracted fringe skeleton after added four different random noise ratio, 0.008, 0.08, 0.2, 0.4 respectively, to Figure 1, shown on the background of the original interferogram.
 (a)
(a)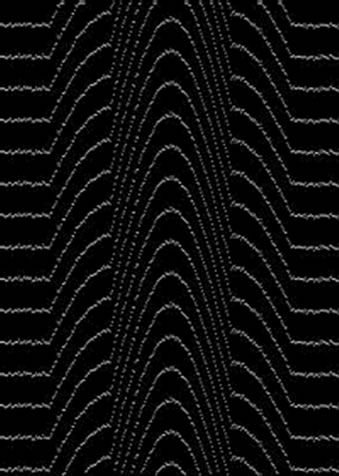 (b)
(b)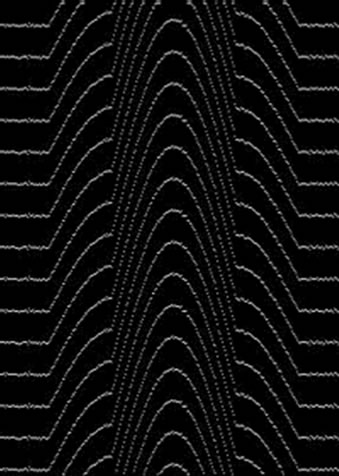 (c)
(c)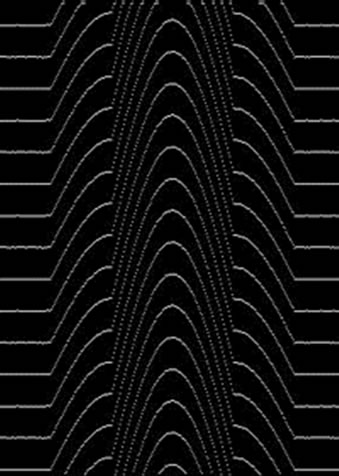 (d)
(d)
Figure 8. Extracted fringe skeleton of Figure 6 respectively, shown on a dark background.
 (a)
(a)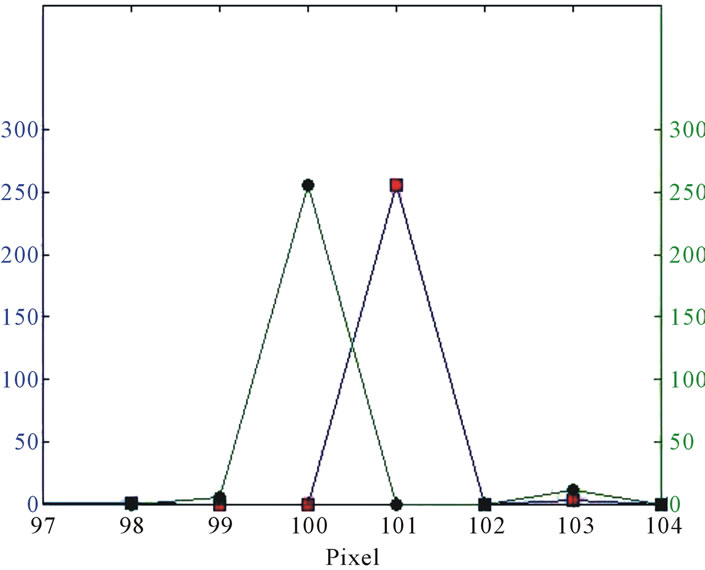 (b)
(b)
Figure 9. (a) Superimposed the one line intensity distribution (column 100) of Figure 4(b) with Figure 7(d), (b) is magnified part of (a) for more clearly illustrate.
interferogram of double bright fringe of multiple-beam Fizeau type. Figure 10(a) shows the extracted fringe skeleton of the Experimental multiple-beam Fizeau interferogram in case of using optical fiber as an object, shown on the background of the original interferogram. While Figure 10(b) shows the contour lines, shown on a dark background. Figure 11 shows the extracted fringe skeleton, shown on the background of the original interferogram, of experimental of double bright fringe of multiple-beam Fizeau interferogram; in case of using irregular textile fiber as a object, as shown in Figure 11(a) while Figure 11(b) in case of using single mode optical fiber as a object.
4. Conclusions
In conclusion, in order to avoid the tedium of manual skeleton extraction and remove the subjective element introduced by human operation, an algorithm for accurate and fully automatic extraction of the contour line of double bright fringe of multiple-beam Fizeau fringe has been presented. As far as I know, this is the first time to analyze the double bright fringe of multiple-beam Fizeau fringe automatically, using the third order of the Fourier transform technique of fringe analysis.
The proposed algorithm has been tested with a computer simulation fringe and with an experimental interferogram. From point of view of accuracy, the test results of the contour line show a good agreement with the
 (a)
(a) (b)
(b)
Figure 10. Experimental multiple-beam Fizeau interferogram in case of using optical fiber as a object; (a) Extracted fringe skeleton, shown on the background of the original interferogram; (b) Extracted fringe skeleton, shown on the dark background.
 (a)
(a)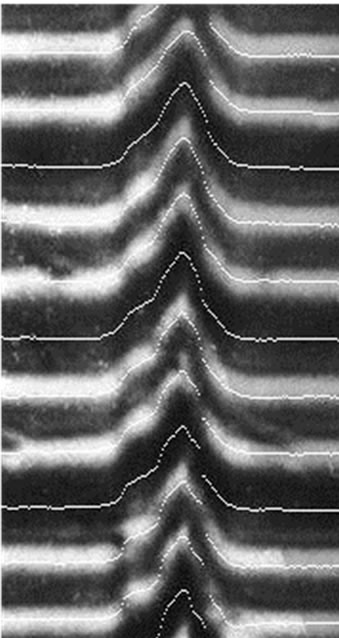 (b)
(b)
Figure 11. Extracted fringe skeleton, shown on the background of the original interferogram, of experimental of double bright fringe of multiple-beam Fizeau interferogram; (a) In case of using irregular textile fiber as a object; (b) In case of using single mode optical fiber as a object.
original interferogram.
The importance of the demonstrated algorithm lies in the following benefits:
1) Simple to automate, the interferogram can be analyzed without interruption or user intervention.
2) Fast, within few seconds, the full-field fringe pattern of the interferogram which contain at least million pixels can be analyze.
3) The algorithm performs better under certain circumstance such as noise and low contrast.
REFERENCES
- A. A. Hamza, I. M. Fouda, T. Z. N. Sokkar and M. A. EL-Bakary, “Determination of Spectral Dispersion Curves of Polypropylene Fibres,” Journal of Optics A: Pure and Applied Optics, Vol. 1, No. 3, 1999, pp. 359-366. doi:10.1088/1464-4258/1/3/005
- W. A. Ramadan, “On-Line Lens-Fibre Interference Method for Testing a Thick Fibre,” Journal of Optics A: Pure and Applied Optics, Vol. 2, No. 3, 2000, pp. 234- 238. doi:10.1088/1464-4258/2/3/311
- T. Z. N. Sokkar, M. A. Mabrouk and H. F. EL-Bawab, “Refractive Index Profile of GRIN Optical Fibre Considering the Area under the Interference Fringe Shift: II. The Mismatching Case,” Journal of Optics A: Pure and Applied Optics, Vol. 1, No. 1, 1999, pp. 64-72. doi:10.1088/1464-4258/1/1/009
- W. A. Ramadan, E. Fazio and M. Bertolotti, “Measurement of the Refractive-Index Profile of Planar Waveguides by the Use of a Double Lloyd’s Interferometer,” Applied Optics, Vol. 35, No. 31, 1996, pp. 6173-6178. doi:10.1364/AO.35.006173
- A. A. Hamza, “A Contribution to the Study of Optical Properties of Fibres with Irregular Transverse Section,” Textile Research Journal, Vol. 50, No. 12, 1980, pp. 731-734.
- A. A. Hamza, T. Z. N. Sokkar, K. A. El Farahaty and H. M. El Dessouky, “Influence of Temperature on the Optical and Structural Properties along the Diameter of: I. Polymer Fibres,” Journal of Physics: Condensed Matter, Vol. 11, No. 27, 1999, pp. 5331-5341. doi:10.1088/0953-8984/11/27/309
- A. A. Hamza, T. Z. N. Sokkar, K. A. El Farahaty and H. M. El Dessouky, “Comparative Study on Interferometric Techniques for Measurement of the Optical Properties of a Fibre,” Journal of Optics A: Pure and Applied Optics, Vol. 1, No. 1, 1999, pp. 41-50. doi:10.1088/1464-4258/1/1/006
- A. A. Hamza, I. M. Fouda, T. Z. N. Sokkar and M. A. El Bakary, “Optothermal Properties of Fibers. IX. Study Changes of Optical Parameters by Multiple-Beam Technique Due to Thermal Annealing for Natural Silk Fibers,” Journal of Applied Polymer Science, Vol. 69, No. 8, 1998, pp. 1495-1504. doi:10.1002/(SICI)1097-4628(19980822)69:8<1495::AID-APP3>3.0.CO;2-7
- J. M. Huntley, “Automated Fringe Pattern Analysis in Experimental Mechanics: A Review,” Journal of Strain Analysis, Vol. 33, No. 2, 1998, pp. 105-125. doi:10.1243/0309324981512850
- D. Zhang, D. D. Arola and M. Ma, “Digital Image Processing of Moiré Fringe Patterns with an Application to Fractures in Bovine Dentin,” Optical Engineering, Vol. 41, No. 5, 2002, pp. 1115-1121. doi:10.1117/1.1467938
- H. M. Presby, D. Marcuse and H. W. Astle, “Automatic Refractive-Index Profiling of Optical Fibers,” Applied Optics, Vol. 17, No. 14, 1979, pp. 2209-2214. doi:10.1364/AO.17.002209
- D. W. Robinson, “Automatic Fringe Analysis with a Computer Image-Processing System,” Applied Optics, Vol. 22, No. 14, 1983, pp. 2169-2176. doi:10.1364/AO.22.002169
- J. A. Aparicio, J. L. Molpeceres, A. M. de Frutos, C. de Castro, S. Caceres and F. A. Frechoso, “Improved Algorithm for the Analysis of Holographic Interferograms,” Optical Engineering, Vol. 32, No. 5, 1993, pp. 963-969.
- W. Chen, X. Tan and H. Zhao, “Automatic Analysis Technique of Spatial Carrier-Fringe Patterns,” Optics and Lasers in Engineering, Vol. 25, No. 2-3, 1996, pp. 111- 120. doi:10.1016/0143-8166(95)00059-3
- S. Krishnaswamy, “Algorithm for Computer Tracing of Interference Fringes,” Applied Optics, Vol. 30, No. 13, 1991, pp. 1624-1628. doi:10.1364/AO.30.001624
- A. C. Gillies, “Image Processing Approach to Fringe Patterns,” Optical Engineering, Vol. 27, No. 10, 1988, pp. 861-866.
- K. Mori, Y. Nakano and K. Murata, “Fringe Pattern Analysis Using Hybrid Image Processing,” Applied Optics, Vol. 29, No. 11, 1990, pp. 1646-1651. doi:10.1364/AO.29.001646
- A. G. Knadakhar, V. Jyothi and R. Naraganan, “Fringe Tracing by Image Processing,” Optical Engineering, Vol. 33, No. 6, 1994, pp. 1872-1875. doi:10.1117/12.167158
- A. Colin and W. Osten, “Automatic Support for Consistent Labelling of Skeletonized Fringe Patterns,” Journal of Modern Optics, Vol. 42, No. 5, 1995, pp. 945-954. doi:10.1080/09500349514550861
- Q. M. Cheng, P. P. Lin and W. C. Tai, “A Fringe Center Detection Technique Based on a Sub-Pixel Resolution, and Its Applications Using Sinusoidal Gratings,” Optics and Lasers in Engineering, Vol. 20, 1994, pp. 163-176.
- Z. Huang, “Fringe Skeleton Extraction Using Adaptive Refining,” Optics and Lasers in Engineering, Vol. 18, No. 4, 1993, pp. 281-295. doi:10.1016/0143-8166(93)90056-Q
- H. Chang and H. Yan, “Skeletonization of Binary Digital Patterns Using a Fast Euclidean Distance Transformation,” Optical Engineering, Vol. 35, No. 4, 1996, pp. 1003-1008. doi:10.1117/1.600716
- A. Anand, “Tracing of Interference Fringes Using Average Gray Value and Simultaneous Row and Column Scan,” Optics & Laser Technology, Vol. 35, No. 2, 2003, pp. 73-79. doi:10.1016/S0030-3992(02)00143-3
- Q. Yu and K. Andresen, “Fringe-Orientation Maps and Fringe Skeleton Extraction by the Two-Dimensional Derivative-Sign Binary-Fringe Method,” Applied Optics, Vol. 33, No. 29, 1994, pp. 6873-6878. doi:10.1364/AO.33.006873
- A. A. Hamza, T. Z. N. Sokkar, M. A. Mabrouk and M. A. EL-Morsy, “Refractive Index Profile of Polyethylene Fiber Using Interactive Multiple-Beam Fizeau Fringe Analysis,” Journal of Applied Polymer Science, Vol. 77, 2000, pp. 3099-3106.
- O. Kafri and B. Ashkenazi, “Line Thinning Algorithm for Nearly Straight Moiré Fringes,” Optical Engineering, Vol. 25, No. 3, 1986, pp. 495-498.
- D. Mishra, K. Muralidhar and P. Munshi, “Performance Evaluation of Fringe Thinning Algorithms for Interferometric Tomography,” Optics and Lasers in Engineering, Vol. 30, 1998, pp. 229-249. doi:10.1016/S0143-8166(98)00031-1
- K. P. Qing and R. W. Means, Proceedings of SPIE, Vol. 2181, 1994, pp. 206-273.
- D. P. Yan, A. Z. He and P. C. Miao, “Method of Rapid Fringe Thinning for Flow-Field Interferograms,” Proceedings of SPIE, Vol. 1755, 1992, pp. 190-193. doi:10.1117/12.140768
- Q. Yu, X. L. Lui and X. Sun, “Generalized Spin Filtering and an Improved Derivative-Sign Binary Image Method for the Extraction of Fringe Skeletons,” Applied Optics, Vol. 37, No. 20, 1998, pp. 4504-4509. doi:10.1364/AO.37.004504
- N. Barakat and A. A. Hamza, “Interferometry of Fibrous Material,” Adam Hilger, Bristol and New York, 1990, pp. 55-97.
- M. A. EL-Morsy, T. Yatagai, A. A. Hamza, M. A. Mabrouk and T. Z. N. Sokkar, “Multiple-Beam Fizeau FringePattern Analysis Using Fourier Transform Method for Accurate Measurement of Fiber Refractive Index Profile of Polymer Fiber,” Journal of Applied Polymer Science, Vol. 85, 2002, pp. 475-484.
- M. A. EL-Morsy, T. Yatagai, A. A. Hamza, M. A. Mabrouk and T. Z. N. Sokkar, “Automatic Refractive Index Profiling of Fibers by Phase Analysis Method Using Fourier Transform,” Optics and Laser in Engineering, Vol. 38, 2002, pp. 509-525.
- M. A. Mabrouk and H. F. El Bawab, “Refractive Index Profile of GRIN Optical Fibre Considering the Area under the Interference Fringe Shift: I. The Matching Case,” Pure and Applied Optics: Journal of the European Optical Society Part A, Vol. 6, No. 2, 1997, pp. 247-256. doi:10.1088/0963-9659/6/2/008
- M. A. Mabrouk and M. A. Shams Eldin, “Interferometric Measurement of Some Structural Parameters of Drawn Polyethylene Fibres,” Pure and Applied Optics: Journal of the European Optical Society Part A, Vol. 5, No. 6, 1996, pp. 929-940. doi:10.1088/0963-9659/5/6/018
- T. Z. N. Sokkar, H. M. El Dessouky, M. A. Shams-Eldin and M. A. El-Morsy, “Automatic Fringe Analysis of Two-Beam Interference Patterns for Measurement of Refractive Index and Birefringence Profiles of Fibres,” Optics and Lasers in Engineering, Vol. 45, No. 3, 2007, pp. 431-441. doi:10.1016/j.optlaseng.2006.09.003