International Journal of Geosciences
Vol. 3 No. 3 (2012) , Article ID: 21218 , 10 pages DOI:10.4236/ijg.2012.33064
Geoelectric Investigation for Groundwater Exploration in Yaoundé Area, Cameroon
1Department of Physics, Faculty of Science, University of Yaounde I, Yaounde, Cameroon
2Department of Physics, Advanced Teachers’ Training College, University of Yaounde I, Yaounde, Cameroon
Email: *theopndougsa@gmail.com
Received March 2, 2012; revised April 12, 2012; accepted May 18, 2012
Keywords: Aquifer; Geoelectrical Section; Vertical Electrical Sounding (VES); Yaoundé
ABSTRACT
Yaounde zone is originally characterized by the small number of aquifers and bad renewal capacity. Within the framework of the emergency program which aims at supplying the city with drinking water, seventeen Vertical Electrical Soundings (VES) were carried out using Schlumberger configuration in parts of Yaounde (latitude 3˚ - 5˚N and longitude 11˚ - 13˚E) to determine the nature and thickness of aquifer zone and necessary geoelectrical parameters. Four to five geoelectric layers were delineated from the survey area. The first layer is the topsoil and has resistivity values ranging from 13 - 216 Ω·m and thickness is between 0.1 - 6 m. The second layer made up of clay sand and laterite has resistivity values ranging between 23 and 923 Ω·m and thickness ranged from 1 and 40 m. The third and fourth geoelectric layers consisting of clay and gneiss/migmatite with thickness varying from 1.7 - 63.3 m correspond to an aquifer horizon. Resistivity values of the aquifer ranges from 4 to 9215 Ω·m. The study indicates that average depth of the aquifer is 20 m and average thickness of the aquifer is 55 m. Soundings curves suggest several four layered geoelectrical sections KH, KQ, HK type and some five layered sections of the HKH, KHK types. KH type is dominant and can be used as reference for future studies. The resistivity survey reveals that the parameters obtained through interpretation of VES curves corroborate the litho logs of boreholes from the area.
1. Introduction
Yaoundé, the main town in the area is the capital of Cameroon. It is a metropolitan city that is densely populated and whose population is on the rise. The progressive population growth has led to severe shortage of potable water for the area which poses a great challenge to both the citizens and the government. To meet the needs of the population, a project called “emergency program to supply the city of Yaoundé with drinking water” has been run by the Minister of Energy and Water resource. The electrical resistivity method involving vertical electrical sounding (VES) technique was adopted for this survey. It involves the measurement of apparent resistivity of subsurface as a function of depth or position by changing the electrode spacing interval while maintaining a fixed location for the center of the electrode spread [1]. The theory of resistivity and its application to ground water studies have been much discussed [2,3]. The objective of the investigation is aimed at producing data which could serve as a basis for more detailed groundwater exploitation activities in the area.
2. Hydrogeology and Geological Setting
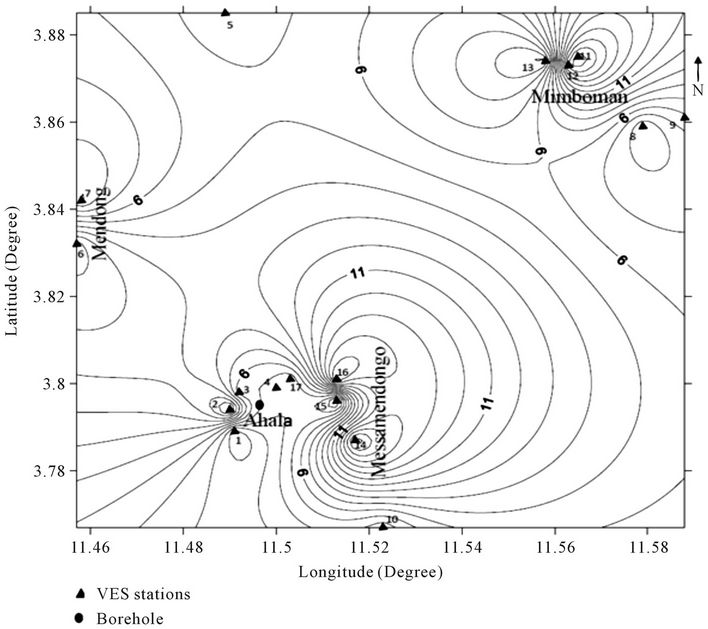
Yaoundé is located between latitudes 3˚ to 5˚N and longitudes 11˚ to 13˚E on the western edge of the SouthCameroon plateau (Figure 1) [4]. The Relief is rough and dominated by hills alternating with valleys thus, shaping the area into domes and basins structure. The equatorial climate type is influenced by the middle-high altitude. Hydrographic system is constituted by permanent rivers, creeks, and lakes. The Mfoundi River dominates this system and crosses the city from the North to the South. Hydrogeology it is characterized by continuous alterites aquifers, approximately exploitable overlying water bearing fissures or fracture aquifers in the bedrock. These types of aquifers are superimposed or isolated. In a crystalline medium, capacitive and conductive functions both exist within each aquifer. Generally, the weathered medium is capacitive while the basement is conductive [5]. Potentialities of these aquifers depend into hydrological balance parameters and their configuretion. The weathered rock aquifer is the first encountered

Figure 1. Geological map of Yaounde area (modified [12]).
beneath the subsoil. It is a free nappe aquifer overlaid by an unsaturated zone. In Yaounde, this nappe sited between 10 and 15 m depth is of a regional extend, and the ground water flow is governed by interstice porosity [6]. In water bearing fissures and fractures, tectonics is the major factor governing the water flow. In Yaoundé, the bedrock is gneiss; this rock is neither porous nor soluble, but it is discontinuities (faults, diaclases) that give fissure permeability to the formation; this last being anisotropic and heterogeneous.
Yaoundé city belongs to the Pan-African Chain of Central Africa [7]. The soil is made up of thin layer of topsoil, a clay sand horizon furniture, clay with occasional blocks of weathered rock underlying [8] and finally bedrock which forms the base. Its basement is made up (Figure 1) of migmatites and gneisses [9]. These formations outcrop at the northern edge of the Congo Craton and they are subdivided into two groups:
• The first is metaplutonic with garnet and pyroxenes high graded dark rocks; the major metamorphic facies being pyriclasites, pyribolites and pyroxenites.
• The second is a metasedimentary group made up of middle light rocks containing garnet, alumina, kyanite and muscovite. Garnetiferous gneisses with disthene or plagioclase belong to this group. Metasedimetary rocks are common in the Yaounde area. They crop out in some river bed.
3. Data Acquisition and Method
3.1. Data Acquisition
The Terrameter model SAS 300B was used to acquire seventeen (17) VES soundings using the Schlumberger configuration, and maximum electrode separation (AB/2) is restricted to 83 m. The Schlumberger configuration consists of a linear electrodes array (AMNB) as shown in Figure 2. Potential electrodes M and N are kept fixed at the centre of the array while current electrodes A and B are moved outward symmetrically [2].
The operational principle lay on the fact that ground injection of current through current electrodes A and B enables the measurement of the potential drop between potential probes M and N. The current penetrates deeply into the ground as the electrode A and B spacing increases.
3.2. Method
In a heterogeneous ground in which there exists a vertical variation in resistivity with depth, the apparent resistivity

Figure 2. Electrodes configuration.
rather than the true resistivity is measured. The current flow in such a medium is influenced by its density, porosity and salinity of the fluid contents.
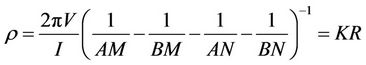
The apparent resistivity ρ can be expressed as:
 (1)
(1)
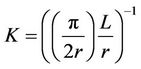
where R corresponds to the resistivity of the space volume between potential electrodes, and K is the geometric factor which depends on the electrode configuration.
The Schlumberger configurations are given by r = AN – AM = BM – BN and L = AM + BM = AN + BN
 (2)
(2)
It is important to examine the electric current ground flow under the influence of external potential, because it enables to understand a major characteristic of direct current methods that is depth of investigation.
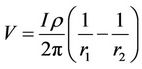
We have, by the Ohm’s law [2],
 (3)
(3)
where J and V are the current density and potential respectively For two grounded electrodes (Figure 2), we have
 (4)
(4)
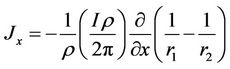
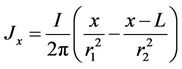
Thus, the horizontal component Jx for the two electrodes system is
 (5)
(5)
Furthermore r2 = x2 + y2 + z2,
 (6)
(6)
Assuming to be in the median plane, then r1 = r2 = r and x = L/2, what allows us to write
 (7)
(7)
This equation highlights the fact that current density at vertical x position depends on the depth Z and the spacing electrodes injection.
This phenomenon can be seen considering the current I (and not J). Integrating elementary current  yields to the expression of the current function flowing by one part of the plane given by [2]:
 (8)
(8)
So,
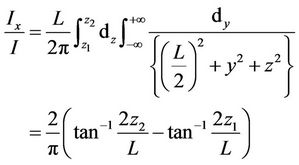 (9)
(9)
when  and
and 
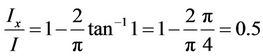 (10)
(10)
This relationship shows that almost half of the injected current propagating in the direction  investigates a depth lower than half of electrodes separation.
The true resistivity and thickness of the subsurface layers were interpreted by partial curve matching with the two layer model master curves and the corresponding auxiliary curves. The thickness and resistivity values obtained from the partial curve matching were then used for a quantitative computer iteration using Jointem Software [10]. The results obtained from the computer modelling are presented in Table 1.
4. Results and Discussion
Our results have been obtained through a quantitative interpretation. The main objective of the quantitative interpretation of VES curve is to obtain the geoelectrical parameters and geoelectric section. Geoelectrical parameters are true resistivity and layer thickness. Interpretation of sounding curves shows the following curves types: KH, KQ, HK, HKH, and KHK (Figure 3). The apparent resistivity curves reveal a dominant curves type KH over the entire area. The dominant of this curve type shows that a homogenous subsurface succession and in most sounding curves the same layer were found.
4.1. Geoelectric Section
In the case study, the geoelectrical section of Yaounde (Figure 4) shows four distinct layers namely the top soil, clayey sand/laterite, clay and gneiss/migmatite.
The near-surface layer that had highly variable resistivity ranging from 13 to 216 Ω·m, while its thickness ranges between 0.1 - 6 m. It reflects the variable composition and moisture content of the topsoil. The second layer is composed of clay sand and laterite. The resistiveity of clay sand overburden range from 4 to 700 Ω·m and thickness of 0.2 - 34.1 m while the laterite material has
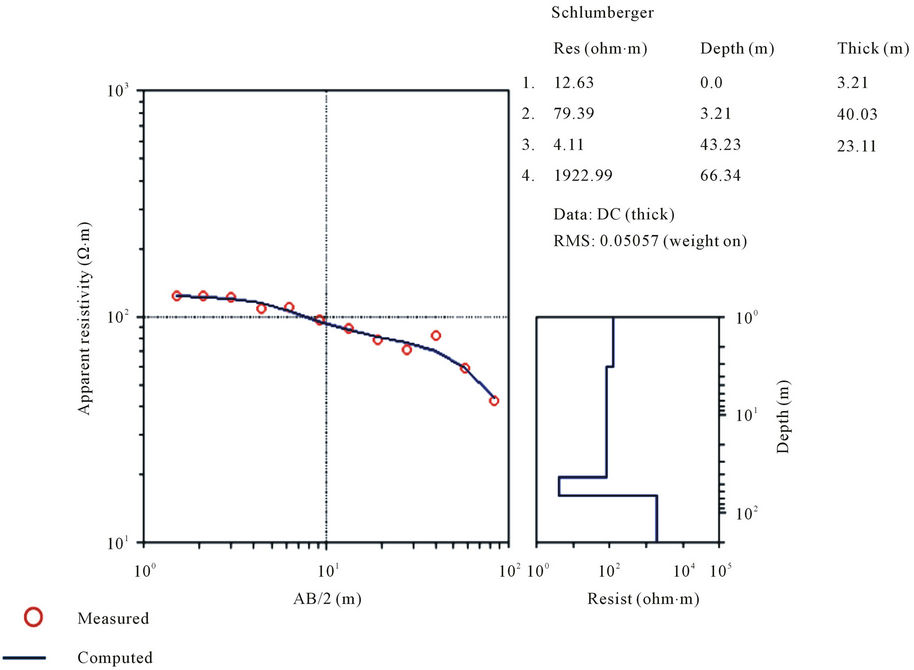

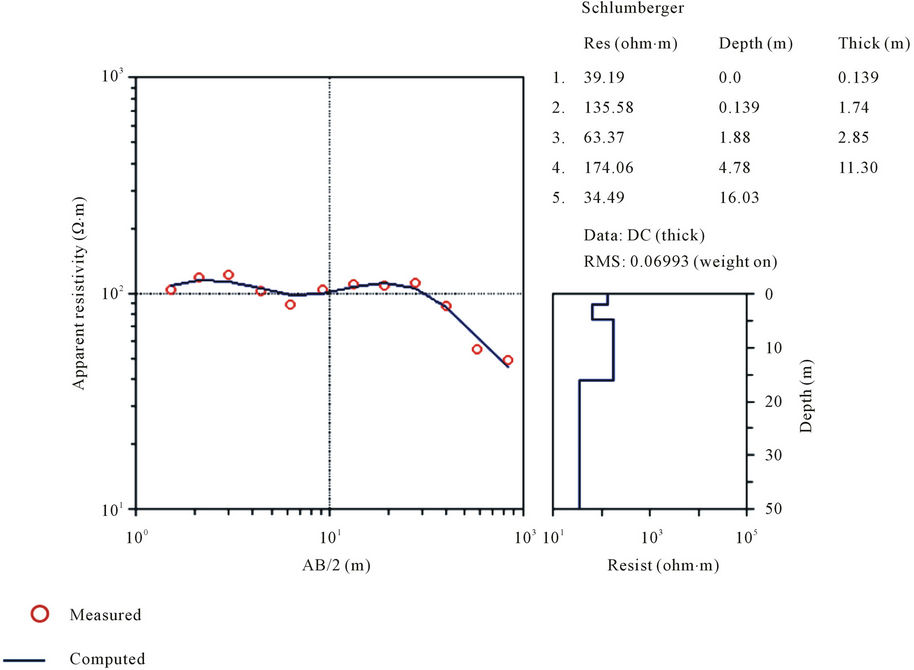
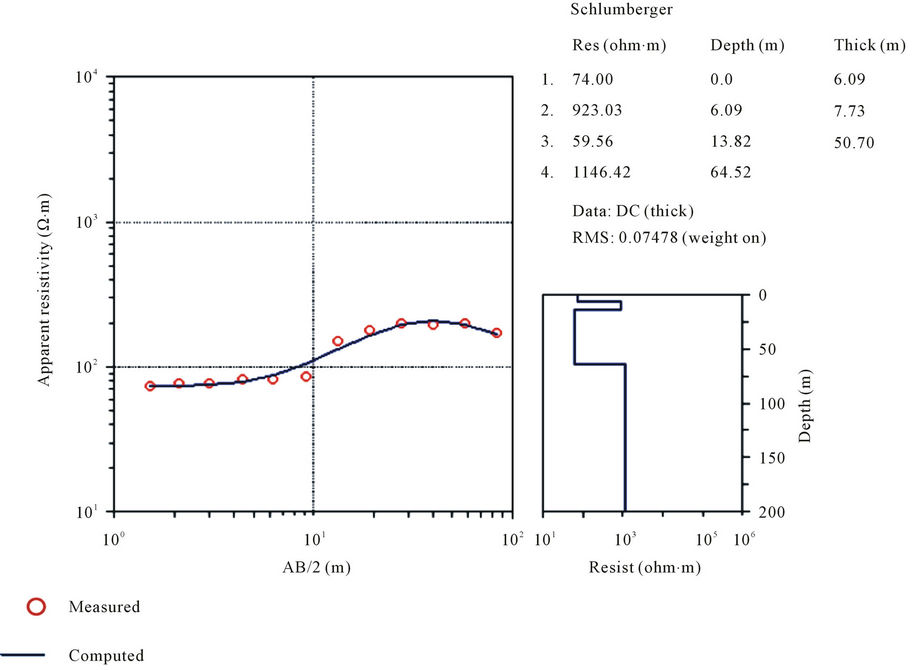
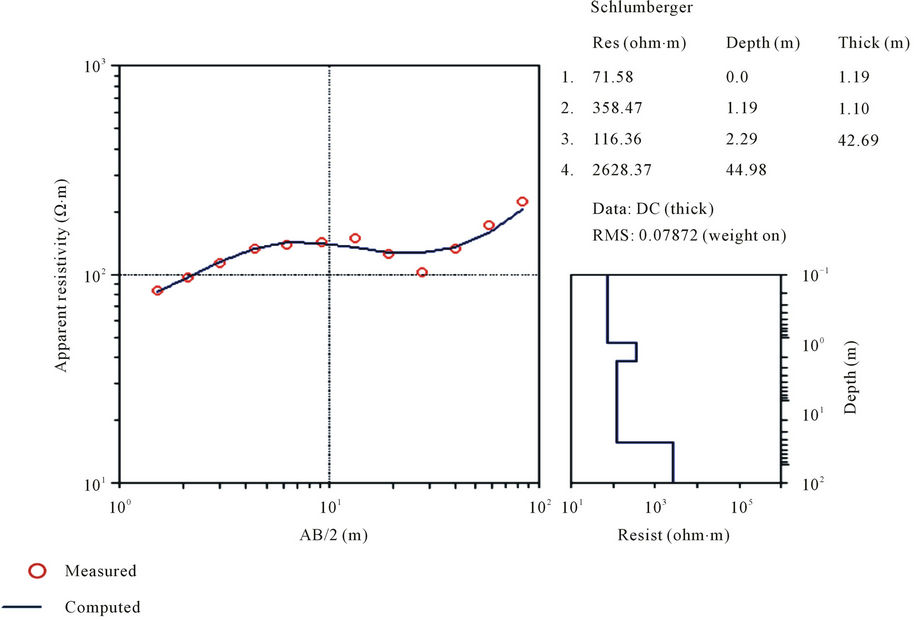
Figure 3. Some resistivity curves obtained from the study area.

Table 1. Resistivity sounding results.
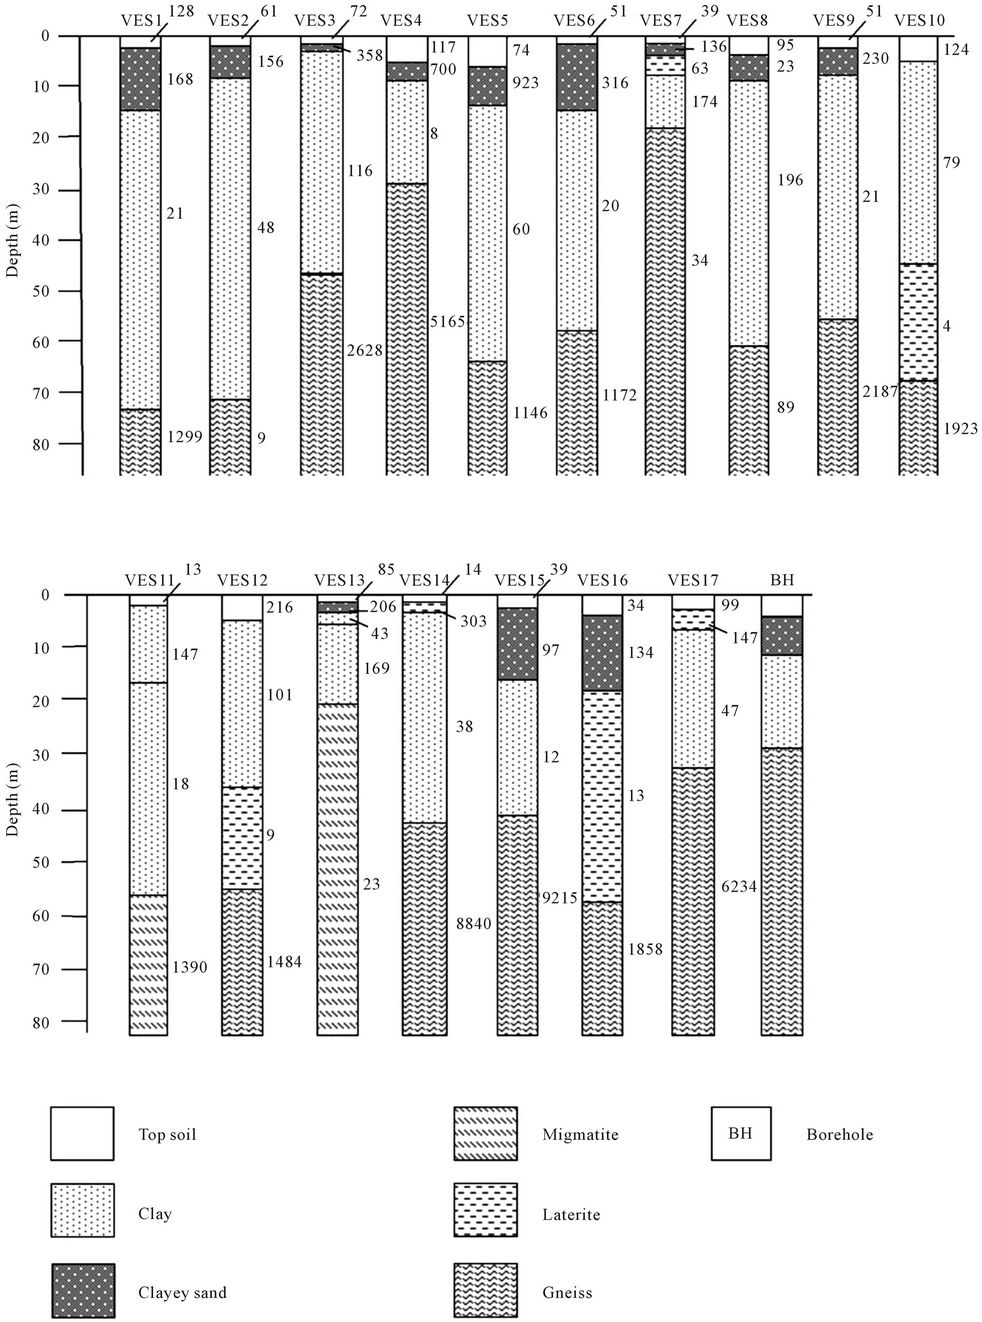
Figure 4. Geoelectric section of area.
 (a)
(a)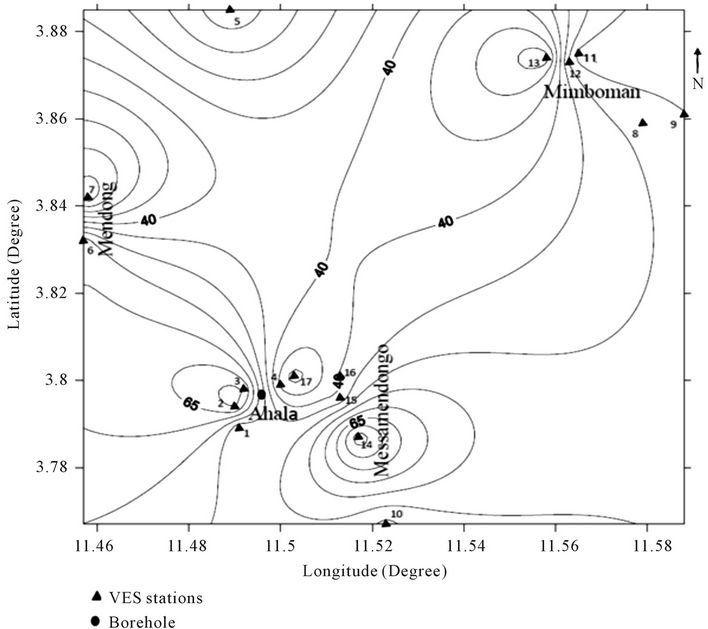 (b)
(b)
Figure 5. (a) Depth to the top of aquifer in the area; (b) Isopach map of aquifer in the area.
resistivity varying from 79 - 923 Ω·m and thickness ranging from 1.2 - 40 m. The third and fourth geoelectrical layers represent an aquifer unit. The resistivity of the third layer which is wheatered ranges from 8 to 196 Ω·m diagnostic of clay with thickness ranging from 13.4 to 63.3 m except beneath VES 7, 10, 12 and 16 where the inferred lithology is laterite with resistivity varies from 4 to 63 Ω·m while thickness varies from 18 to 40 m. The fourth and five layers are composed of gneiss/migmatites with resistivity values ranging from 9 - 8840 Ω·m. The exact thickness of the four layer cannot be determined as the electrode current terminated within this layer except the VES 7 and 13 with thickness varying between 11.3 - 56.7 m. This layer was interpreted to be bedrock with low resistivity ranges. In most parts of the area, the resistivity was more than 1000 Ω·m corresponding probably to a slate. Where the resistivity value was less than 700 Ω·m corresponded to a shale layer. Rock resistivity depended on several factors such as the pore fluids contents, weathering, and fracturation.
4.2. Aquifer Maps
The results of the study show that an aquifer is encountered at an average depth of about 15 m in Yaounde as shown in (Figure 5(a)). The isopach map produced from the VES results shows a variation in aquifer thickness from 20 to 80 m. The mean value of the aquifer’s thickness is about 25 m although a maximum thickness of 70 m is observed. The thickness of the overburden is an important hydrogeologic consideration in groundwater development in the basement terrain, because water gets into the saturated zone through the overburden [11]. The maximum aquifer thickness is encountered beneath VES 2, 3 and 14 (Figure 5(b)). The weathered layer for the study area is thick enough to enable ground water accumulation.
VES 1, 2, 3, 11 and 14 show that, the area suitable for groundwater exploitation, because they exhibit weathered and fractured formations with high thickness.
In VES 4, 5, 6, 7, 8, 9, 10, 12, 13, 15, 16 and 17 are marked by a low groundwater yield due to the dip and the thickness of the weathered zone.
This area may be good prospects for drinking boreholes with high expectations. Interpretation of VES curves corroborates the lithologs of boreholes drilled in the area.
5. Conclusion
The application of VES technique has provided detailed information on the thickness and hydrogeoelectrical characteristics of the aquifer in the study area. The presence of thick and highly prolific aquifer constitutes an adequate water resource for the region. Range of resistivity values for different formations has been established using the interpreted VES results and borehole lithologic which can help to understand the subsurface lithological variation prevailing in the area. The groundwater occurs basically under unconfined condition at depths of about 15 m to about 50 m. The shallow aquifer may be vulnerable to contamination because of its thin overburden. The presence of Clay lenses at different depths may form confining layers. The thickness of the gneissic layer could not be completely evaluated as the investigation ended within this layer. This study has provided an insight into the subsurface shallow aquifer systems and delineated areas for groundwater development program in the area.
6. Acknowledgements
The authors thank the Minister of Energy and Water resource, who has permitted them to use data set from the Yaounde city emergency program for supply of drinking water. They also thank Mr NKEMKA John for his corrections and suggestions.
REFERENCES
- E. Atakpo, “Hydrogeological Deductions from Geoelectric Survey in Uvwiamuge and Ekakpamre Communities, Delta State, Nigeria,” International Journal of Physical Sciences, Vol. 4, No. 9, 2009, pp. 477-485.
- W. M. Telford, L. P. Geldart and R. E. Sheriff, “Applied Geophysics,” Cambridge University Press, Cambridge, 1990, 870 p. doi:10.1017/CBO9781139167932
- P. V. Sharma, “Environmental and Engineering Geophysics,” Cambridge University Press, Cambridge, 1997, 475 p. doi:10.1017/CBO9781139171168
- H. Stendal, S. F. Toteu, R. Frei, J. Penaye, U. O. Njel, J. Bassahak, J. Nni, B. Kankeu, V. Ngako and J. V. Hell, “Derivation of Detrital Rutile in the Yaounde Region from the Neoproterozoic Pan-African Belt in Southern Cameroon (Central Africa),” Journal of African Earth Sciences, Vol. 4, No. 4, 2006, pp. 443-458. doi:10.1016/j.jafrearsci.2005.11.012
- H. B. Djeuda-Tchapnga, E. Tanawa, E. Temgoua, J. Siakeu and B. Ngo Massana, “Mode de Circulation, Mécanismes de Recharge et Temps Relatifs de Séjour des eaux des Nappes Souterraines des Altérites du Milieu Cristallin: Cas du Bassin Versant de l’Anga’a, Yaoundé,” Presses Universitaires de Yaoundé, Yaoundé, 1999, pp. 117-126.
- H. B. Djeuda-Tchapnga, E. Tanawa, J. Siakeu and E. Ngnikam, “Décentralisation du Service de l’Approvisionnement en eau Potable: Les Réalités et les Spé- cificités du Cameroun,” Proceedings du Séminaire sur la Décentralisation et la Gestion des Ressources Naturelles en Afrique Centrale, Douala, 10-13 Mai 1998, 12 p.
- H. Mvondo, S. W. J. Den Brok and J. Mvondo-Ondoa, “Evidence for Symmetric Extension and Exhumation of Yaounde Nappe (Pan-African Fold Belt, Cameroon),” Journal of African Earth Sciences, Vol. 3, No. 6, 2003, pp. 215-231. doi:10.1016/S0899-5362(03)00017-4
- G. E. Ekodeck and B. V. Kamgang-Kabayene, “L’Altérologie Normative et ses Applications, Une Expression Particulière de la Pétrologie des Roches Aluminosilicatées du Point de vue de Leur Evolution Supergène,” Presses Universitaires de Yaoundé, Tome II, 2002, 231 p.
- T. Ngnotué, J. P. Nzenti, P. Barbey and F. M. Tchoua, “The Ntui-Betamba High-Grade Gneisses: A Nordward Extension of the Pan-African Yaounde Gneisses in Cameroon,” Journal of African Earth Sciences, Vol. 3, No. 1, 2000, pp. 369-381.
- M. Pirttijärvi, “Joint Interpretation of Electromagnetic and Geoelectrical Soundings Using 1-D Layered Earth Model, User’s Guide to Version 1.3,” Oulu, 2009, 48 p.
- A. Takounjou-Fouépé, V. V. S. R. Gurunadha, J. N. Ndam, L. N. Sigha and G. E. Ekodeck, “Groundwater Flow Modelling in the Upper Anga’a River Watershed, Yaounde, Cameroon,” African Journal of Environmental Science and Technology, Vol. 3, No. 10, 2009, pp. 341- 352.
- P. Maurizot, “Carte Géologique du Sud-Ouest Cameroun au 1/500000,” BRGM, Orléans, 1986.
NOTES
*Corresponding author.