Food and Nutrition Sciences
Vol. 3 No. 8 (2012) , Article ID: 21580 , 5 pages DOI:10.4236/fns.2012.38153
Glycemic Response of Type 2 Diabetics to Raisins
![]()
Department of Biology, Winona State University, Winona, USA.
Email: *ewilson@winona.edu
Received May 25th, 2012; revised June 25th, 2012; accepted July 4th, 2012
Keywords: Diabetes; Glycemic Response; Raisin; Grape; Bread; Banana; Fruit
ABSTRACT
Background: Raisins are a nutritious fruit snack containing fiber, antioxidants, and potassium. Diabetics tend to have low fruit intakes, possibly due to concerns about glycemic response. Aim: This study sought to characterize the utility of raisins as a way to improve fruit consumption by type 2 diabetics. Methods: Fasting type 2 diabetics randomly received 100 Calorie servings of bananas (BA; 103.1 g), white bread (WB; 40.2 g), raisins (RA; 30.3 g), or Thompson seedless grapes (TG; 112.4 g) on each of four separate lab visits in single cross-over fashion. Blood glucose (n = 15) and plasma insulin (n = 7) were measured before and 30, 60, 120 minutes after snack consumption. Results: Relative to baseline, blood glucose peaked significantly at 30 minutes for TG, RA and WB at 204.6 ± 16.2, 180.5 ± 12.7, and 176.2 ± 12.2 mg/dL, respectively, the 30 minute value for BA (173.2 ± 11.6 mg/dL) approached significance (p = 0.12). At 30 minutes, the blood glucose values for BA and TG differed significantly, at all other times no significant differences were observed, and all values returned to near baseline 120 minutes after consumption. Postprandial plasma insulin increased for all treatments, though not significantly. Conclusion: The extended shelf life and portability of raisins may make them an attractive choice for improving fruit consumption in type 2 diabetics.
1. Introduction
Thompson seedless grapes (TG) are the most widely consumed table grapes in the USA and have a rich phenolic profile [1,2]. Apples, oranges and bananas, grapes are the top four most popular fresh fruits, and grape consumption is estimatedto be over 8 lbs per capita per year (http://usda.gov). Sun dried raisins are produced primarily (95%) from these same TG. The process involves natural sun-drying for a period of 2 to 3 weeks during which the original grape phenolic profile changes and brown-black melanin pigments develop by enzymatic and non-enzymatic reactions to give them their characteristic brown color. The current USDA Dietary Guidelines suggests that 1/4 cup of raisins represents the dietary equivalent to a serving of fresh fruit [3]. However, the recent World Health Survey demonstrated that upwards of 78% of the population in the 52 countries studied were found to have not reached the desired five fruit and vegetable servings/day [4]. Similarly, 75% of Americans fail to achieve 5 servings/day [3].
Diabetes is diagnosed when fasting blood glucose levels are greater than 126 mg/dL on two separate occasions, when the individual has a hemoglobin A1C ≥ 6.5%, or has a fasting blood glucose ≥ 126 mg/dl [5]. In 2009, approximately 11 percent of the US population 20 years of age and older had diabetes most of which was type 2, and 35 percent of the same the US adult population has prediabetes [6]. Concerns about food postprandial blood glucose are of paramount clinical concern for this population.
Cardiovascular disease (CVD) is the number one cause of death in the United States and CVD risk is two to four times greater in diabetics than in healthy individuals with the same age and CVD risk status [7]. However diabetics tend to have low fruit intake relative to normal populations, perhaps contributing to the increase in CVD mortality in type 2 diabetics. Fruit avoidance by diabetics may be attributed to the high simple sugar content of fruit compared to other food groups [8]. Assessments of food glycemic utility for normal healthy persons typically involve consideration of glycemic index or glycemic load with comparison to white bread or a potato as reference, however these values may be less useful for diabetics who would seldom have an intake of the 50 grams carbohydrates or 200 calories required for GI calculation. Fruit serving sizes for diabetes provide about 15 grams of carbohydrate equivalent to about 55 Calories. The specific type 2 diabetic recommendation by the American Diabetic Association for a serving of raisins is 2 tablespoons or 18 grams of raisins [9]. Understanding the implications of grapes and raisins consumption for diabetics is limited by the paucity of human glycemic response data from type 2 diabetics [10].
Dried raisins have a long shelf-life, wide availability, and excellent portability due to a lack of need for refrigeration, in this regard raisin consumption could be used to improve fruit consumption in type 2 diabetics. The shelf life for bananas has been shown to be approximately three days [11], grapes five days [12], and white bread fifteen days [13]. The 100 calorie single-serving boxes are considered a healthy snack because they are nutrient dense and limit the portion size and may be of value for use by diabetics. This study of type 2 diabetics sought to determine if the glycemic and insulin response to 100 Calorie serving sizes of raisins is similar to that of Thompson seedless grapes, bananas and white bread.
2. Methods
2.1. Subjects Characteristics
This study was approved by the Winona State University Institutional Review Board prior to initiation. Participants had been previously diagnosed for non-insulin dependent type 2 diabetes by a physician or dietician consisting of 9 females and 6 males (57.8 ± 8.8 years; BMI 34.9 ± 6.2). Participant diabetes treatments included monotherapy (metformin; n = 11; glipizide n = 1) or diet and exercise (n = 3). Study exclusions included smoking, cancer treatment, use of steroidal drugs, or invasive cardiac procedures within the 6 months prior to study participation.
2.2. Study Design
This single cross-over study examined the glycemic response of type 2 diabetics to 100 Calorie servings of bananas (BA; 103.1 g), white bread (WB; 40.2 g), Raisins (RA; 30.3 g), and Thompson seedless grapes (TG; 112.4 g). Subjects returned to the laboratory every four days until participant glycemic responses to each of the four treatments had been characterized (16 day study). It is difficult to create a standardized fruit product for administration in a 16 day single cross-over design because of fruit ripening and resultant changes in fruit carbohydrate composition that could alter its effective glycemic response. In order to administer the selected fruit product so that their carbohydrate composition would be identical on any day of administration BA, WB and TG were frozen (−80˚C) and then thawed overnight and administered to participants at 3˚C on the following morning. RA were stored until use at 4˚C, but not frozen because compositional changes related to shelf-life are not great. Treatment caloric profiles for the four snack products were determined by Eurofins Scientific Inc., Des Moines, Iowa, USA from samples that were stored at −80˚C until being thawed overnight for analysis. The caloric profile of the single manufactured lot of white bread (Sara Lee Soft & Smooth Classic White, Downers Grove, Illinois, USA) was obtained from the nutrition facts package label. Caloric summaries of the treatments are displayed in Table 1.
Glycemic and insulinemic response to treatments was measured using an experimental design described in greater detail previously [14]. Subjects completed a 10- hour fast from all food and beverages except water prior to each weekly laboratory visit. The fasting period also included voluntary cessation of the use of any medications used for diabetes treatment. All medications, including metformin and other diabetic medications, could be taken immediately after the completion of each of the four laboratory visits. Upon laboratory arrival (between 5 and 7 am) participant height, weight, BMI, and current medications were recorded. Participants were then asked to rest quietly for 25 minutes to allow for a controlled physiological baseline, after which a baseline blood sample was collected.
After a baseline-fasting blood sample was collected from the finger using a finger lancet (Unistik, Fisher Scientific, Houston, TX). Collected blood was immediately analyzed for glucose with Accu-Chek® blood glucose analyzers (Roche Diagnostics Inc., Indianapolis, IN). Additional finger blood samples were collected in hematocrit tubes (200 µL) and centrifuged so plasma could be isolated and immediately frozen (−80˚C) for later use. Plasma insulin analysis (subset of 7 participants) was
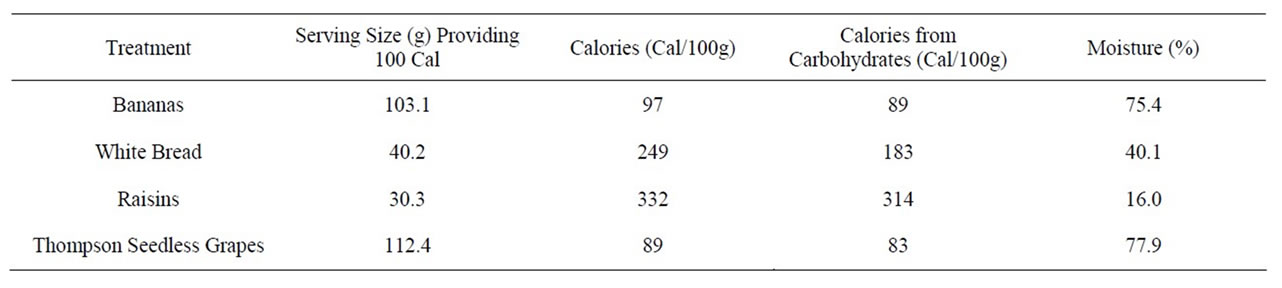
Table 1. Nutritional analysis of snacks administered to type-2 diabetic study participants in single cross-over fashion.
competed in operator-blind fashion on a single day for all samples using an enzyme linked immunosorbant assay (AlpcoInc, Salem, NH).
Following baseline blood collection, participants consumed their assigned treatment type (BA, WB, RA, or TG) with 50 mL of water to facilitate swallowing. Completion of the snack was completed within not more than four minutes and the time of snack completion was considered 0-minute. Postprandial blood collections were the repeated as above at 30, 60 and 120 minutes.
At the end of the fourth and final laboratory visit (120- minute), an additional venous blood sample was also collected at 120 minutes and assessed using a BeckmanCoulter Synchron CX5 (Brea, CA). Hemoglobin A1c was measured in order to verify participant diabetics status and glycemic control at the time of the study. Plasma glucose was measured to determine the accuracy of glucose measurements from those made using the Accucheck blood glucose analyzer. Participant blood lipid profiles were also measured to determine baseline health status.
2.3. Validation of Blood Glucose Measurement Accuracy
Blood glucose value obtained with the handheld Accuchek blood glucose meters used in this experiment were validated against plasma glucose values obtained using a Beckman-Coulter Synchron CX5 for the T120 on the final laboratory visit. These paired glucose measurements were tightly correlated (R2 = 0.958).
2.4. Statistical Analysis
Data are expressed as standard error of the mean (SEM). Area under the curve (AUC) values for plasma glucose and insulin were calculated by using the trapezoidal rule and Prism version 5.0 (GraphPad software Inc., La Hoya, CA). Following ANOVA, repeated measures analysis of variance was used to identify significant differences among treatments, among time points, and the interaction between treatment and time. Significant differences among least squares means (P < 0.05) were determined using the Tukey-Kramer adjustment (SAS Inst. Inc., Cary, NC, USA).
3. Results
All 15 participants who started the study completed all four treatments in single-crossover fashion. Baseline descriptions of participant plasma lipid and HbA1C values are shown in Table 2. Consumption of different treatments resulted in similar blood glucose responses (Figure 1, Table 3). Relative to baseline, glucose peaked significantly at T30 for TG, RA and WB at 204.6 ± 16.2, 180.5 ± 12.7, and 176.2 ± 12.2 mg/dL, respectively, the T30 value for BA was 173.2 ± 11.6 mg/dL and approached significance (p = 0.11) At T30, the glucose values for BA differed significantly from TG, and RA approached a significant difference with TG at T30 (p = 0.09). Peak glucose following WB was reached with significance from baseline at T60. No significant differences were observed at any other times, and all values returned to near baseline at T120 post-consumption. Glucose AUC values for BA, WB, RA and TG were 18,300 ± 1000, 19,200 ± 709, 18,600 ± 711, and 19,300 ± 965, respectively, with no statistically significant differences between the groups.
Plasma insulin values demonstrated no statistically significant differences within treatment across time or between treatments (Table 3), although the TG values between time T0 and T30 approached significance (P = 0.086). Insulin AUC values for BA, WB, RA and TG were 3520 ± 1210, 3450 ± 1120, 2970 ± 849, and 3960 ± 1370, respectively, with no statistically significant differences between the groups.
4. Discussion
This single cross-over study demonstrates that there is little metabolic difference in the glycemic response of a type 2 diabetics to isocaloric servings of bananas, white bread and raisins. While consumption of TG was associated with the highest postprandial blood glucose at 30 minutes, this value was only significantly different from that of the banana, in this regard banana blood glucose at 30 minutes only approached significance (P = 0.11).
The 100 calorie serving of WB was associated with a delay in peak blood glucose until 60 minutes. While all treatments were given in isocaloric fashion, TG displayed the greatest increase in blood glucose at T30. The increased water content (Table 1) of TG compared to RA, WB, and BA could have contributed to this effect by increasing the rate of gastric emptying from the stomach, by increasing carbohydrate solubility and enzymatic digestion in the intestine, any or all of which would lead to improved uptake into the blood stream. Because the WB was compressed prior to consumption to promote palatability with a 50 ml serving of water, this probably
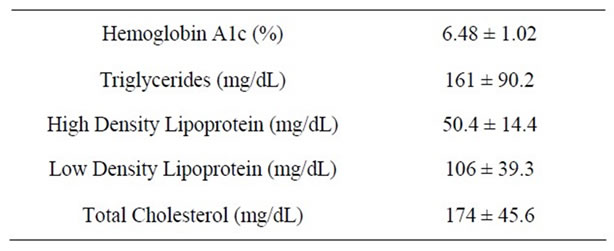
Table 2. Participant health status plasma profile: HbA1C, triglycerides, HDL, LDL, and cholesterol levels.
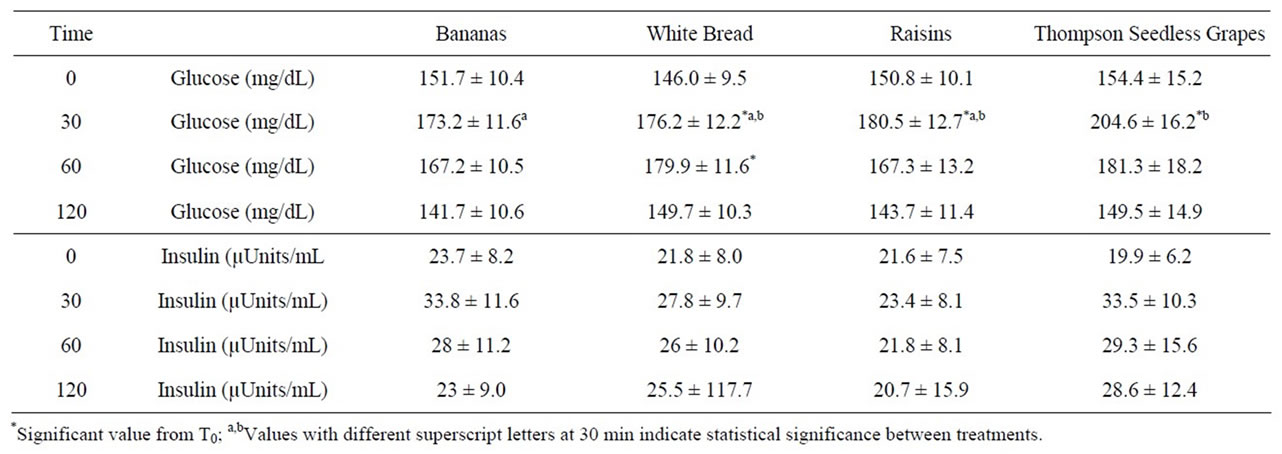
Table 3. Glycemic and insulinemic responses of type 2 diabetics to 100 Calorie servings of bananas, white bread, raisins, and Thompsons seedless grapes.
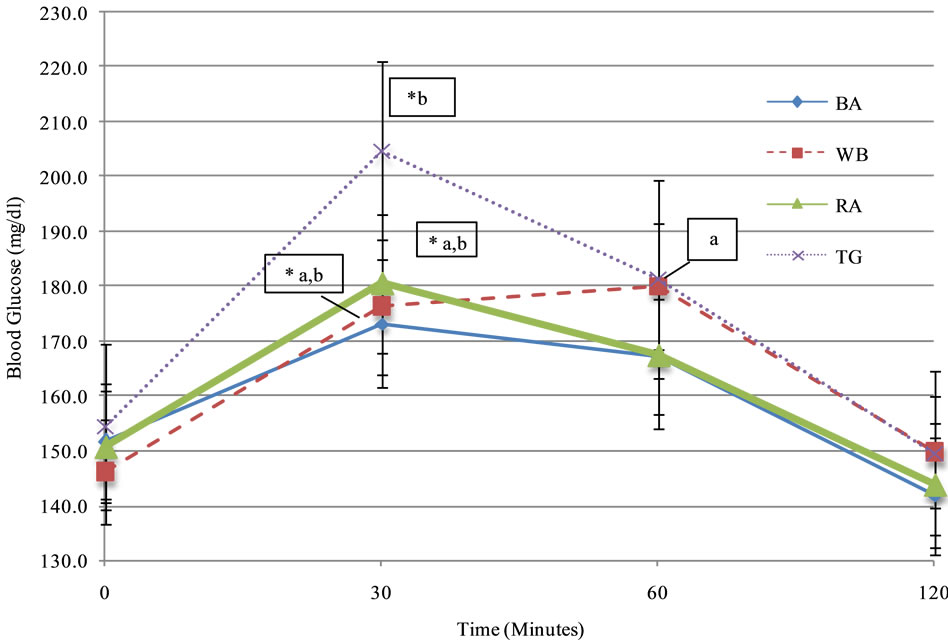
Figure 1. Glycemic responses of type 2 diabetics to 100 Calorie servings of bananas, white bread, raisins, and Thompsons seedless grapes (mean ± SEM). *Significant value from T0; a,bValues with different values at 30 min indicate statistical significance between treatments.
represents a delay in gastric mixing and emptying due to compression and increased density. Blood glucose values for WB displayed a delayed peak at T60. It is possible that this could de due to the impact of freezing and thawing on glycemic response. The glucose response response (IAUC) is significantly lower when bread is frozen and defrosted than when fresh [15]. This could also explain our lower than expected glycemic response of bananas or white bread. Although thawed, treatments were cold and well below room temperature at time of consumption. Nurton and Ligtowler demonstrated that cold storage prior to serving potatoes cold can significantly reduced glycemic and insulinemic response by 28% compared to freshly boiled potatoes [16]. They explained this effect by a 3.3% to 5.2% increase in resistant starch during cold storage of boiled potatoes. However, because TG have no starch they would not be affected by freezing and thawing, in addition the RA where not frozen prior to consumption.
Plasma insulin data was collected for a sub-set of study participants (n = 7) and large inter-individual insulin responses at baseline were observed depending upon the lab presentation day for our fasting study participants. Given the large variations in intra and inter-personal response, it is not surprising that no statistically significant differences were observed. However, the insulin values are suggestive of a subtle difference in metabolic responses to the 100 Calorie servings of TG and RA. When change in glucose is indexed to change in insulin between baseline and 30 minutes, the RA glucose/insulin index is 16.5 (29.7/1.8) while the TG index is 3.7 (50.2/ 13.6). For RA the smaller increase in glucose and insulin suggests that consumption may be associated with improved glycemic handling or insulin sensitivity. RA contains phenolic compounds and fiber that may slow the rate of gastric emptying, slowing intestinal glucose uptake permitting smaller amounts of secreted insulin to handle incoming glucose more efficiently. RA may also in some way be associated with an improvement in insulin sensitivity. This resembles results from a similar study in type 2 diabetics [10] and a study comparing raisins to candy bars, cola drinks, and bananas characterized a similar finding [17]. Other studies have suggested that diets that provoke less insulin secretion may be useful for prevention and management of type 2 diabetes [18].
5. Conclusion
This study characterized the glycemic response of type 2 diabetics to various fruit snack foods. It was found that RA had similar glycemic response in comparison to BA, and WB. Because of this, RA may be an attractive choice for improving fruit consumption in type 2 diabetics, along with the benefits of extended shelf life and portability.
6. Acknowledgements
This research project was supported by an unrestricted research grant from Sun-Maid Growers of California.
REFERENCES
- G. Williamson and A. Carughi, “Polyphenol Content and Health Benefits of Raisins,” Nutrition Research, Vol 30, No. 8, 2012, pp. 511-519. doi:10.1016/j.nutres.2010.07.005
- University of California, “Integrated Viticulture,” Thompson Seedless Grapes, 2012. http://ucanr.org/sites/intvit/Viticultural_Information/?uid=132&ds=351
- Center for Nutrition Policy and Promotion, US Department of Agriculture, “Dietary Guidelines for Americans: Report of the Dietary Guidelines Advisory Committee on the Dietary Guidelines for Americans,” 2010. http://www.cnpp.usda.gov/dgas2010-dgacreport.htm
- H. N. Hall, S. Moore, S. B. Harper and J. W. Lynch, “Global Variability in Fruit and Vegetable Consumption,” American Journal of Preventative Medicine, Vol. 36, No. 5, 2009, pp. 402-409. doi:10.1016/j.amepre.2009.01.029
- American Diabetes Association, “Executive Summary: Standards of Medical Care in Diabetes,” Diabetes Care, Vol. 33. No. 1, 2010, pp. S4-S10. doi:10.2337/dc10-S004
- Centers for Disease Control and Prevention, “National Diabetes Fact Sheet,” 2007. http://www.cdc.gov/diabetes/pubs/pdf/ndfs_2007.pdf
- E. S. Ford, “Risks for All-Cause Mortality, Cardiovascular Disease, and Diabetes Associated with the Metabolic Syndrome,” Diabetes Care, Vol. 28, No. 5, 2005, pp. 1769-1778. doi:10.2337/diacare.28.7.1769
- D. Jenkins, T. Wolever, R. Taylor, et al., “Glycemic Index of Foods: A Physiological Basis for Carbohydrate Exchange,” American Journal of Clinical Nutrition, Vol. 34, No. 3, 1981, pp. 362-366.
- The Academy of Nutrition and Dietetics Foundation, “Choose Your Foods: Exchange lists for Diabetes,” 2011. http://www.eatright.org/shop/product.aspx?id=4962
- S. Zunino, “Type 2 Diabetes and Glycemic Response to Grapes or Grape Products,” Journal Nutrition, Vol. 139, No. 9, 2009, pp. 1794S-1800S. doi:10.3945/jn.109.107631
- A. Klieber, N. Bagnato, R. Barrett and M. Sedgley, “Effect of Post-Ripening Nitrogen Atmosphere Storage on Banana Shelf Life, Visual Appearance and Aroma,” Postharvest Biology and Technology, Vol. 25, No. 1, 2002, pp. 15-24. doi:10.1016/S0925-5214(01)00163-6
- C. Montero, S. M. Cristescu, J. B. Jimenez, et al., “TransResveratrol and Grape Disease Resistance. A Dynamical Study by High-Resolution Laser-Based Techniques,” Plant Physiology, Vol. 131, No. 1, 2003, pp. 129-138. doi:10.1104/pp.010074
- A. Gambaro, S. Fiszman, P. Gimenez and A. Salvador, “Consumer Acceptability Compared with Sensory and Instrumental Measures of White Pan Bread: Sensory Shelf-Life Estimation by Survival Analysis,” Journal of Food Science, Vol. 69, No. 9, 2006, pp. S401-S405. doi:10.1111/j.1365-2621.2004.tb09957.x
- T. Wilson, A. P. Singh, N. Vorsa, et al., “Human Glycemic Response and Phenolic Content of Unsweetened Cranberry Juice,” Journal of Medicinal Food, Vol. 11, No. 1, 2008, pp. 46-54. doi:10.1089/jmf.2007.531
- T. Burton and H. J. Lighttowler, “The Impact of Freezing and Toasting on the Glycaemic Response of White Bread,” European Journal of Clinical Nutrition, Vol. 62, No. 5, 2008, pp. 594-599. doi:10.1038/sj.ejcn.1602746
- M. Leeman, E. Östman and I. Björck, “Vinegar Dressing and Cold Storage of Potatoes Lowers Postprandial Glycemic and Insulinemic Responses in Healthy Subjects Diabetes in Control,” European Journal of Clinical Nutrition, Vol. 59, No. 11, 2005, pp. 1266-1271. doi:10.1038/sj.ejcn.1602238
- G. Oettle, P. Emmett and K. Heaton, “Glucose and Insulin Responses to Manufactured and Whole-Food Snacks,” American Journal of Clinical Nutrition, Vol. 45, No. 1, 1987, pp. 86-91.
- J. Bao, V. Jong, F. Atkinson, et al., “Food Insulin Index: Physiological Basis for Predicting Insulin Demand Evoked by Composite Meals,” American Journal of Clinical Nutrition, Vol. 90, No. 4, 2009, pp. 986-992. doi:10.3945/ajcn.2009.27720
NOTES
*Corresponding author.