Food and Nutrition Sciences
Vol. 3 No. 2 (2012) , Article ID: 17532 , 7 pages DOI:10.4236/fns.2012.32038
Soy Consumption and Obesity
![]()
Biological Anthropology and Comparative Anatomy Research Unit, School of Medical Sciences, University of Adelaide, Adelaide, Australia.
Email: dante.auni@gmail.com
Received October 27th, 2011; revised December 14th, 2011; accepted December 22nd, 2011
Keywords: Soy; Obesity; Anti-Nutrients; Diet; Metabolism; Phytoestrogens; Phytates
ABSTRACT
Obesity is now present worldwide, including China, India and developing countries. It now seems no longer acceptable to argue that obesity can simply be explained in terms of caloric consumption only using simple concept of energy in and energy out. There may be specific causes of altered metabolism that produce nutritional imbalances. Individual variation in response to food intake may also be considered. Specific substances in the food chain can influence metabolism towards an increase in fat deposits. Xenoestrogens have been suggested to have such an influence. Soy contains phytoestrogens plus phytates, protease inhibitors and other anti-nutrients which block or compromise the body’s uptake of essential vitamins and minerals. This may contribute to nutritional anomalies. We analyzed data from WHO and FAO for 167 countries. These contained percentage of obese individuals (BMI > 30 kg/m2), GDP, caloric consumption per capita, and sugar and soy consumption per capita. Regressions and partial correlations were used. Soy consumption correlates significantly with levels of obesity, irrespective of GDP and caloric intake. For instance, poor Latin America with soy consumption of 28.9 kg/person/year has more obesity (18.4%) than better off European Union (14.1%) consuming 16.1 kg/person/year of soy. Soy consumption seems to contribute approximately 10% - 21% to the worldwide variation in obesity, depending on the method of statistical analysis. The ubiquitous presence of unfermented soy products in mass produced foods seems to be an important contributor to the obesity epidemic.
1. Introduction
The World Health Organization (WHO) recognizes obesity as a disease of global epidemic proportions [1]. Contrary to western perceptions, now even the Chinese have an obesity problem [2]. Caloric imbalance (over-eating and a lack of exercise) that has been for many decades, widely acknowledged as the cause of obesity, is now regarded as an inadequate explanation; sleep debt, endocrine disruptors, pharmaceutical iatrogenesis [3] as well as parental influences, economic and genetic predispositions are suggested [4,5]. Body frame size differences were recently postulated as contributive to individual variation in obesity [6]. This opens up the perception that some other specific causes may be contributing to the epidemic of obesity.
Soy is ubiquitously used for mass-produced foods, both for humans and for farm animals, especially industrialized farm animals and feed lots. According to Soyatech, “world soybean production has increased by over 500% in the last 40 years,” [www.soyatech.com/soyfacts.htm]. Soy is a vegetable that has become a “politically correct food,” and is promoted as a source of abundant health for the 21st century by the soyfood processing industry. Part of this claim is that the cheap protein from soy is equivalent or better for humans than that from animal sources. The soy industry generates an extensive array of new products affecting most of the global processed food supply with new processed foods promoted daily. Soy use takes many forms, either directly, in the form of soy flour and soy oil throughout the baking, bread-making, cooking and supermarket supply industries, or extensive in the restaurant, hotel, cafeteria and multiple fast food industry. Soy-rich processed food items include soy milk, soy-cheese, soy-yogurts, textured vegetable protein and a range of imitation meat products (often combined with other possible excess weight promoting co-factors). Directly or indirectly soy products, either with soybean extracts, soybean oil or both are heavily used in the large scale snack food industry. Soy lecithin is also used widely in the worldwide confectionery industry and the pharmaceutical industry, not only in the production of capsules, but also in their medical contents. Soy oil is hydrogenated to create many medical formulations (e.g. compounded in commonly used beta blockers). Soy is also consumed by humans indirectly via feed through industrialized farm animals, particularly those bred for human consumption. (For example, soy compounded pellets for caged animals which encourage the fattening process for market, including chickens and fish farms.) A commonly used argument for the benefits of soy, has been its supposedly extensive use in Asian cultures for thousands of years. However, most traditional Asian soy use has relied on methods such as fermentation to produce flavouring agents, soups and garnishes, rather than being used as the main dietary staple except in the historical past, in times of destitution. Historically, Asian cultures in the main, have always preferred real meat products (especially pork and seafood) to artificial imitation meat products. With regards to soy, western methods of soy processing and consumption predominately use unfermented soybeans. Such processes are and were, quite different from traditional Asian fermented soy products, thus altering contents and quantities of soy products consumed. The fact that Western methods of processing and consumption have now been exported back to, and readily adopted by Asian cultures, have made the modern western technologically based soy products available to be consumed worldwide.
Here, we advance a hypothesis that there is a correlation between soy consumption and the rise in obesity because of an unprecedented rise in consumption and ingestion of xenoestrogens and antinutrients contained in unfermented soy products.
Foods from soy can alter normal metabolic processes in a way that may lead to excess weight gain. Soy contains a number of phytates, trypsin inhibitors as well as phytoestrogens and topoisomerase II toxins, in larger quantities than most other vegetables. The xenoestrogens in soy behave like human estrogens and encourage fat accumulation in most mammals including humans. Thus, an argument could be made that the consumption of soy food products may contribute to obesity. The causes of the observed relationship may possibly belong to two categories: soy phytoestrogens and soy’s ability to inhibit absorption of essential nutrients. Phytoestrogens, in particular Genistein and similar substances contained in soy, interfere with metabolism in many ways [7,8], and may induce increased fat accumulation and distribution over the body depending on its intake levels [9]. The antinutrients in soy such as trypsin inhibitors and phytates [10,11] block the absorption of minerals such as iodine, zinc, iron, magnesium, copper and chromium, and many others, [12-14] and may thus require increased food consumption to compensate for the restricted intake of these minerals manifested by continual snacking and consuming larger quantities of food. Such foods often involve refined carbohydrates and flavour enhancers which also contribute to obesity in making soy palatable.
The effects of soy on the thyroid have been well documented [14,15]. Thyroid activity compromised by consumption of iodine inhibitors, as found in soy [16-19] leads to reduced metabolic activity which may translate into lethargy with reduced inclination to be involved in physical activities thereby encouraging further weight gain. Furthermore, low thyroxine levels have a negative domino effect on the liver, which generates more fatty acids and cholesterol encouraging further weight gains [17-19].
Soy may also exert an inhibitive influence on the trace element chromium [20] reducing the amount of available chromium, which in turn, also reduces the effectiveness of insulin [21-23]. Chromium is essential to improving glucose tolerance in mammals [23-25]. Western diets are typically low in chromium and if the microscopic levels are reduced even further by consumption of processed foods containing the anti-nutrients abundant in soy that block chromium, it is possible, that it will in turn also contribute to increased fatness and thus obesity [23-25] quite aside from problems of insulin resistance and related consequences for any associated diabetes morbidities. The chain of events that soy seems to influence gets longer with each type of newly developed processed food. An argument could also be made that many foods consumed today that have the appearance similar to what we consumed 30 - 50 years ago, are substantially different in both nutrient and solid content that have been partly or totally replaced by soy in its many forms. Hence, the importance of the necessity of correct labeling and properly detailed nutrition panels.
2. Materials and Methods
WHO data on the prevalence of obesity, FAO data on soy consumption per country and UN information on GDP and on caloric consumption per country were used to explore relationships between soy consumption and obesity. Information published by the WHO by country on the percentage of persons with body mass index (BMI) greater than 30 kg/m2 was used (http://who.int/research/ en). The gross domestic product (GDP in US$) per capita and the caloric consumption per capita were obtained from United Nations sources (http://unstats.un.org/unsd/ snaama/). Data from the Food and Agriculture Organization (FAO) generated information on soy consumption by country (http://faostat.fao.org/) which was converted to per capita by dividing it over population of each country. Each country was treated as an individual in the analysis. Data were analysed statistically using Microsoft Excel. Linear and curvilinear bivariate regressions, and comparisons between means (t-test, unpaired, two tailed) were used. All countries for which information was available were analysed. Some countries were included in special groupings sharing specific characteristics like language or geo-political status. For particular analyses, the number of countries included may have differed somewhat because all information was not uniformly available for all countries, as they may not have supplied data to relevant agencies (e.g. there were no data on soy consumption in Canada available form the FAO source). The groupings were Westernised English Speaking which included Australia, Bahamas, Barbados, Canada, Jamaica, Malta, New Zealand, South Africa, United States of America, European Union, including also countries of the European Economic Area and Switzerland, Austria, Belgium, Bulgaria, Czech Republic, Denmark, Estonia, Finland, France, Germany, Greece, Hungary, Italy, Iceland, Ireland, Latvia, Lithuania, Luxembourg, Malta, Netherlands, Norway, Poland, Portugal, Romania, Slovakia, Slovenia, Spain, Sweden, Switzerland, United Kingdom, and Latin America: Argentina, Bahamas, Barbados, Belize, Bolivia, Brazil, Chile, Costa Rica, Colombia, Cuba, Dominican Republic, Ecuador, El Salvador, Guatemala, Guyana, Haiti, Honduras, Jamaica, Mexico, Nicaragua, Panama, Paraguay, Peru, Trinidad and Tobago, Uruguay, Venezuela. Countries not included in those special groupings were also analysed when the entire world was considered.
3. Results
The analysis shows that although the prevalence of obesity (% of people with BMI > 30 kg/m2), in general, increases with increased caloric intake and GDP, the relationship is different for different groups of countries (Figure 1). Especially, the prevalence of obesity is higher in the group of Westernised English-speaking countries (e.g. USA, Canada, Australia, NZ) and countries located in both Americas. The same is true for the relationship between the prevalence of obesity and GDP (Figure 2). Most notably, higher levels of obesity are observed at different levels of GDP and caloric intake in westernised English-speaking countries and in Latin America that have similar high soy consumption levels. In contrast, European Union countries, despite having, on average, higher GDP and caloric intake than westernised English-speaking countries, have only half the levels of obesity. This is directly attributable to consuming only half the amount of soy (Table 1, last column). The differences between prevalence of obesity and soy consumption in EU and other two groups of countries are significant (unpaired t-test, p < 0.05). BMI EU vs Westernised English speaking countries t = 2.77, BMI EU vs Latin America t = 2.43. Soy EU vs Westernised English speaking countries t = 1.96, Soy EU vs Latin America t = 3.98. Worldwide, the prevalence of obesity is exponentially correlated with soy consumption standardised on caloric intake (Figure 3).
4. Discussion
We have observed significant relationships between soy consumption and the prevalence of obesity. Despite the
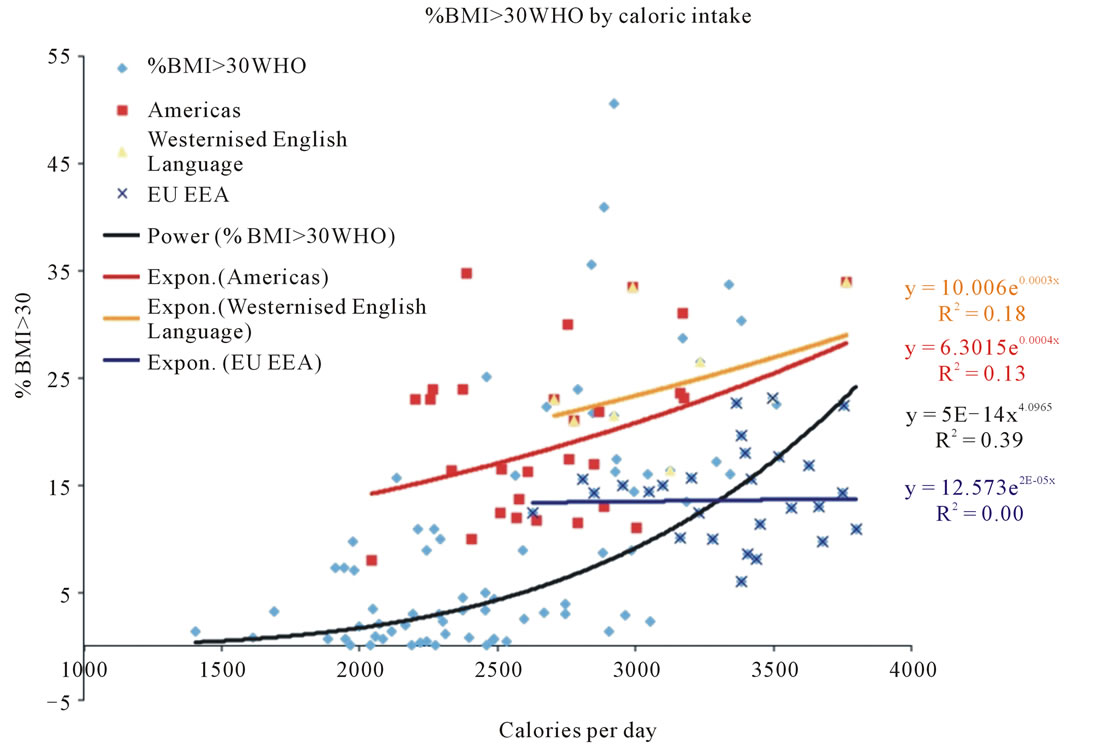
Figure 1. Relationship between prevalence of obesity and caloric intake, in groups of countries.
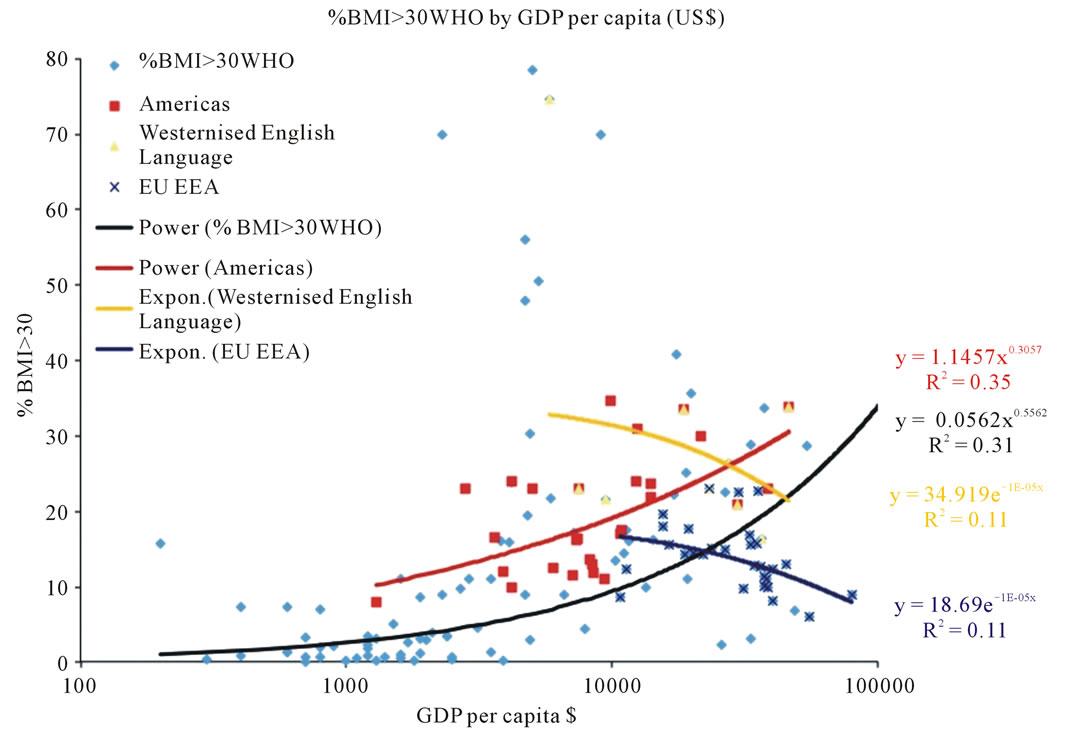
Figure 2. Relationship between prevalence of obesity and GDP in, groups of countries.

Table 1. Comparison of prevalence of obesity and soy consumption in variously grouped countries.
use of fairly crude measures of soy consumption and obesity derived from collective statistics, we have a range of interesting and statistically relevant results. Statistics reported by various countries may have various inaccuracies, in the case of larger countries averaging over the entire economy and the entire population may be questionable. BMI itself is an approximate measure of fatness and its reporting by country depends on local surveys of only a fraction of each population. (e.g. Australian Bureau of Statistics surveys some 10,000 adults out of just over 20 million inhabitants) [26]. This explains scatter of the individual datum points.
The recognition of the worldwide problem of obesity by the WHO has put the issue fairly and squarely on all governments agenda as an item that needs special funding consideration and deliberation from many quarters, besides biophysical wellbeing. Perhaps people in environments which experience frequent famine may see it as a positive [27], whereas in most countries or places, many obese people are not happy with their lot and in consequence develop a range of psychological problems and defenses, that also compromise their health placing a further burden on themselves and the people who care for them, as well as most publicly subsidized medical systems [28].
Much nutritional advice is still based on fallacious concepts promulgated from the 1950’s, 60’s and 70’s without taking full advantage of the data, from long term studies that included and spanned those decades. The Frammingham Heart Study was one of the major studies that has now arrived at entirely different conclusions, advanced, by the misleading saturated fat and cholesterol
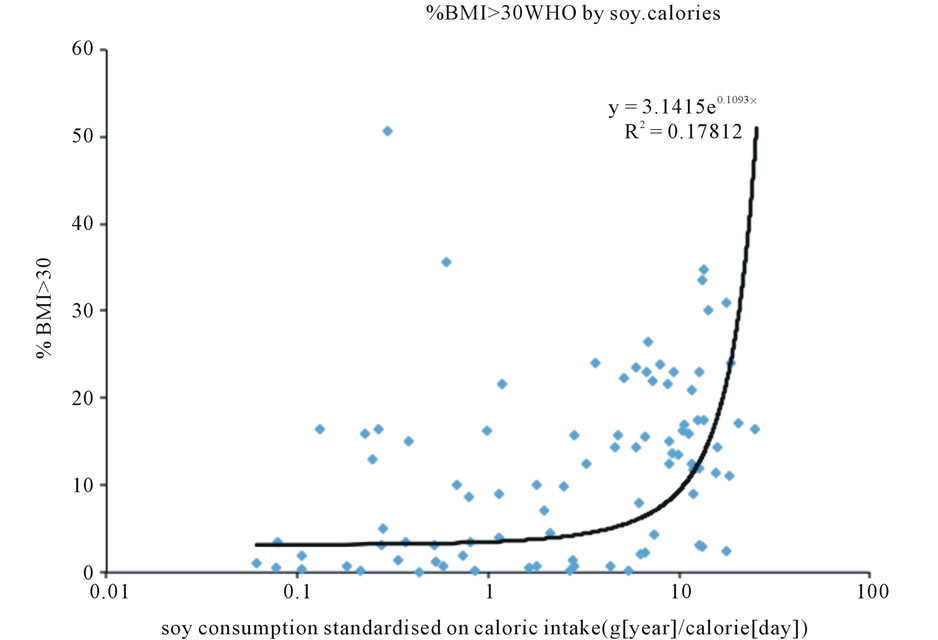
Figure 3. Relationship between prevalence of obesity and soy consumption standardized on caloric intake by country.
interpretations, aggressively promoted by Ancel Keyes which he derived from the hand-picked “Seven Nation Study” in the 1950’s. For example, the Frammingham Heart study that extended from the late 1940’s to the present day has enabled us to see that one of the real culprits behind heart disease and being over-weight, was not so much the natural saturated fatty acids and cholesterol, but the artificial transfats (artificially saturated fats) much preferred by the cooking and baking industry using polyunsaturated oils and margarines. Margarines were preferred because transfats gave long shelf life properties to their products [29,30]. The transfats and margarines were produced from predominantly polyunsaturated vegetable oils, that were hydrogenated, of which the main one that was cheap to use, was soybean oil. In the last decade or so, with the gradual realization of the health benefits of the natural monounsaturated, and saturated fats new margarines have been developed. Some nutritionists and/or manufacturers, have pushed the strange idea, for example that by combining margarine with a small percentage of olive oil, makes the margarine a better product. It certainly is a more marketable product, but lest it escape us, all it means, is that any efficacy inherent in the olive oil is compromised by the artificiality of the hydrogenated polyunsaturated vegetable oil, which usually means soybean oil. With marketing duplicity, any label that hides behind a vegetable oil termed description where the manufacturer does not spell out the types of vegetable oils that are used, in any product under consideration, skepticism should prevail and possibly conclude that the oil used will most likely be the cheaper soybean oil. This could mean that soy consumption may be even higher than the figures show.
Although soy consumption shows statistical coincidence with the prevalence of obesity, the awareness of numerous other factors that are involved in increasing fatness and obesity [3,10] such as caloric imbalance, genetic predisposition and metabolic syndrome still need to be taken into account. The fact that soy products often require other factors for palatability that are also implicated in the obesity equation [31] should not escape us. Nonetheless the statistically significant relationship that has been observed, between soy and obesity, strongly indicates and thereby requires that it should be scrutinised with much more specific attention than has so far been cursorily given.
Perhaps the way to combat obesity that seems to have escaped many analysts’ attention, would be to not only consider programs of multiple interventions, but to also take more seriously a far more careful analysis and research, of the composition of foods, that were not part of our evolutionary history, especially those modern foods containing soy that are promoted and consumed in the greatest amounts, which are now so widespread throughout the food supply.
5. Acknowledgements
Financial support to MH was provided by the Wood Jones Bequest to the University of Adelaide.
DR reviewed the literature, formulated the hypothesis relating soy to obesity and participated in interpreting results and writing the text, MH did the data analyses and participated in interpreting results and writing the text.
REFERENCES
- A. Basdevant and C. Ciangura, “Obesity, a Disease,” Bulletin de l’Académie Nationale de Médecine, Vol. 194, No. 1, 2010, pp. 13-20.
- T. Wu, “Overweight and Obesity in China,” BMJ, Vol. 333, 2006, pp. 362-363. doi:10.1136/bmj.333.7564.362
- S. W. Keith, et al., “Putative Contributors to the Secular Increase in Obesity: Exploring the Roads Less Traveled,” International Journal of Obesity, Vol. 30, 2006, pp. 1585- 1594. doi:10.1038/sj.ijo.0803326
- I. Rashad and M. Grossman, “The Economics of Obesity,” Public Interest, Vol. 156, 2004, pp. 104-112.
- S. J. Salvy, A. Elmo, L. A. Nitecki, M. A. Kluczynski and J. N. Roemmich, “Influence of Parents and Friends on Children’s and Adolescents’ Food Intake and Food Selection,” American Society for Nutrition, Vol. 93, No. 1, 2011, pp. 87-92.
- M. Henneberg and S. J. Ulijaszek, “Body Frame Dimensions Are Related to Obesity and Fatness,” American Journal of Human Biology, Vol. 12, No. 1, 2010, pp. 83-91. doi:10.1002/ajhb.20957
- K. Szkudelska and L. Nogowski, “Genistein—A Dietary Compound Inducing Hormonal and Metabolic Changes,” J. Steroid Biochemistry & Molecular Biology, Vol. 105, No. 1-5, 2007, pp. 37-45. doi:10.1016/j.jsbmb.2007.01.005
- B. Radovic, B. Mentrup and J. Kohrle, “Genistein and Other Soya Isoflavones Are Potent Ligands for Transthyretin in Serum and Cerebrospinal Fluid,” British Journal of Nutrition, Vol. 95, No. 6, 2006, pp. 1171-1176.
- C. W. Xiao, “Health7 Effects of Soy Protein and Isoflavones in Humans,” Journal of Nutrition, Vol. 138, No. 6, 2008, pp. 1244S-1249S.
- M. Penza, et al., “Genestein Affects Adipose Tissue Deposition in a Dose-Dependent and Gender-Specific Manner,” Endocrinology, Vol. 147, No. 12, 2006, pp. 5740- 5751. doi:10.1210/en.2006-0365
- B. D. Roebuck, “Trypsin Inhibitors Potential Concern for Humans?” Journal of Nutrition, Vol. 117, No. 2, 1987, pp.398-400.
- J. R. Turnlund, J. C. King, W. R. Keyes, B. Gong and M. C. Michel, “A Stable Isotope Study of Zinc Absorption in Young Men: Effects of Phytate and a-Cellulose,” American Journal of Clinical Nutrition, Vol. 40, No. 5, 1984, pp. 1071-1077.
- N. S. Shaw, C. J. Chin and W. H. Pan, “A Vegetarian Diet Rich in Soybean Products Compromises Iron Status in Young Students,” Journal of Nutrition, Vol. 125, No. 2, 1995, pp. 212-219.
- M. J. Messina, “Legumes and Soybeans: Overview of Their Nutritional Profiles and Health Effects,” American Journal of Clinical Nutrition, Vol. 70, No. 3, 1999, pp. 439-450.
- R. L. Divi and D. R. Doerge, “Inhibition of Thyroid Peroxidase by Dietary Flavonoids,” Chemical Research in Toxicology, Vol. 9, No. 1, 1996, pp. 16-23. doi:10.1021/tx950076m
- D. R. Doerge, “Goitrogenic and Estrogenic Activity of Soy Isoflavones,” Environmental Health Perspectives, Vol. 110, Suppl. 3, 2002, pp. 349-353. doi:10.1289/ehp.02110s3349
- R. B. Clarkson, M. S. Anthony and C. L. Hughes, “Estrogenic Soybean Isoflavones and Chronic Disease: Risks and Benefits,” Trends in Endocrinology & Metabolism, Vol. 6, No. 1, 1995, pp. 11-16. doi:10.1016/1043-2760(94)00087-K
- W. A. Forsythe, “Soy Protein, Thyroid Regulation and Cholesterol Metabolism,” Journal of Nutrition, Vol. 125, Suppl. 3, 1995, pp. 619-623.
- F. Balmir, et al., “An Extract of Soy Flour Influences Serum Cholesterol and Thyroid Hormones in Rats and Hamsters,” Journal of Nutrition, Vol. 126, No. 12, 1996, pp. 3046-3053.
- K. S. H. Keim, “Glucose, Insulin, and Lipase Activity of Rats Fed Chromium from Beef and Soy,” PhD Thesis, Texas Tech University, Lubbock, 1983.
- D. J. Appleton, J. S. Rand, G. D. Sunvold and J. Priest, “Dietary Chromium Tripicolinate Supplementation Reduces Glucose Concentrations and Improves Glucose Tolerance in Normal-Weight Cats,” Journal of Feline Medicine and Surgery, Vol. 4, No. 1, 2002, pp. 13-25. doi:10.1053/jfms.2001.0157
- A. Urmila Shinde, G. Sharma, Y. J. Xu, N. S. Dhalla and R. K. Goyal, “Anti-Diabetic Activity and Mechanism of Action of Chromium Chloride,” Experimental and Clinical Endocrinology & Diabetes, Vol. 112, No. 5, 2004, pp. 248-252. doi:10.1055/s-2004-817971
- X. Guan, et al., “High Chromium Yeast Supplementation Improves Glucose Tolerance in Pigs by Decreasing Hepatic Extraction of Insulin,” Journal of Nutrition, Vol. 130, No. 5, 2000, pp. 1274-1279.
- B. Bahadori, S. Wallner, H. Schneider, T. C. Wascher and H. Toplak, “Effect of Chromium Yeast and Chromium Picolinate on Body Composition of Obese, Non-Diabetic Patients during and after a Formula Diet,” Acta Medica Austriaca, Vol. 24, No. 5, 1997, pp. 185-187.
- D. M. Stearns, J. J. Belbruno and K. E. Wetterhahn, “A Prediction of Chromium (III) Accumulation in Humans from Chromium Dietary Supplements,” FASEB Journal, Vol. 9, No. 15, 1995, pp. 1650-1657.
- Australian Bureau of Statistics, How Australians Measure Up,” Publication No. 4359, Canberra, 1998.
- A. Shaheen, A. Magnusson, A. Khan, K. Ali and A. Hussain, “In Bangladesh, Overweight Individuals Have Fewer Symptoms of Depression Than Non Overweight Individuals Obesity,” Obesity, Vol. 18, No. 6, 2010, pp. 1143- 1145. doi:10.1038/oby.2009.332
- A. Must, et al., “The Disease Burden Associated with Overweight and Obesity,” JAMA, Vol. 282, No. 16, 1999, pp. 1523-1529. doi:10.1001/jama.282.16.1523
- P. W. Castelli, “Concerning the Possibility of a Nut,” Archives of Internal Medicine, Vol. 152, No. 7, 1992, pp. 1371-1372. doi:10.1001/archinte.1992.00400190013003
- C. V. Felton, D. Crook, M. J. Davies and M. F. Oliver, “Dietary Polyunsaturated Fatty Acids and Composition of Human Aortic Plaques,” Lancet, Vol. 344, No. 8931, 1994, pp. 1195-1196. doi:10.1016/S0140-6736(94)90511-8
- K. He, L. Zhao, M. L. Daviglus, A. R. Dyer, L. V. Horn, D. Garside, L. Zhu, D. Guo, Y. Wu, B. Zhou and J. Stamler for the INTERMAP Cooperative Research Group, “Association of Monosodium Glutamate Intake with Overweight in Chinese Adults: The INTERMAP Study,” Obesity , Vol. 16, No. 8, 2008, pp. 1875-1880. doi:10.1038/oby.2008.274