 International Journal of Geosciences, 2012, 3, 179-191 http://dx.doi.org/10.4236/ijg.2012.31020 Published Online February 2012 (http://www.SciRP.org/journal/ijg) Attenuation of P, S and Coda Waves in the NW-Himalayas, India Imtiyaz A. Parvez, Preeti Yadav, K. Nagaraj CSIR Centre for Mathematcial Modelling and Computer Simulation (C-MMACS) NAL, Belur Campus, Bangalore, India Email: parvez@cmmacs.ernet.in Received August 5, 2011; revised September 19, 2011; accepted November 15, 2011 ABSTRACT The frequency-dependent characteristics of P- and S-wave attenuation in the upper crust of NW Himalayas have been estimated using local earthquakes for a frequency range of 1.5 to 18 Hz. A total of 43 local events of magnitude 2.1 - 4.8, mostly from the vicinity of Main Boundary Thrust (MBT) and Main Central Thrust (MCT) have been used in the analysis. The extended coda normalization methods were applied to estimate the quality factors for P-waves (QP) and S-waves (QS) and the single back-scattering model has been used earlier (Kumar et al. [1]) to determine the quality fac- tor for coda waves (QC). The observed quality factors QP and QS is strongly frequency dependent and the estimated av- erage frequency dependent relation is given by QP = (97 ± 3)f (1.06±0.06) and QS = (127 ± 6)f (0.96±0.06) respectively for P- and S-waves. A comparison of QS estimated in this study and QC previously reported shows that QC > QS for entire fre- quency range. This indicates the enrichment of coda waves and the importance of scattering attenuation to the attenua- tion of S-waves in the study region infested with faults and fractures. The ratio QS/QP is found to be greater than unity for the entire frequency range indicating that the body waves from source to station paths crossed a crustal volume with dry and rigid rocks. The frequency dependent relations developed in this study can be very useful to ground motion modeling which in turn is required in the seismic hazard assessment of the region. Keywords: Attenuation; Quality Factor; Frequency Dependence; NW Himalayas 1. Introduction In order to investigate the structure of the interior of the earth and to quantitatively predict the strong earthquake ground motion in engineering seismology, the informa- tion on seismic wave attenuation plays an important role. Especially, the information on high frequency wave at- tenuation in the lithosphere is of particular importance. Attenuation parameter Q–1 is an important factor for un- derstanding the physical mechanism of seismic wave atenuation in relation to the composition and physical condition of the earth’s interior [2]. From the engineering point of view, attenuation of S-waves has been well studied in various regions in the world as compared with that of P-waves. Aki [3] first obtained frequency de- pendent S in Kanto, Japan for the frequency range of 1.5 - 24 Hz by means of the coda-normalization method. Nevertheless, the information on 1 Q 1 Q is also indispen- sable for evaluating the strong vertical ground motion pre- cisely in view of the earthquake-resistant design of recent huge constructions. Attenuation of seismic waves with frequency strongly depends on the physical conditions of the underground crustal media and is caused by different factors like geo- metrical spreading, scattering, multipathing and anelas- ticity. The crustal value of attenuation, described as the inverse of the quality factor (Q–1), shows a close relation with seismic activity and is given Knopoff [4]. 12πQEE (1) where ΔE is the energy lost per cycle and E is the total energy of a harmonic wave. Q expresses the decay of wave amplitude during its propagation in the medium. It has been observed that at high frequency (>1 Hz) Q in- creases with frequency [5] and can be represented by a power law, 00 n QQff 1 P (2) where f is frequency, Q0 is value of Q at frequency f0 (1 Hz) and n is the frequency dependent coefficient to be determined from the observations. The attenuation of seismic waves has been widely studied in several seismogenic zones using various ap- proaches (e.g., [6-9]). It has been found that the attenua- tion for P-wave (Q ) is different from that of S-wave (S Q1 ). The ratio QS/QP also varies from one region to another [10]. The coda normalization method to estimate the C opyright © 2012 SciRes. IJG  I. A. PARVEZ ET AL. 180 frequency-dependent relation for QS is proposed by [3]. Reference [11] extended this method for simultaneous measurement of QP and QS. Similarly, high frequency coda waves recorded during the occurrence of local earthquakes, which arrive at station after the arrival of all direct phases, are assumed to be the superposition of back- scattered primary S-waves generated by the numerous heterogeneities distributed randomly in the earth’s crust and upper mantle. These waves arrive at the station on different time intervals and form a coda. Therefore, the decay of these waves with time, in a seismogram, pro- vides the average attenuation characteristics of the me- dium instead of the property of a single path connecting from a source to the station. As these waves are the result of numerous heterogeneities distributed randomly, they cannot be explained by any deterministic approach in which a number of parameters are required to describe a small portion of seismogram. However, they can be solved by applying the statistical method in which a small number of parameters is sufficient to describe the properties of coda waves. [6] and [7] are pioneers in this field and they proposed a single backscattering model to use the coda waves of local earthquakes for the estimation of quality factor (QC) of coda waves in a region. Numer- ous studies have been carried out in different parts of the world to determine the seismic wave attenuation proper- ties of the medium. These studies analyze the coda waves of local earthquakes for the estimation of QC values, using the single backscattering model (e.g., [1,12-17]). The main objective of this study is to understand the attenuation characteristics of the North-West Himalaya region using different parts of the seismograms including coda waves and body waves. For this purpose, the extended coda normalization method [11] has been used to estimate the frequency-dependent relationships for QP and QS in the NW Himalaya region and that is the first estimate of this kind for this region. The QC estimates for the NW Hima- laya region have been previously obtained by [1] using the single back-scattering model of [7] and in the present study we integrate and compare the estimated QP and QS with QC obtained by [1]. 2. Tectonic Setup of the Region The Himalaya is the youngest mountains range and is developed by the continent-continent collision between Indian and Tibetan plate [18,19]. High levels of tectonic activity are due to the opposite convergence movements of north dipping Indian plate under Eurasian plate. The region is characterized by the presence of many tectonic features that includes Indian Tsangpo-Suture zone (ISZ), Main Central Thrust (MCT), Main Boundary Thrust (MBT) and Himalayan Frontal Thrust (HFT). The two thrusts exist through the entire length of the Himalaya. The MBT separates the lesser Himalaya from the sub- Himalaya belt while MCT separates the high Himalaya from the lesser Himalaya. In the present study region, along with MCT, MBT and HFT the Jawalamukhi thrust (JMT), Drang thrust, Panjal thrust, Vakirata thrust, Sun- dernagar fault, Kistwar fault and Ropar fault are well known tectonic features. The tectonic movement of NW Himalayas and major discontinuities are shown in Figure 1. Reference [1] has explained in detail the tectonic setup of the region. 3. Method of Analysis The coda normalization method [2] is based on the empirical observation that the coda spectral amplitude at lapse times greater than twice the S-wave travel time is proportional to the source spectral amplitude of the S- waves at distances of less than 100 km. This implies that the coda spectral amplitude is not dependent to the hypo central distance and that the site and source terms which are common in coda and direct waves can be removed by the coda normalization method [3]. Reference [11] has extended the above method for the estimation of Q under the assumption that the earth- quakes within a magnitude range have the same spectral ratio of P- to S-wave radiation within a narrow frequency range. This assumption holds well even if the spectral shapes of P- and S-waves are different (e.g., [10,20]). Therefore, we can write cc SP , ftS fSf (3) Sf P and where, Sf S are the source spectral am- plitude of P- and S-waves. Using the above assumption, an equation for estimating QP can be written as [33]: P CPP ,π ln const ,crr Afrrfrf Aft QfV (4) S CcS S ,π ln const ,rr Afrrfrf Aft QfV (5) , P , S fr and where fr V are the direct P- and S-waves maximum amplitudes at the hypocentral dis- tance r (km), respectively. P and S V are the average P- and S-wave velocities. The quality factor for P-wave can be obtained from the linear regression of P C , ln ,crr Afrr Aft versus r by means of the least squ- are method and same is used for S-waves. 4. Data The study area covered comprises of three seismic sta- tions Pathankot (PTK), Hoshiarpur (HOS) and Amritsar Copyright © 2012 SciRes. IJG  I. A. PARVEZ ET AL. Copyright © 2012 SciRes. IJG 181 Figure 1. General Seismotectonic and topographical map of NW Himalayas and adjoining area. MCT: Main Central Thrust; MBT: Main Boundary Thrust; HFT: Himalayan Frontal Thrust; JMT: Jawalamukhi Thrust; KWF: Kisatwar Fault; SNF: Sundarnager Fault; eart hquake e picentre s are plotted by circle s, triangles r epresent the r ecording stations (PTK: P athankot; HOS: Hoshiarpur; ASR: Amritsar) and cities are shown by squares. (ASR) in NW Himalaya region (Figure 1). The first seismic station, PTK is on the top of the Siwalik Hills; the second one, HOS is at Siwalik foothills; while third one, ASR station is located on the Gangetic plain. The station PTK is situated on hard bedrock in the vicinity of high tectonic and seismic activity at high altitude. The station HOS is situated at alluvium near recent tectonic and moderate seismic activity, and the station ASR is on a thick alluvium of the Gangetic plain away from tectonic and seismic activities. All the stations were equipped with portable high quality three component short-period (1 Hz natural frequency) L4-3D seismometers of Mark pro- ducts (USA) and high dynamic range 24 bit recording apparatus of REFTEK (USA). The instruments were set- up to digitize the signal at 100 sps and an antiallising filter was applied to get the flat velocity spectrum be- tween 1 and 40 Hz. The digital events data utilized for Q calculation were recorded during 1997-1999 at the regional seismograph network of three seismic stations by Earthquake Research Centre, Guru Nanak Dev University, Amritsar. During the given period, more than 300 seismic events were recorded from different epicentral ranges. Out of these, 36 local events were used by [1] for coda Q calculation and the same has been used in this study for estimating QP and QS. The detailed epicentral information of seismic events is listed in Table 1, which indicates that the maximum events are recorded at PTK station while minimum events  I. A. PARVEZ ET AL. 182 Table 1. Earthquake data used for QP and QS calculation. Sr. No. Date (dd/mm/yy) O.Time (hh:mm:ss) Latitude (˚N) Longitude (˚E) ∆ (km) Depth (km) M Station: Pathankot 1 23/12/97 04:15:04.90 33.805 75.234 161 33.0 4.0 2 25/04/98 18:15:50.80 31.533 76.028 108 30.0 2.3 3 18/05/98 12:29:31.80 33.157 75.839 102 65.0 3.5 4 01/07/98 22:50:51.40 32.691 75.318 53 19.5 3.5 5 05/07/98 22:33:36.70 32.852 75.675 55 10.0 2.4 6 05/07/98 23:04:21.80 32.837 75.596 47 12.0 3.0 7 06/07/98 10:24:08.80 32.987 75.629 102 82.5 4.2 8 31/07/98 02:16:14.50 32.522 75.372 37 6.0 3.6 9 17/08/98 17:55:00.80 33.223 76.001 95 33.0 3.4 10 25/08/98 11:48:04.90 32.543 76.533 75 15.0 2.6 11 02/09/98 01:02:26.10 32.957 76.342 79 5.0 3.0 12 28/09/98 00:21:02.60 32.737 75.947 40 15.0 3.1 13 28/09/98 21:17:01.00 31.551 76.995 154 22.0 2.2 14 17/10/98 09:24:45.00 32.217 76.545 85 33.0 4.5 15 06/11/98 14:29:34.50 32.299 76.010 44 34.0 3.8 16 11/01/99 01:30:26.10 31.820 77.115 146 5.0 3.5 17 16/01/99 03:07:46.80 32.987 76.058 66 5.0 2.7 18 15/02/99 00:14:52.00 32.232 76.523 76 4.0 2.7 19 21/02/99 15:14:56.50 32.833 75.898 46 10.0 2.1 20 15/03/99 21:56:37.50 33.062 76.078 75 5.0 2.5 21 16/03/99 19:16:19.20 32.396 76.732 93 15.0 2.3 22 22/03/99 20:31:17.70 32.894 75.813 50 5.0 2.2 23 27/03/99 11:49:31.40 32.462 76.422 63 10.0 3.5 24 22/04/99 05:22:04.80 32.996 75.768 61 7.0 3.2 25 07/05/99 14:44:57.40 31.861 75.455 70 33.0 3.0 26 08/05/99 20:59:17.40 33.442 75.912 112 15.0 2.7 27 12/07/99 21:45:59.40 33.110 75.768 102 72.0 3.7 28 27/07/99 20:19:09.70 32.577 76.466 68 10.0 3.2 29 28/07/99 10:42:52.70 32.533 76.313 53 10.0 2.5 30 30/07/99 18:18:25.20 32.704 76.633 88 15.0 2.5 31 31/07/99 13:02:25.80 33.046 76.777 116 15.0 2.2 Station: Amritsar 32 29/07/97 09:43:35.80 32.831 73.680 171 10.0 4.8 33 29/07/97 18:00:18.20 31.554 76.817 189 33.0 4.7 34 13/08/97 23:10:15.10 31.211 76.694 184 33.0 4.2 35 21/02/98 19:08:04.30 33.292 75.466 193 15.0 2.6 36 24/03/98 04:25:42.90 32.462 73.901 126 42.5 4.0 37 01/07/98 22:50:51.40 32.691 75.318 126 19.5 3.5 38 05/07/98 23:04:21.80 32.837 75.596 152 12.0 3.0 39 28/09/98 21:17:01.10 31.551 76.995 202 30.0 2.2 40 17/10/98 09:24:45.00 32.217 76.545 175 33.0 4.5 Station: Hoshiarpur 41 05/07/98 23:04:30.00 32.837 75.600 115 12.0 3.0 42 17/10/98 09:24:45.00 32.217 76.550 98.2 4.5 4.5 43 06/11/98 14:29:34.50 32.299 76.010 95.4 34.0 3.8 Copyright © 2012 SciRes. IJG  I. A. PARVEZ ET AL. 183 at HOS station. All the 31 events of PTK station used here are from 25 ≤ R ≤ 165 km of epicentral distance, all nine events of ASR station used are from 100 ≤ R ≤ 205 km of epicentral distance and in case of HOS station total three events taken are from 50 ≤ R ≤ 115 km epicenter range. Most of the seismic events are located between MBT and MCT bounded by two other transverse faults as the Sundernagar fault to the east and of same trend the Kistwar fault to the west. This region is very close to the PTK station in the northeast direction. 5. Results and Discussion The seismograms have been filtered using Butterworth band pass filter with six frequency pass bands of 0.5 - 1.5 Hz, 1 - 3 Hz, 2 - 5 Hz, 5 - 10 Hz, 10 - 15 Hz and 12 - 24 Hz. On the filtered seismograms, maximum amplitudes of direct P- and S-waves were measured from vertical and horizontal component respectively. The coda spectral amplitude, Ac(f, tc), has been measured for each fre- quency band by choosing to be longer than twice the S- wave travel time. The average velocities of 6.1 km/sec and 3.5 km/sec for P- and S-waves, respectively, have been used in the present study [1]. We also assume the geometrical spreading is proportional to r–1. The plots of the quantity ln((Ap/Ac)r) and ln((As/Ac)r) versus r along with the least square fitted lines for the station PTK are shown in Figure 2. The corresponding plots of the other two stations ASR and HOS are shown in Figures 3 and 4 respectively. The slopes of the best fitted lines are used to estimate QP and QS using the Equations (4) and (5) respectively for six different frequency bands. The mean values of QP and QS, thus, obtained at different frequency bands and their average values for the three stations, are given in Table 2. We note that the estimated Q values increase with the increase in frequency. The value of QP for PTK Station varies from 94 at (0.5 - 1.5) Hz to 1893 at (12 - 24) Hz, for ASR Station QP varies from 68 at (0.5 - 1.5) Hz to 1783 at (12 - 24) Hz and for HOS Station it varies from 71 at (0.5 - 1.5) Hz to 1656 at (12 - 24) Hz. Similarly, the value of QS for PTK Station varies from 168 at (0.5 - 1.5) Hz to 2694 at (12 - 24) Hz, for ASR Station, the range is from 122 at (0.5 - 1.5) Hz to 2155 at (12 - 24) Hz and for HOS Station, it varies from 115 at (0.5 - 1.5) Hz to 2245 at (12 - 24) Hz. The average value for the region is also estimated and it varies from 78 at (0.5 - 1.5) Hz to 1777 at (12 - 24) Hz for QP and for QS, the values are 135 at (0.5 - 1.5) Hz to 2365 at (12 - 24) Hz. We find a clear frequency dependency of QP and QS as they increase with frequency and that indicates the fre- quency-dependent nature of Q estimates in the region. Their frequency dependencies indicate that the at- tenuation of P- and S-waves at high frequencies is less pronounced than at lower frequencies. This is a charac- teristic of tectonically active zones with complex struc- ture. In order to estimate the frequency-dependent rela- tions for Q, the power law Q = Q0 f n is fitted to the esti- mated Q values for each station. We have plotted log QP and log QS with the log of frequency to estimate the fre- quency-dependent relationships as shown in Figure 5. The frequency-dependent relations thus obtained for all the three stations, along with the average, are given in Ta- ble 3. The average frequency-dependent relations for the region are QP = (97 ± 3) f (1.06 ± 0.06) and QS = (127 ± 6) f (0.96±0.06). We have estimated QC earlier for NW-Himalayas [1] Table 2. QP and QS values obtained for the three stations and their average values for six different frequency bands. ASR HOS PTK Average Sl. No. Freq. band (Hz) QP Q S Q P Q S Q P Q S Q P Q S 1 0.5 - 1.5 68 122 71 115 94 168 78 135 2 1 - 3 132 409 126 245 261 288 173 314 3 2 - 5 323 551 314 495 653 919 430 655 4 5 - 10 647 1124 712 998 884 1421 748 1181 5 10 - 15 1075 1764 1013 1492 1508 1727 1199 1661 6 12 - 24 1783 2155 1656 2245 1893 2694 1777 2365 Table 3. Frequency-dependent relationships of QP and QS obtained for the three stations and overall average value for the region. Frequency-dependent relationships for three stations Sl. No. Station Code Relation for P wave Relation for S wave QS/QP ratio 1 ASR QP = (98 ± 4) f (1.11 ± 0.04) Q S = (119 ± 7) f (0.94±0.07) 1.21 2 HOS QP = (85 ± 3) f (1.1 ± 0.06) Q S = (122 ± 3)f (1.01±0.03) 1.43 3 PTK QP = (103 ± 8) f (0.99 ± 0.09) Q S = (139 ± 13)f (0.95±0.09) 1.35 4 Average QP = (97 ± 3) f (1.06 ± 0.06) Q S = (127 ± 6)f (0.96±0.06) 1.31 Copyright © 2012 SciRes. IJG  I. A. PARVEZ ET AL. 184 2060100 140 180 r (kms) 1 3 5 7 9 ln((A P \A C ) r) 5-10Hz Q P =884 2060100 140 180 r (kms) 1 3 5 7 9 ln((A P \A C ) r) 2-5Hz Q P =653 2060100 140 180 r (kms) 1 3 5 7 9 ln((A P \A C ) r) 1-3Hz Q P =261 2060100 r (kms) 140 180 3 5 7 9 11 ln((A S \A C ) r) 5- Q 10Hz S =1421 2060100 r (kms) 140 180 3 5 7 9 11 ln((A S \A C ) r) 1-3Hz Q S =288 2060100 140 180 r (kms) 1 3 5 7 9 ln((A P \A C ) r) 10-15Hz Q P =1508 2060100 r (kms) 140 180 3 5 7 9 11 ln((A S \A C ) r) 0.5-1.5 Hz S =168 Q 2060100 r (kms) 140 180 3 5 7 9 11 ln((A S \A C ) r) 2-5Hz Q S =919 2060100 r (kms) 140 180 3 5 7 9 11 ln((A S \A C ) r) 10 Q -15Hz S =1727 2060100 140 180 r (kms) 1 3 5 7 9 ln((A P \A C ) r) 0.5-1.5Hz Q P =94 2060100 140 180 r (kms) 1 3 5 7 9 ln((A P \A C )r) 12-24Hz Q P =1893 2060100 r (kms) 140 180 3 5 7 9 11 ln((A S \A C )r) 12 Q -24Hz S =2694 Figure 2. Plots of coda normalized peak amplitude decay of P- and S-waves with hypocentral distance for the six frequency bands along with least-square be st fitte d line for P TK station. Copyright © 2012 SciRes. IJG  I. A. PARVEZ ET AL. 185 100 120 140 160 180 200 220 r (kms) 2 4 6 8 10 ln((A P \A C ) r) 0.5-1.5Hz Q P =68 100 120 140 160 1 r (kms) 80 200 220 3 5 7 9 11 ln((A S \A C ) r) 0.5-1.5Hz S =122 Q 100 120 140 160 180 200 220 r (kms) 2 4 6 8 10 ln((A P \A C ) r) 1-3Hz Q P =132 100 120 140 160 1 r (kms) 80 200 220 3 5 7 9 11 ln((A S \A C ) r) 1-3Hz Q S =409 100 120 140 160 180 200 220 r (kms) 2 4 6 8 10 ln((A P \A C ) r) 2-5Hz Q P =323 100 120 140 160 1 r (kms) 80 200 220 3 5 7 9 11 ln((A S \A C ) r) 2-5Hz Q S =551 100 120 140 160 180 200 220 r (kms) 2 4 6 8 10 ln((A P \A C ) r) 5-10Hz Q P =647 100 120 140 160 1 r (kms) 80 200 220 3 5 7 9 11 ln((A S \A C ) r) 5-10Hz S =1124 Q 100 120 140 160 180 200 220 r (kms) 2 4 6 8 10 ln((A P \A C ) r) 10-15Hz Q P =1075 100 120 140 160 1 r (kms) 80 200 220 3 5 7 9 11 ln((A S \A C ) r) 10-15Hz S =1764 Q 100 120 140 160 r (kms) 180 200 220 3 5 7 9 11 ln(A S \A C )r) 12-24Hz S =2155 Q 100 120 140 160 180 200 220 r (kms) 2 4 6 8 10 ln((A P \A C )r) 12-24Hz Q P =1783 Figure 3. Plots of coda normalized peak amplitude decay of P- and S-waves with hypocentral distance for the six frequency bands along with least-square be st fitte d line for ASR station. Copyright © 2012 SciRes. IJG 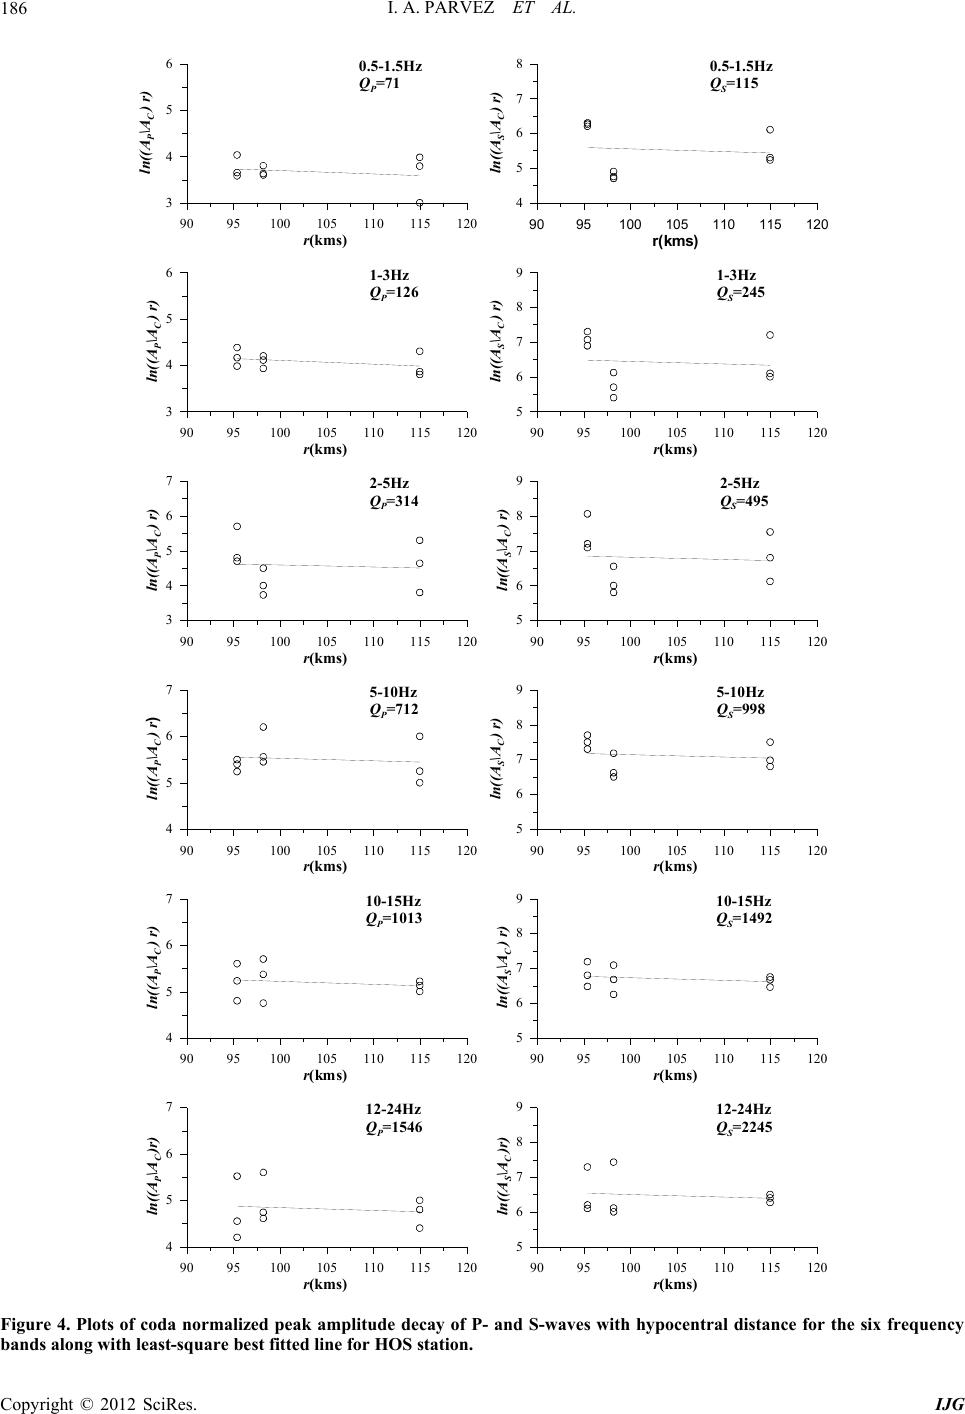 I. A. PARVEZ ET AL. 186 9095100105 110 115 120 r (kms) 3 4 5 6 ln((A P \A C ) r) 1-3Hz Q P =126 9095100 105 r (kms) 110 115 120 5 6 7 8 9 ln((A S \A C ) r) 1-3Hz Q S =245 9095100105 110 115 120 r (kms) 3 4 5 6 7 ln((A P \A C ) r) 2-5Hz Q P =314 9095100 105 r (kms) 110 115 120 5 6 7 8 9 ln((A S \A C ) r) 2-5Hz Q S =495 9095100105 110 115 120 r (kms) 4 5 6 7 ln((A P \A C ) r ) 5-10Hz Q P =712 9095100105 110 115 120 r (kms) 4 5 6 7 ln((A P \A C ) r) 10-15Hz Q P =1013 9095100 105 r (kms) 110 115 120 5 6 7 8 9 ln((A S \A C ) r) 10-15Hz Q S =1492 9095100 105 r (kms) 110 115 120 5 6 7 8 9 ln((A S \A C ) r) 5-10Hz Q S =998 9095100105 110 115 120 r (kms) 3 4 5 6 ln((A P \A C ) r) 0.5-1.5Hz Q P =71 9095100 105 r(kms) 110 115 120 4 5 6 7 8 ln((A S \A C ) r) 0. Q 5-1.5Hz S =115 9095100105 110 115 120 r (kms) 4 5 6 7 ln((A P \A C )r) 12-24Hz Q P =1546 9095100 105 r (kms) 110 115 120 5 6 7 8 9 ln((A S \A C )r) 12-24Hz Q S =2245 Figure 4. Plots of coda normalized peak amplitude decay of P- and S-waves with hypocentral distance for the six frequency bands along with least-square be st fitte d line for HOS station. Copyright © 2012 SciRes. IJG 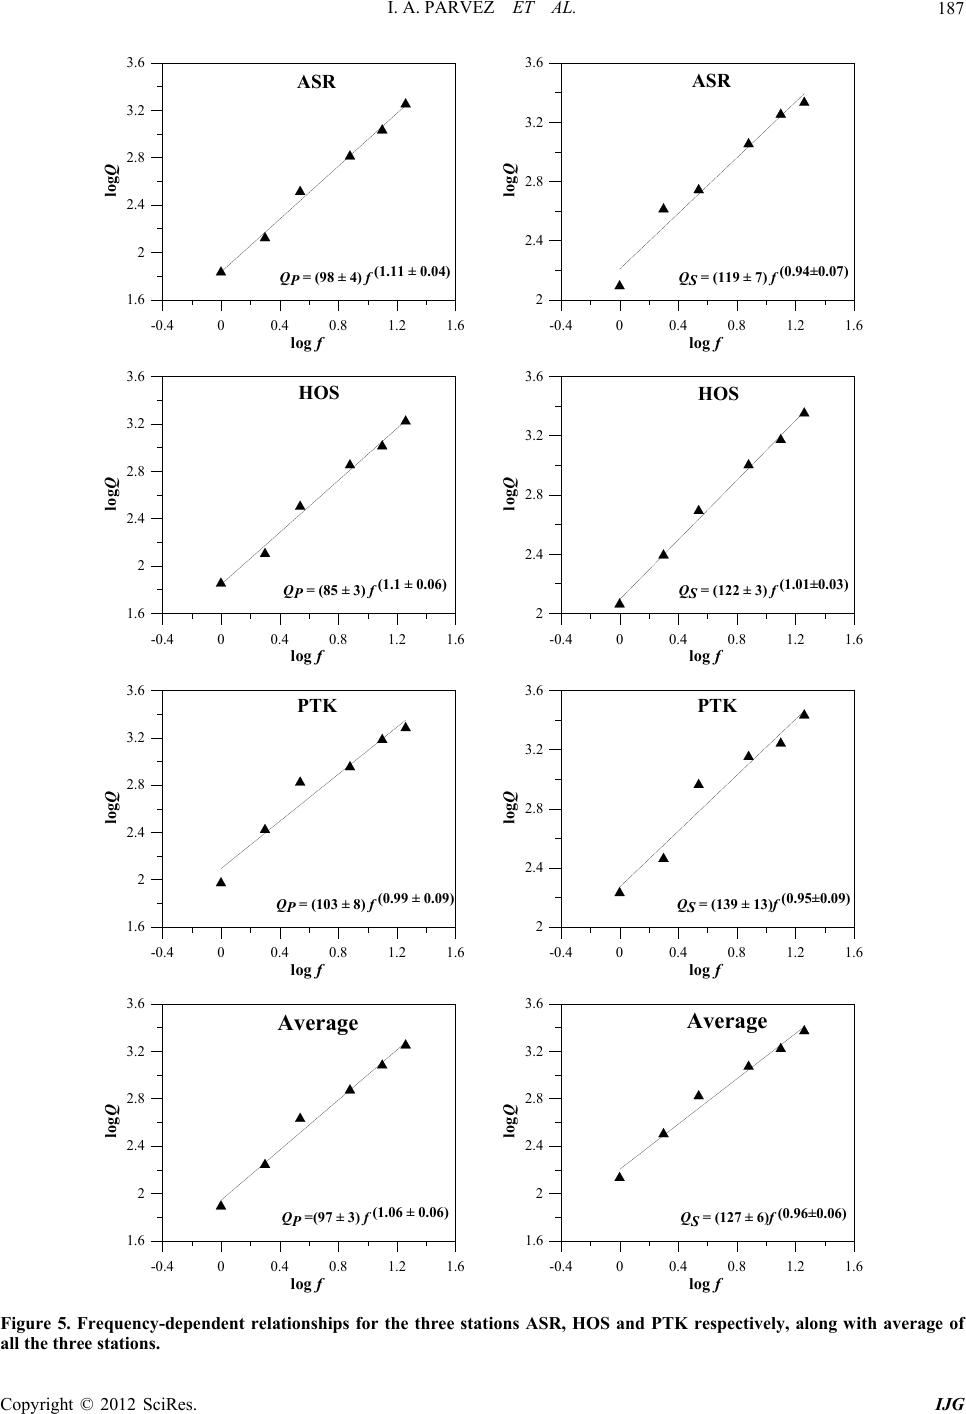 I. A. PARVEZ ET AL. 187 -0.400.4 0.8 1.2 1.6 log f 1.6 2 2.4 2.8 3.2 3.6 log Q QP = (98 ± 4) f (1.11 ± 0.04) -0.400.4 0.8 log f 1.2 1.6 2 2.4 2.8 3.2 3.6 log Q QS = (119 ± 7) f (0.94±0.07) -0.400.4 0.8 1.2 1.6 log f 1.6 2 2.4 2.8 3.2 3.6 log Q QP = (85 ± 3) f (1.1 ± 0.06) -0.400.4 0.8 log f 1.2 1.6 2 2.4 2.8 3.2 3.6 log Q QS = (122 ± 3) f (1.01±0.03) -0.400.4 0.8 1.2 1.6 log f 1.6 2 2.4 2.8 3.2 3.6 log Q QP = (103 ± 8) f (0.99 ± 0.09) -0.400.4 0.8 log f 1.2 1.6 2 2.4 2.8 3.2 3.6 log Q QS = (139 ± ASR PTK PTK HOS HOS ASR 13) f (0.95±0.09) -0.400.4 0.8 1.2 1.6 log f 1.6 2 2.4 2.8 3.2 3.6 log Q QP =(97 ± 3) f (1.06 ± 0.06) -0.400.4 0.8 log f 1.2 1.6 1.6 2 2.4 2.8 3.2 3.6 log Q QS = (127 ± Average Average 6) f (0.96±0.06) Figure 5. Frequency-dependent relationships for the three stations ASR, HOS and PTK respectively, along with average of all the three stations. Copyright © 2012 SciRes. IJG 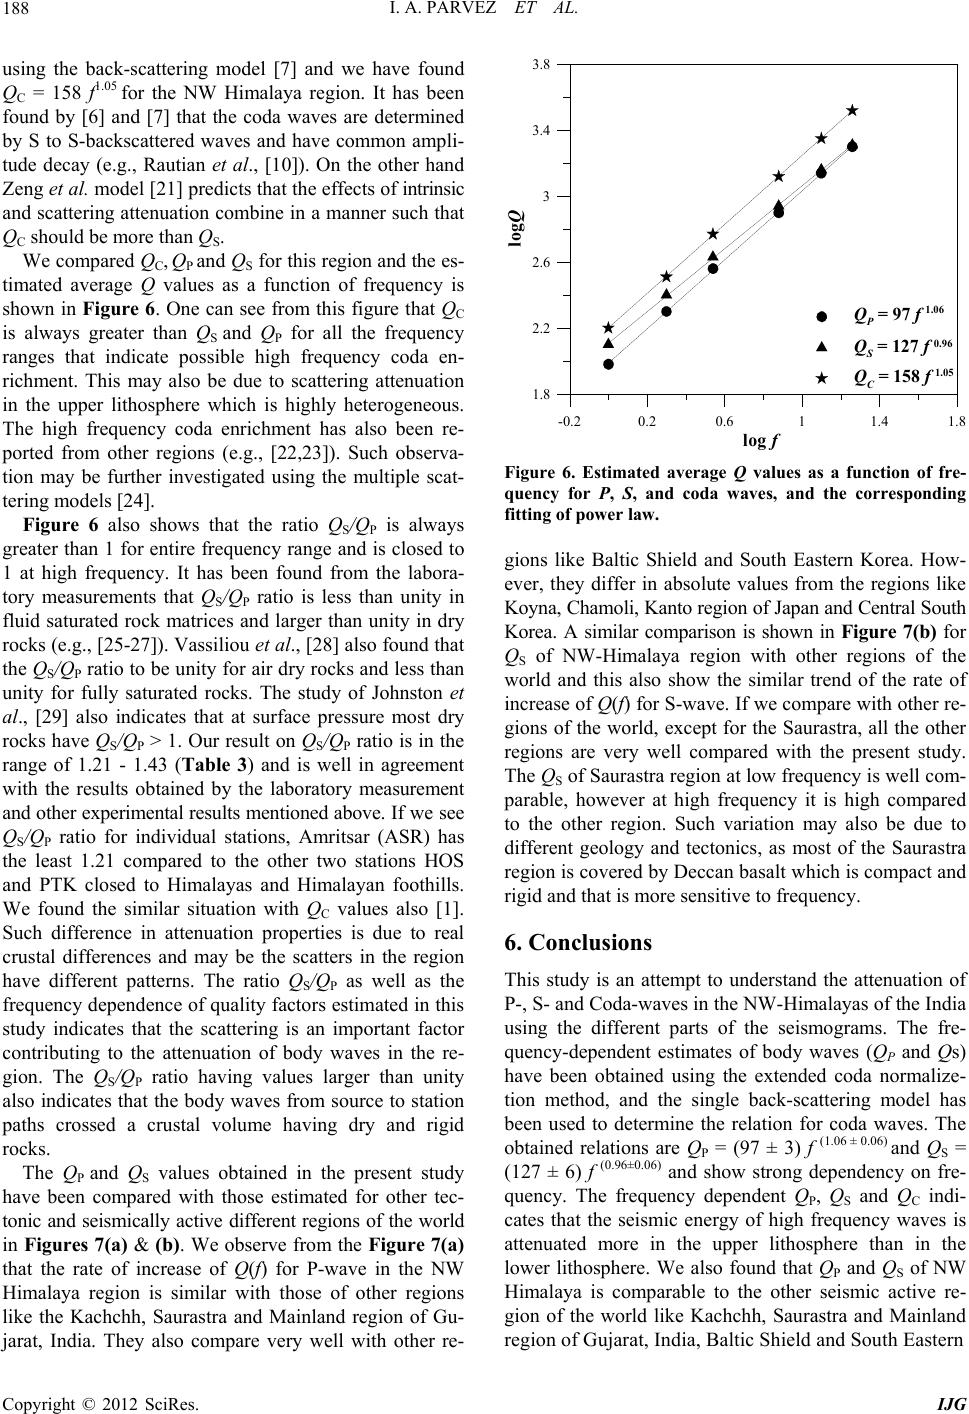 I. A. PARVEZ ET AL. IJG 188 1.8 2.2 2.6 3 3.4 3.8 log Q using the back-scattering model [7] and we have found QC = 158 f1.05 for the NW Himalaya region. It has been found by [6] and [7] that the coda waves are determined by S to S-backscattered waves and have common ampli- tude decay (e.g., Rautian et al., [10]). On the other hand Zeng et al. model [21] predicts that the effects of intrinsic and scattering attenuation combine in a manner such that QC should be more than QS. Copyright © 2012 SciRes. We compared QC, QP and QS for this region and the es- timated average Q values as a function of frequency is shown in Figure 6. One can see from this figure that QC is always greater than QS and QP for all the frequency ranges that indicate possible high frequency coda en- richment. This may also be due to scattering attenuation in the upper lithosphere which is highly heterogeneous. The high frequency coda enrichment has also been re- ported from other regions (e.g., [22,23]). Such observa- tion may be further investigated using the multiple scat- tering models [24]. Figure 6 also shows that the ratio Q S/QP is always greater than 1 for entire frequency range and is closed to 1 at high frequency. It has been found from the labora- tory measurements that QS/QP ratio is less than unity in fluid saturated rock matrices and larger than unity in dry rocks (e.g., [25-27]). Vassiliou et al., [28] also found that the QS/QP ratio to be unity for air dry rocks and less than unity for fully saturated rocks. The study of Johnston et al., [29] also indicates that at surface pressure most dry rocks have QS/QP > 1. Our result on QS/QP ratio is in the range of 1.21 - 1.43 (Table 3) and is well in agreement with the results obtained by the laboratory measurement and other experimental results mentioned above. If we see QS/QP ratio for individual stations, Amritsar (ASR) has the least 1.21 compared to the other two stations HOS and PTK closed to Himalayas and Himalayan foothills. We found the similar situation with QC values also [1]. Such difference in attenuation properties is due to real crustal differences and may be the scatters in the region have different patterns. The ratio QS/QP as well as the frequency dependence of quality factors estimated in this study indicates that the scattering is an important factor contributing to the attenuation of body waves in the re- gion. The QS/QP ratio having values larger than unity also indicates that the body waves from source to station paths crossed a crustal volume having dry and rigid rocks. The QP and QS values obtained in the present study have been compared with those estimated for other tec- tonic and seismically active different regions of the world in Figures 7(a) & (b). We observe from the Figure 7(a) that the rate of increase of Q(f) for P-wave in the NW Himalaya region is similar with those of other regions like the Kachchh, Saurastra and Mainland region of Gu- jarat, India. They also compare very well with other re- Q P = 97 f 1.06 Q S = 127 f 0.96 Q C = 158 f 1.05 -0.20.2 0.611.4 1.8 log f Figure 6. Estimated average Q values as a function of fre- quency for P, S, and coda waves, and the corresponding fitting of power law. gions like Baltic Shield and South Eastern Korea. How- ever, they differ in absolute values from the regions like Koyna, Chamoli, Kanto region of Japan and Central South Korea. A similar comparison is shown in Figure 7(b) for QS of NW-Himalaya region with other regions of the world and this also show the similar trend of the rate of increase of Q(f) for S-wave. If we compare with other re- gions of the world, except for the Saurastra, all the other regions are very well compared with the present study. The QS of Saurastra region at low frequency is well com- parable, however at high frequency it is high compared to the other region. Such variation may also be due to different geology and tectonics, as most of the Saurastra region is covered by Deccan basalt which is compact and rigid and that is more sensitive to frequency. 6. Conclusions This study is an attempt to understand the attenuation of P-, S- and Coda-waves in the NW-Himalayas of the India using the different parts of the seismograms. The fre- quency-dependent estimates of body waves (QP and Qs) have been obtained using the extended coda normalize- tion method, and the single back-scattering model has been used to determine the relation for coda waves. The obtained relations are QP = (97 ± 3) f (1.06 ± 0.06) and QS = (127 ± 6) f (0.96±0.06) and show strong dependency on fre- quency. The frequency dependent QP, QS and QC indi- cates that the seismic energy of high frequency waves is attenuated more in the upper lithosphere than in the lower lithosphere. We also found that QP and QS of NW Himalaya is comparable to the other seismic active re- gion of the world like Kachchh, Saurastra and Mainland region of Gujarat, India, Baltic Shield and South Eastern 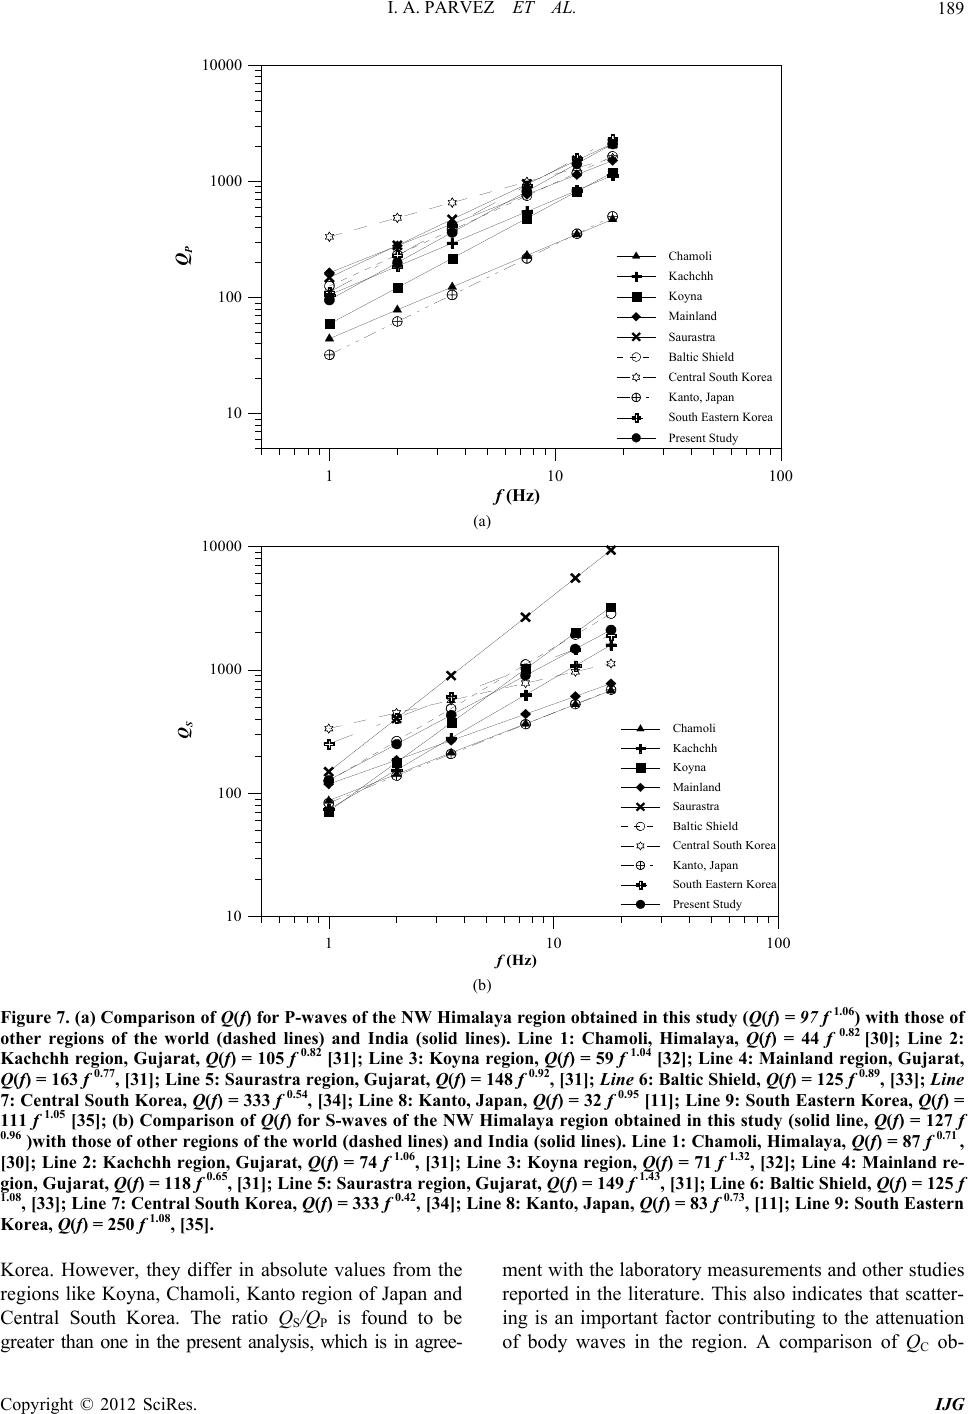 I. A. PARVEZ ET AL. 189 1 10 f (Hz) 100 10 100 1000 10000 Q P Cham oli Kachchh Koyna Mainland Saurastra Baltic Shield Central South Korea Kanto, Japan South Eastern Korea Present Study (a) 1 10 f (Hz) 100 10 100 1000 10000 Q S Chamoli Kachchh Koyna Mainland Saurastra Baltic Shield Central South Korea Kanto, Japan South Eastern Korea Present Study (b) Figure 7. (a) Comparison of Q(f) for P-waves of the NW Himalaya region obtained in this study (Q(f) = 97 f 1.06) with those of other regions of the world (dashed lines) and India (solid lines). Line 1: Chamoli, Himalaya, Q(f) = 44 f 0.82 [30]; Line 2: Kachchh region, Gujarat, Q(f) = 105 f 0.82 [31]; Line 3: Koyna region, Q(f) = 59 f 1.04 [32]; Line 4: Mainland region, Gujarat, Q(f) = 163 f 0.77, [31]; Line 5: Saurastra region, Gujarat, Q(f) = 148 f 0.92, [31]; Line 6: Baltic Shield, Q(f) = 125 f 0.89, [33]; Line 7: Central South Korea, Q(f) = 333 f 0.54, [34]; Line 8: Kanto, Japan, Q(f) = 32 f 0.95 [11]; Line 9: South Eastern Korea, Q(f) = 111 f 1.05 [35]; (b) Comparison of Q(f) for S-waves of the NW Himalaya region obtained in this study (solid line, Q(f) = 127 f 0.96 )with those of other regions of the world (dashed lines) and India (solid lines). Line 1: Chamoli, Himalaya, Q(f) = 87 f 0.71 , [30]; Line 2: Kachchh region, Gujarat, Q(f) = 74 f 1.06, [31]; Line 3: Koyna region, Q(f) = 71 f 1.32, [32]; Line 4: Mainland re- gion, Gujarat, Q(f) = 118 f 0.65, [31]; Line 5: Saurastra region, Gujarat, Q(f) = 149 f 1.43, [31]; Line 6: Baltic Shield, Q(f) = 125 f 1.08, [33]; Line 7: Central South Korea, Q(f) = 333 f 0.42, [34]; Line 8: Kanto, Japan, Q(f) = 83 f 0.73, [11]; Line 9: South Eastern Korea, Q(f) = 250 f 1.08, [35]. Korea. However, they differ in absolute values from the regions like Koyna, Chamoli, Kanto region of Japan and Central South Korea. The ratio QS/QP is found to be greater than one in the present analysis, which is in agree- ment with the laboratory measurements and other studies reported in the literature. This also indicates that scatter- ing is an important factor contributing to the attenuation of body waves in the region. A comparison of QC ob- Copyright © 2012 SciRes. IJG  I. A. PARVEZ ET AL. 190 tained by [1] and QS obtained in the present study show that QS < QC for all the frequency ranges reflecting the enrichment of coda waves which suggests the importance of scattering attenuation to the attenuation of S waves in the region. The attenuation parameters obtained in this study are useful for the estimation of source parameters and simulation of earthquake ground motions in the re- gion which is needed to assess the seismic hazard in the region of NW Himalaya, India. 7. Acknowledgements The authors are thankful to Naresh Kumar and H. S. Virk for providing the micro-earthquake data. We are also thankful to SIC, C-MMACS for his permission and to provide the facilities to complete this work. We also thank the Department of Science and Technology, Government of India to provide the fellowship to Preeti under DST project R-0-156. REFERENCES [1] N. Kumar, I. A. Parvez and H. S. Virk, “Estimation of Coda Wave Attenuation for NW Himalayan Region Us- ing Local Earthquakes,” Physics of the Earth and Plane- tary Interiors, Vol. 151, No. 3-4, 2005, pp. 243-258. doi:10.1016/j.pepi.2005.03.010 [2] H. Sato, “Thermal Structure of the Mantle Wedge beneath Northeastern Japan: Magmatism in an Island Arc from the Combined Data of Seismic Anelasticity and Velocity and Heat Flow,” Journal of Volcanology and Geothermal Re- search, Vol. 51, No. 3, 1992, pp. 237-252. doi:10.1016/0377-0273(92)90125-W [3] K. Aki, “Attenuation of Shear Waves in the Lithosphere for Frequencies from 0.05 to 2 Hz,” Physics of the Earth and Planetary Interiors, Vol. 21, 1980, pp. 50-60. doi:10.1016/0031-9201(80)90019-9 [4] L. Knopoff, “Q,” Reviews of Geophysics, Vol. 2, No. 4, 1964, pp. 625-660. doi:10.1029/RG002i004p00625 [5] B. J. Mitchell, “Regional Variation and Frequency De- pendence of QNL in the Crust of the United States,” Bulle- tin of the Seismological Society of America, Vol. 71, 1981, pp. 1531-1538. [6] K. Aki, “Analysis of Seismic Coda of Local Earthquakes as Scattered Waves,” Journal of Geophysical Research, Vol. 74, No. 2, 1969, pp. 615-631. doi:10.1029/JB074i002p00615 [7] K. Aki and B. Chouet, “Origin of the Coda Waves: Source Attenuation and Scattering Effects,” Journal of Geophy- sical Research, Vol. 80, No. 23, 1975, pp. 3322-3342. doi:10.1029/JB080i023p03322 [8] R. Hermann, “Q Estimates Using Coda of Local Earth- quakes,” Bulletin of the Seismological Society of America, Vol. 70, No. 2, 1980, pp. 447-468. [9] B. J. Mitchell, “Anelastic Structure and Evolution of the Continental Crust and Upper Mantle from Seismic Sur- face Wave Attenuation,” Reviews of Geophysics, Vol. 33, No. 4, 1995, pp. 441-462. doi:10.1029/95RG02074 [10] T. G. Rautian, V. I. Khalturin, V. G. Martynov and P. Molnar, “Preliminary Analysis of the Spectral Content of P and S-Waves from Local Earthquakes in the Garm, Tadjikista Region,” Bulletin of the Seismological Society of America, Vol. 68, 1978, pp. 949-971. [11] K. Yoshimoto, H. Sato and M. Ohtake, “Frequency De- pendent Attenuation of P and S-Waves in the Kanto Area, Japan, Based on the Coda Normalization Method,” Geo- physical Journal International, Vol. 114, No. 1, 1993, pp. 165-174. doi:10.1111/j.1365-246X.1993.tb01476.x [12] S. W. Roecker, B. Tucker, J. King and D. Hatzfeld, “Es- timates of Q in Central Asia as a Function of Frequency and Depth Using the Coda of Locally Recorded Earth- quakes,” Bulletin of the Seismological Society of America, Vol. 72, No. 1, 1982, pp. 129-149. [13] J. J. Pulli, “Attenuation in New England,” Bulletin of the Seismological Society of America, Vol. 74, No. 4, 1984, pp. 1149-1166. [14] S. Rhea, “Q Determined from Local Earthquakes in South Carolina Coastal Plain,” Bulletin of the Seismological So- ciety of America, Vol. 74, No. 6, 1984, pp. 2257-2268. [15] J. M. Ibanez, E. Del Pezzo, F. De Miguel, M. Herraiz, G. Alguacil and J. Morales, “Depth Dependent Seismic Atte- nuation in the Granada Zone (Southern Spain),” Bulletin of the Seismological Society of America, Vol. 80, No. 5, 1990, pp. 1222-1234. [16] A. Akinci, A. G. Taktak and S. Ergintav, “Attenuation of Coda Waves in Western Anatolia,” Physics of the Earth and Planetary Interiors, Vol. 87, No. 1-2, 1994, pp. 155- 165. doi:10.1016/0031-9201(94)90028-0 [17] S. C. Gupta, V. N. Singh and A. Kumar, “Attenuation of Coda Waves in the Garhwal Himalaya, India,” Physics of the Earth and Planetary Interiors, Vol. 87, No. 3-4, 1995, pp. 247-253. doi:10.1016/0031-9201(94)02968-H [18] J. Ni and M. Barazangi, “Seismotectonics of the Himala- yan Collision Zone: Geometry of the Underthrusting In- dian Plate beneath the Himalayas,” Journal of Geophysi- cal Research, Vol. 89, No. B2, 1984, pp. 1147-1163. doi:10.1029/JB089iB02p01147 [19] P. Molnar, “A Review of the Seismicity and the Rates of Active under Thrusting and Deformation at the Hima- laya,” Journal of Himalayan Geology, Vol. 1, No. 2, 1990, pp. 131-154. [20] P. Molnar, B. E. Tucker and J. N. Brune, “Corner Fre- quencies of P- and S-Waves and Models of Earthquake Sources,” Bulletin of the Seismological Society of Amer- ica, Vol. 63, No. 6, 1973, pp. 2091-2104. [21] Y. Zeng, F. Su and K. Aki, “Scattered Wave Energy Pro- pagation in a Random Isotropic Scattering Medium, I. Theory,” Journal of Geophysical Research, Vol. 96, No. B1, 1991, pp. 607-619. doi:10.1029/90JB02012 [22] A. Frankel, “Mechanisms of Seismic Attenuation in the Crust: Scattering and Anelasticity in New York State, South Africa, and Southern California,” Journal of Geophysical Research, Vol. 96, 1991, pp. 6269-6289. doi:10.1029/91JB00192 [23] G. Sarkar and A. Abers, “Comparison of Seismic Body Wave and Coda Wave Measures of Q,” Pure and Applied Copyright © 2012 SciRes. IJG  I. A. PARVEZ ET AL. Copyright © 2012 SciRes. IJG 191 Geophysics, Vol. 153, No. 2-4, 1998, pp. 665-683. doi:10.1007/s000240050213 [24] M. Hoshiba, “Simulation of Multiple Scattered Coda Wave Excitation Based on the Energy Conservation Law,” Phy- sics of the Earth and Planetary Interior, Vol. 67, No. 1-2, 1991, pp. 123-136. doi:10.1016/0031-9201(91)90066-Q [25] M. N. Toksoz, A. H. Johnston and A. Timur, “Attenua- tion of Seismic Waves in Dry and Saturated Rocks-I La- boratory Measurements,” Geophysics, Vol. 44, No. 1, 1979, pp. 681-690. doi:10.1190/1.1440969 [26] S. Mochizuki, “Attenuation in Partially Saturated Rocks,” Journal of Geophysical Research, Vol. 87, No. B10, 1982, pp. 8598-8604. doi:10.1029/JB087iB10p08598 [27] K. W. Winkler and A. Nur, “Seismic Attenuation Effects of Pore Fluids and Frictional Sliding,” Geophysics, Vol. 47, No. 1, 1982, pp. 1-15. doi:10.1190/1.1441276 [28] M. Vassiliou, C. A. Salvado and B. R. Tittmann, “Seis- mic Attenuation,” In: R. S. Carmichael, Ed., CRC Hand- book of Physical Properties of Rocks, Vol. 3, CRC Press, Boca Raton, 1982. [29] D. H. Johnston, M. N. Toksoz and A. Timur, “Attenua- tion of Seismic Waves in Dry and Saturated Rocks: I,” Mechanics in Geophysics, Vol. 44, 1979, pp. 691-711. doi:10.1190/1.1440970 [30] B. Sharma, S. S. Teotia, D. Kumar and P. S. Raju, “At- tenuation of P and S-Waves in the Chamoli Region, Hi- malaya, India,” Pure and Applied Geophysics, Vol. 166, No. 12, 2009, pp. 1949-1966. doi:10.1007/s00024-009-0527-9 [31] S. Chopra, B. K. Rastogi and D. Kumar, “Attenuation of High Frequency P- and S-Waves in the Gujarat Region, India,” Pure and Applied Geop hysic s, Vol. 168, No. 5, 2010, pp. 797-781. doi:10.1007/s00024-010-0143-8 [32] B. Sharma, S. S. Teotia and D. Kumar, “Attenuation of P, S and Coda-Waves in Koyna Region, India,” Journal of Seismology, Vol. 11, No. 3, 2007, pp. 327-344. doi:10.1007/s10950-007-9057-z [33] L. B. Kvamme and J. Havskov, “Q in Southern Norway,” Bulletin of the Seismological Society of America, Vol. 79, No. 5, 1989, pp. 1575-1588. [34] K. D. Kim, T. W. Chung and J. B. Kyung, “Attenuation of High Frequency P- and S-Waves in the Crust of Choong- chung Provinces, Central South Korea,” Bulletin of the Seismological Society of America, Vol. 94, No. 3, 2004, pp. 1070-1078. doi:10.1785/0120030137 [35] T. W. Chung and H. Sato, “Attenuation of High Frequency P- and S-Waves in the Crust of Southeastern South Ko- rea,” Bulletin of the Seismological Society of America, Vol. 91, 2001, pp. 1867-1874. doi:10.1785/0120000268
|