S. CHAKRABORTY ET AL. 45
ing radiosonde data have to rely on a relative humidity
(RH) threshold. When RH exceeds a threshold value
cloud layers are supposed to be formed. In another ap-
proach it is assumed that each of the cloud layers satis-
fies the following equations.
2
2
dT 0
dz (1)
2
2
dRH 0
dz
(2)
where T denotes temperature [7]. Here saturation region
is taken as region of RH maximum and a region of
weaker temperature decrease is considered for pseudo-
adiabatic lapse rate within the cloud. Again there is an-
other microphysical dynamic cloud model (DCM) where
convection is initialized diabatically [8]. Here humidity
and temperature profile are physically consistent with
LWC profile but the clear sky condition can not be de-
scribed by this model as the model always generates
cloud. In the present study LWC profile obtained from
Salonen’s [9] model and Karsten’s [10] model are com-
pared. Integrated value of LWC is calculated throughout
the year from the above two models and compared also
for a tropical location, Kolkata (22˚C 34N, 88˚C 29E),
for a period of three years.
2. Theoretical Basis
As cloud formation is associated with high relative
humidity, radiosonde data can indicate the presence of
cloud liquid water content depending on whether relative
humidity exceeds a critical value. According to Karsten’s
model, cloud is formed when the relative humidity
exceeds 95%. Again the phase of the water is determined
by its temperature profile. If temperature is greater than
0°C liquid water is formed. From the adiabatic concept
of thermodynamics, the cloud liquid water content (LWC)
can be calculated at each height level by the relation
add s
Cp
LWCh = ρ(z) Γ–Γdz
L
(3)
where ρ(z) = air density, Cp = specific heat at constant
pressure, L=latent heat of vaporization, Гd = dry adia-
batic lapse rate, Гs = moist adiabatic lapse rate. In the fo-
rmula of LWC, Гs varies from 4˚C/km to 9.8˚C/km
depending on the seasonal variation of temperature. The
air density is calculated from the ideal gas equation. Also
considered is Cp = 1.0035 J·g–1·k –1, L = 80 cal/gm. The
adiabatic condition gives maximum value of LWC which
is reduced due to circulation of air mass accompanied by
precipitation and freezing. The modified LWC is given by
3
ad
LWC=LWC1.239 0.145lnΔhkgm (4)
calculated at each pressure level at a particular radio-
sonde ascent. Integrating the LWC profile over height,
the total value of LWC is obtained at each ascent. Acco-
rding to Salonen’s model also when relative humidity ex-
ceeds the critical humidity, cloud is formed. But critical
humidity is calculated from Geleyn’s formula
U=1 σ1σ1+ σ0.5αβ
c
(5)
where α = 1.0, β = 3, σ is the ratio of pres
pr
sure at the
considered level andessure at the surface level [11].
Again the phase of the liquid water is determined on the
basis of temperature profile. When temperature is greater
than 0˚C, contribution of liquid water content of cloud is
significant. Liquid water content w (g/m3) as a function
of temperature t (˚C) and height hc from the base has
been calculated by the relation
a
c
0w
r
h
W=W 1+ctρt
h
(6)
where a = 1.4, c = 0.041/˚C, W0 = 0.14 gm/m3 for each
e of water vapour satura-
tio
radiosonde ascents at each pressure level. Integrating the
profile of liquid water content over height, the value of
cloud liquid water content (LWC) for each radiosonde
ascents has been obtained. The total variation of LWC is
observed throughout the year.
The temperature dependenc
n pressure esw (100% RH) is approximated and in turn,
expressed as vapour concentration,
95
v=7.223e=1.739 10θ3
wu gm/mθ (7)
where
t
300 T273θ, Tt = dry bulb temperat
3. Data
e balloon is released from a location over
4. Results
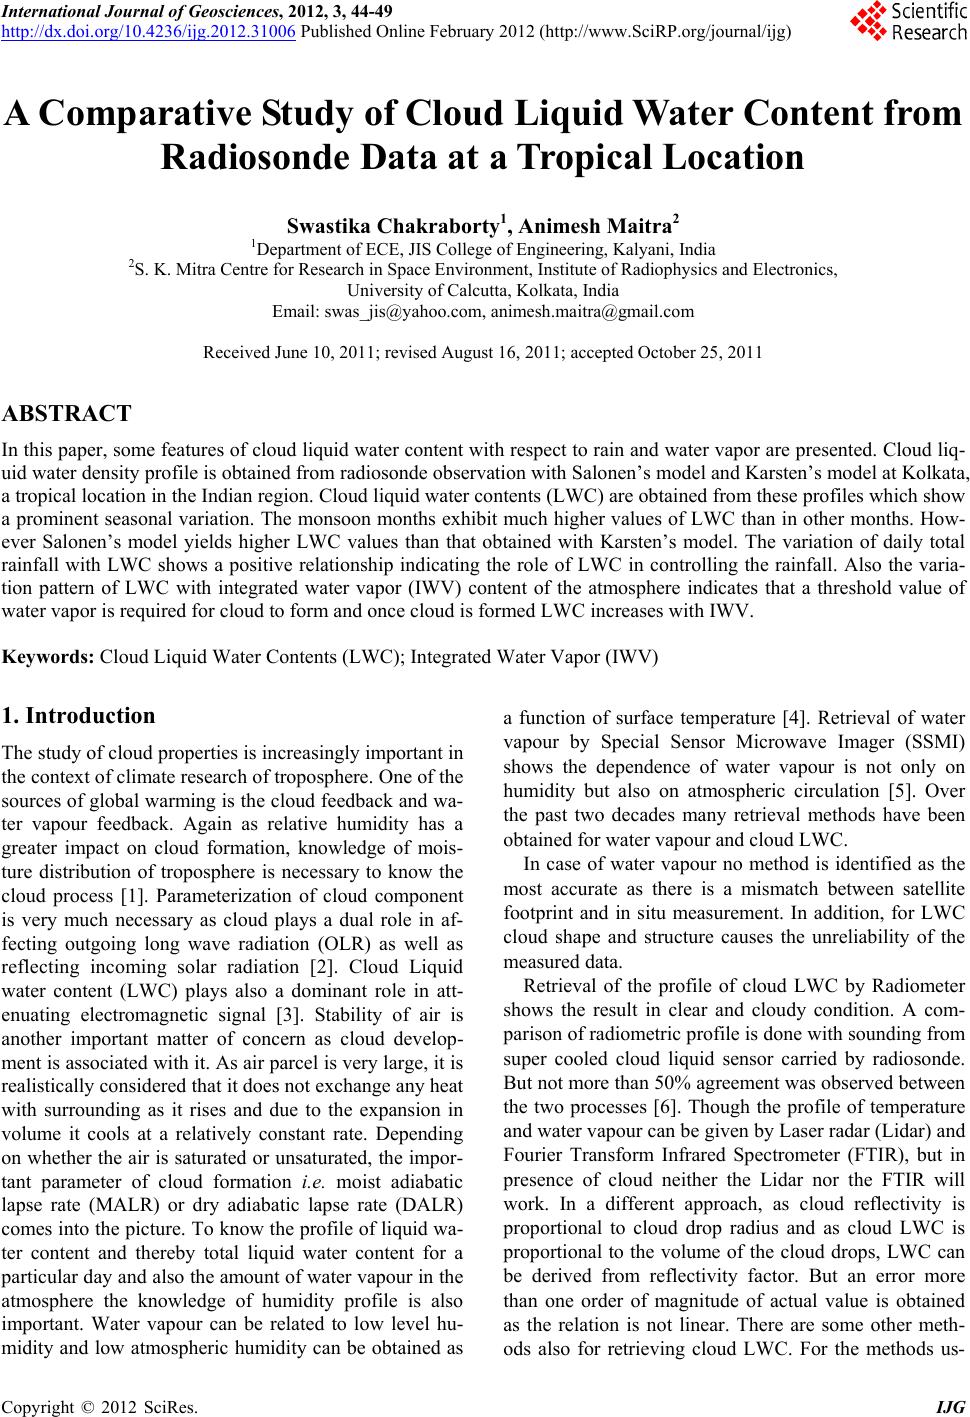
profiles of a particular day obtained using
ure.
Radiosond
which characteristics of the troposphere are desired to be
known. Radiosonde measurements are obtained twice a
day at around 00 and 12 GMT (1830 and 0630 IST) by
the Indian Meteorological Department at Kolkata, India
(22˚C 34N, 88˚C 29E). The data from the period January
to December of the year 2005 to 2007 have been used in
this study. The data of temperature, pressure and dew
point temperature at different height with a resolution of
few tens of meters to few hundreds of meters up to a
height of 15 km is measured. Temperature is measured
by the carbon rod thermistor which measures the tem-
perature from –90˚C to 60˚C with a resolution of 0.1˚C.
Pressure is measured by an aneroid barometer with a
resolution of 1 mb. Dew point temperature is obtained
from relative humidity measured by a carbon hygristor
with a resolution of 2% RH.
Cloud LWC
where Δh = height above the cloud base. LWC is then
Copyright © 2012 SciRes. IJG