Paper Menu >>
Journal Menu >>
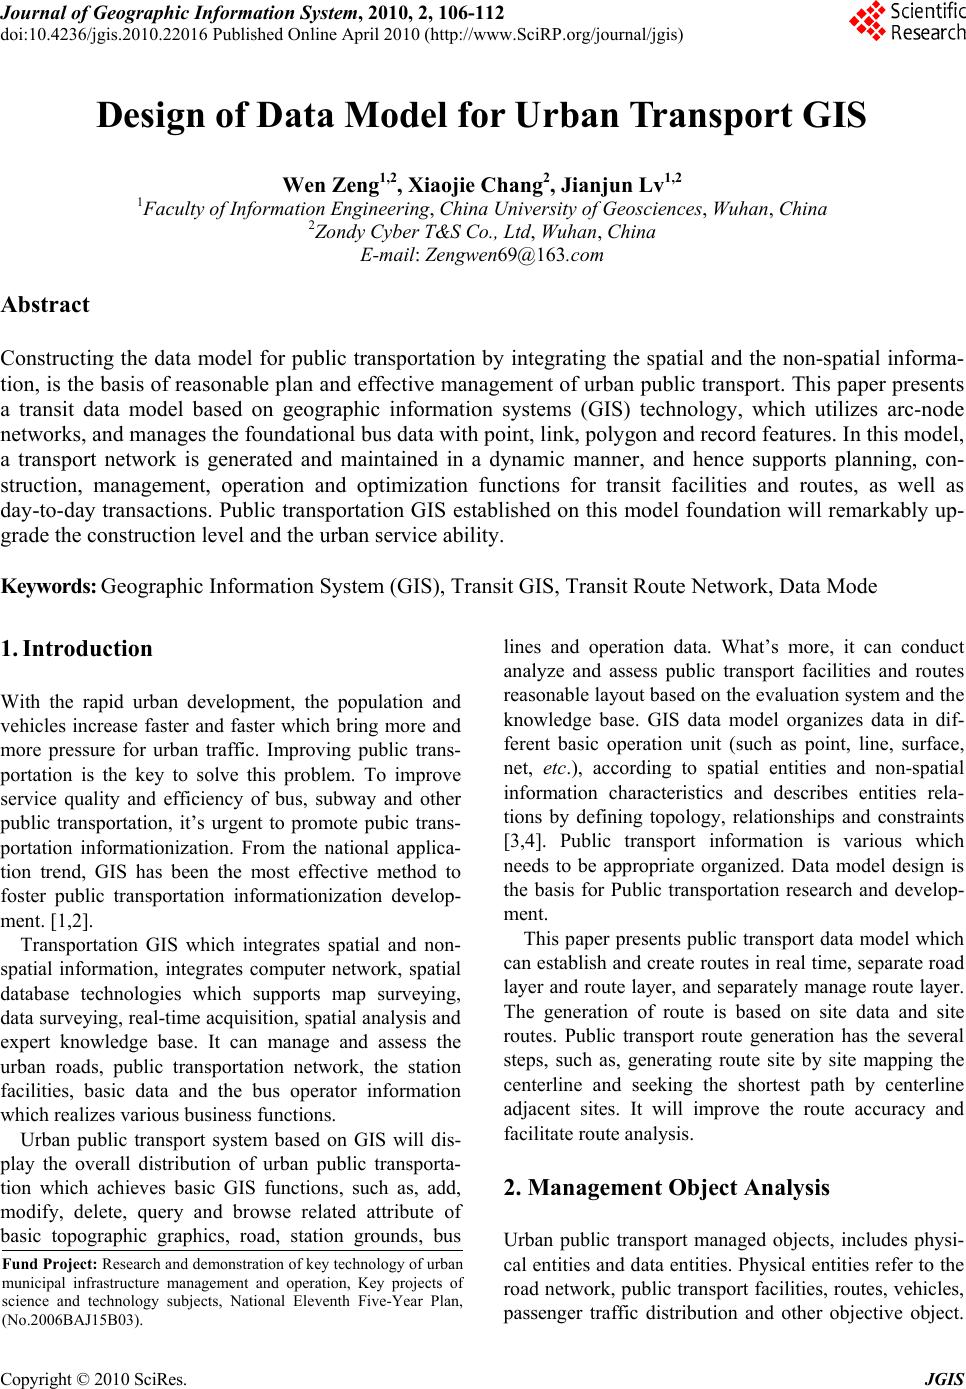 Journal of Geographic Information System, 2010, 2, 106-112 doi:10.4236/jgis.2010.22016 Published Online April 2010 (http://www.SciRP.org/journal/jgis) Copyright © 2010 SciRes. JGIS Design of Data Model for Urban Transport GIS Wen Zeng1,2, Xiaojie Chang2, Jianjun Lv1,2 1Faculty of Information Engineering, China University of Geosciences, Wuhan, China 2Zondy Cyber T&S Co., Ltd, Wuhan, China E-mail: Zengwen69@163.com Abstract Constructing the data model for public transportation by integrating the spatial and the non-spatial informa- tion, is the basis of reasonable plan and effective management of urban public transport. This paper presents a transit data model based on geographic information systems (GIS) technology, which utilizes arc-node networks, and manages the foundational bus data with point, link, polygon and record features. In this model, a transport network is generated and maintained in a dynamic manner, and hence supports planning, con- struction, management, operation and optimization functions for transit facilities and routes, as well as day-to-day transactions. Public transportation GIS established on this model foundation will remarkably up- grade the construction level and the urban service ability. Keywords: Geographic Information System (GIS), Transit GIS, Transit Route Network, Data Mode 1. Introduction With the rapid urban development, the population and vehicles increase faster and faster which bring more and more pressure for urban traffic. Improving public trans- portation is the key to solve this problem. To improve service quality and efficiency of bus, subway and other public transportation, it’s urgent to promote pubic trans- portation informationization. From the national applica- tion trend, GIS has been the most effective method to foster public transportation informationization develop- ment. [1,2]. Transportation GIS which integrates spatial and non- spatial information, integrates computer network, spatial database technologies which supports map surveying, data surveying, real-time acquisition , spatial analysis and expert knowledge base. It can manage and assess the urban roads, public transportation network, the station facilities, basic data and the bus operator information which realizes vari o us business functi o ns. Urban public transport system based on GIS will dis- play the overall distribution of urban public transporta- tion which achieves basic GIS functions, such as, add, modify, delete, query and browse related attribute of basic topographic graphics, road, station grounds, bus lines and operation data. What’s more, it can conduct analyze and assess public transport facilities and routes reasonable layout based on the evaluation system and the knowledge base. GIS data model organizes data in dif- ferent basic operation unit (such as point, line, surface, net, etc.), according to spatial entities and non-spatial information characteristics and describes entities rela- tions by defining topology, relationships and constraints [3,4]. Public transport information is various which needs to be appropriate organized. Data model design is the basis for Public transportation research and develop- ment. This paper presents public transport data mo del which can establish and create routes in real time, separate road layer and route layer, and separately manage route layer. The generation of route is based on site data and site routes. Public transport route generation has the several steps, such as, generating route site by site mapping the centerline and seeking the shortest path by centerline adjacent sites. It will improve the route accuracy and facilitate route analysis. 2. Management Object Analysis Urban public transport managed objects, includes physi- cal entities and data entities. Physical entities refer to the road network, public transport facilities, ro utes, vehicles, passenger traffic distribution and other objective object. Fund Project: Research and demonstration of key technology of urban municipal infrastructure management and operation, Key projects o f science and technology subjects, National Eleventh Five-Year Plan, (No.2006BAJ15B03). 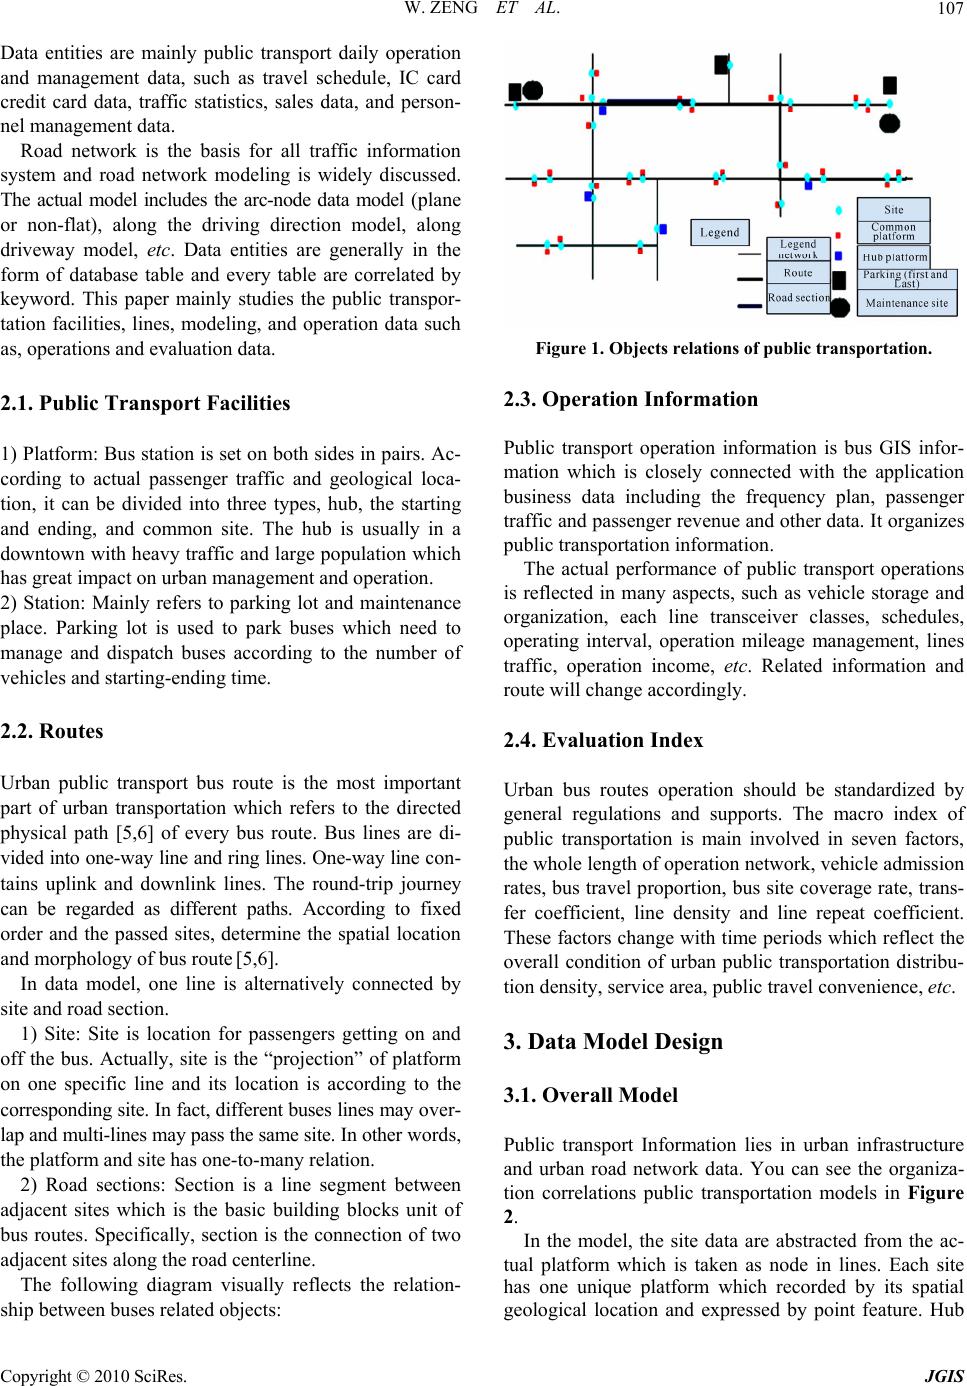 W. ZENG ET AL.107 Data entities are mainly public transport daily operation and management data, such as travel schedule, IC card credit card data, traffic statistics, sales data, and person- nel management data. Road network is the basis for all traffic information system and road network modeling is widely discussed. The actual model includes the arc-node data model (plane or non-flat), along the driving direction model, along driveway model, etc. Data entities are generally in the form of database table and every table are correlated by keyword. This paper mainly studies the public transpor- tation facilities, lines, modeling, and operation data such as, operations and eva luatio n d ata. 2.1. Public Transport Facilities 1) Platform: Bus station is set on both sides in pairs. Ac- cording to actual passenger traffic and geological loca- tion, it can be divided into three types, hub, the starting and ending, and common site. The hub is usually in a downtown with heavy traffic and large population wh ich has great impact on urban management and operation. 2) Station: Mainly refers to parking lot and maintenance place. Parking lot is used to park buses which need to manage and dispatch buses according to the number of vehicles and starting-ending time. 2.2. Routes Urban public transport bus route is the most important part of urban transportation which refers to the directed physical path [5,6] of every bus route. Bus lines are di- vided into one-way line and ring lines. One-way line con - tains uplink and downlink lines. The round-trip journey can be regarded as different paths. According to fixed order and the passed sites, determine the spatial location and morphology of bus route [5,6]. In data model, one line is alternatively connected by site and road section. 1) Site: Site is location for passengers getting on and off the bus. Actually, site is the “projection” of platform on one specific line and its location is according to the corresponding site. In fact, different buses lines may ove r- lap and multi-lines may pass the same site. In other wo rds , the platform and site has one-to-many relation. 2) Road sections: Section is a line segment between adjacent sites which is the basic building blocks unit of bus routes. Specifically, section is the connection of two adjacent sites along the road centerline. The following diagram visually reflects the relation- ship between buses related objects: Figure 1. Objects relations of public transportation. 2.3. Operation Information Public transport operation information is bus GIS infor- mation which is closely connected with the application business data including the frequency plan, passenger traffic and passenger revenue and other data. It organizes public transportation information. The actual performance of public transport operations is reflected in many aspects, such as vehicle storage and organization, each line transceiver classes, schedules, operating interval, operation mileage management, lines traffic, operation income, etc. Related information and route will change accordingly. 2.4. Evaluation Index Urban bus routes operation should be standardized by general regulations and supports. The macro index of public transportation is main involved in seven factors, the whole length of operation n etwork, veh icle admission rates, bus travel proportion, bus site coverage rate, trans- fer coefficient, line density and line repeat coefficient. These factors change with time periods which reflect the overall condition of urban public transportation distribu- tion density, service area, public travel convenience, etc. 3. Data Model Design 3.1. Overall Model Public transport Information lies in urban infrastructure and urban road network data. You can see the organiza- tion correlations public transportation models in Figure 2. In the model, the site data are abstracted from the ac- tual platform which is taken as node in lines. Each site has one unique platform which recorded by its spatial geological location and expressed by point feature. Hub Copyright © 2010 SciRes. JGIS 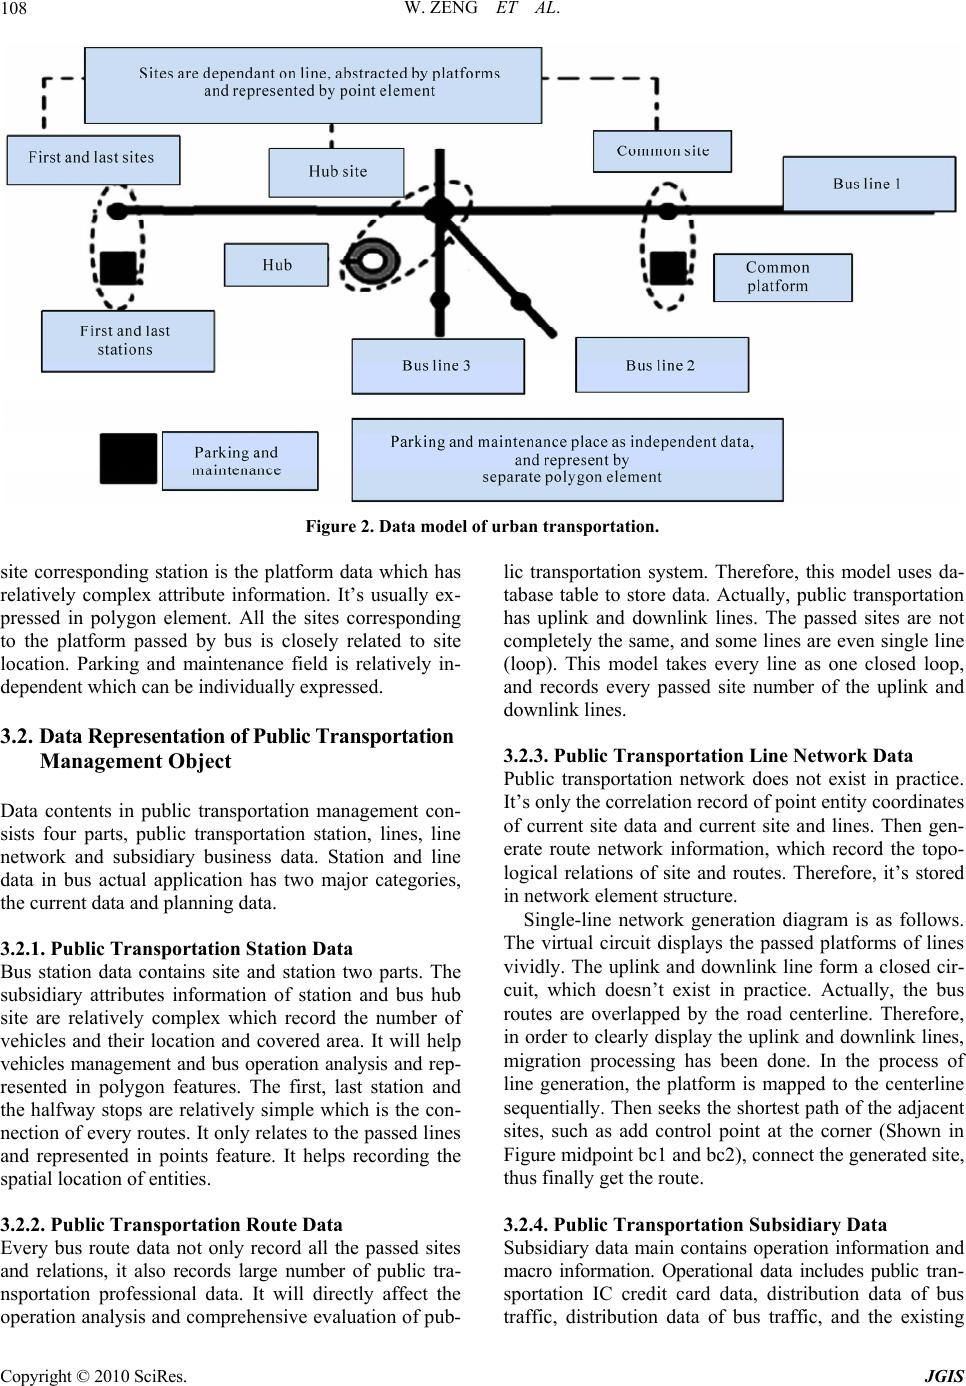 W. ZENG ET AL. Copyright © 2010 SciRes. JGIS 108 Figure 2. Data model of urban transportation. site corresponding station is the platform data which has relatively complex attribute information. It’s usually ex- pressed in polygon element. All the sites corresponding to the platform passed by bus is closely related to site location. Parking and maintenance field is relatively in- dependent which can be individually expressed. 3.2. Data Representation of Public Transportation Management Object Data contents in public transportation management con- sists four parts, public transportation station, lines, line network and subsidiary business data. Station and line data in bus actual application has two major categories, the current data an d planning da ta. 3.2.1. Publ ic Transp ortation S tation Data Bus station data contains site and station two parts. The subsidiary attributes information of station and bus hub site are relatively complex which record the number of vehicles and their location and covered area. It will help vehicles management and bus operation analysis and rep- resented in polygon features. The first, last station and the halfway stops are relatively simple which is the con- nection of every routes. It only relates to the p assed lines and represented in points feature. It helps recording the spatial location of entities. 3.2.2. Public T ransportation Route Data Every bus route data not only record all the passed sites and relations, it also records large number of public tra- nsportation professional data. It will directly affect the operation analysis and comprehensive evaluation of pub- lic transportation system. Therefore, this model uses da- tabase table to store data. Actually, public transportation has uplink and downlink lines. The passed sites are not completely the same, and some lines are even single lin e (loop). This model takes every line as one closed loop, and records every passed site number of the uplink and downlink lines. 3.2.3. Public Transportation Line Network Data Public transportation network does not exist in practice. It’s only the correlation record of point entity coord in ates of current site data and current site and lines. Then gen- erate route network information, which record the topo- logical relations of site and routes. Therefore, it’s stored in network element structure. Single-line network generation diagram is as follows. The virtual circuit displays the passed platforms of lines vividly. The uplink and downlink line form a closed cir- cuit, which doesn’t exist in practice. Actually, the bus routes are overlapped by the road centerline. Therefore, in order to clearly d isplay the uplink and downlink lines, migration processing has been done. In the process of line generation, the platform is mapped to the centerline sequentially. Then seeks the sh ortest path of the adjacent sites, such as add control point at the corner (Shown in Figure midpoint bc1 and bc2), connect the generated site, thus finally get the route. 3.2.4. Public Tr ansportation Subsidiar y Data Subsidiary data main contains operation information and macro information. Operational data includes public tran- sportation IC credit card data, distribution data of bus traffic, distribution data of bus traffic, and the existing 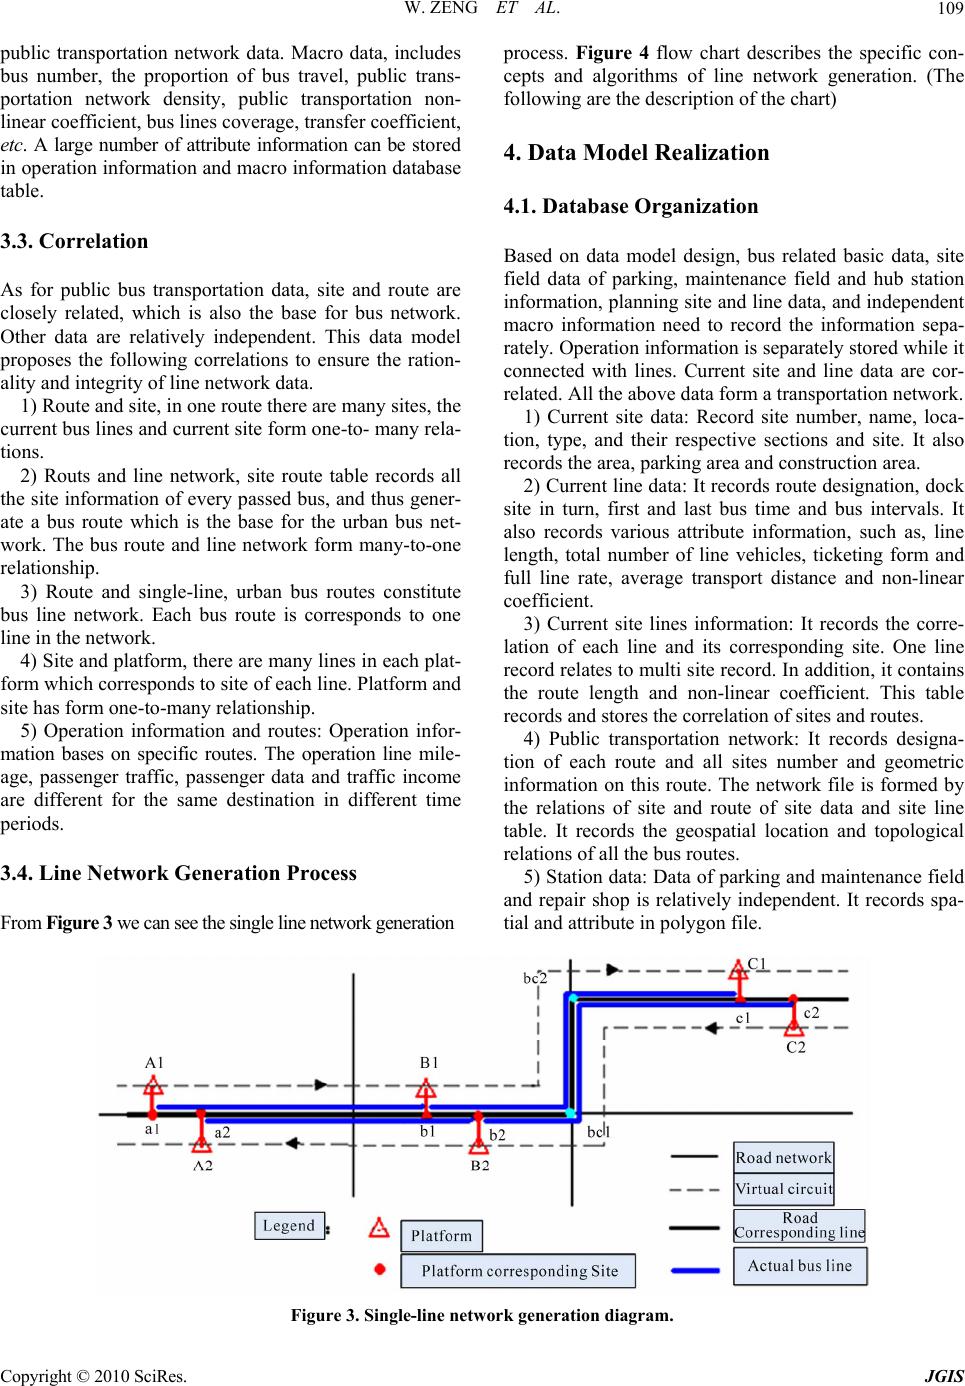 W. ZENG ET AL.109 public transportation network data. Macro data, includes bus number, the proportion of bus travel, public trans- portation network density, public transportation non- linear co ef f ic ien t, bu s lin e s cov er ag e , tr an sf er co ef f ici en t, etc. A large number of attribute information can be s tored in operation information and macro information database table. 3.3. Correlation As for public bus transportation data, site and route are closely related, which is also the base for bus network. Other data are relatively independent. This data model proposes the following correlations to ensure the ration- ality and integrity of line network data. 1) Route and site, in one route there are many sites, the current bus lines and current site form one-to- many rela- tions. 2) Routs and line network, site route table records all the site information of every passed bus, and thus gener- ate a bus route which is the base for the urban bus net- work. The bus route and line network form many-to-one relationship. 3) Route and single-line, urban bus routes constitute bus line network. Each bus route is corresponds to one line in the network. 4) Site and platform, there are many lines in each plat- form which corresponds to site of each line. Platform and site has form one-to-many relationship. 5) Operation information and routes: Operation infor- mation bases on specific routes. The operation line mile- age, passenger traffic, passenger data and traffic income are different for the same destination in different time periods. 3.4. Line Network Generation Process From Figure 3 we ca n see the single l ine network ge neration process. Figure 4 flow chart describes the specific con- cepts and algorithms of line network generation. (The following are the description of the chart) 4. Data Model Realization 4.1. Database Organization Based on data model design, bus related basic data, site field data of parking, maintenance field and hub station information, planning site and line data, and independent macro information need to record the information sepa- rately. Operation information is separately stor ed while it connected with lines. Current site and line data are cor- related. All the above data form a transportatio n network. 1) Current site data: Record site number, name, loca- tion, type, and their respective sections and site. It also records the area, parking area and construction area. 2) Current line data: It records route designation, dock site in turn, first and last bus time and bus intervals. It also records various attribute information, such as, line length, total number of line vehicles, ticketing form and full line rate, average transport distance and non-linear coefficient. 3) Current site lines information: It records the corre- lation of each line and its corresponding site. One line record relates to multi site record. In addition, it con tains the route length and non-linear coefficient. This table records and stores the correlation of sites and routes. 4) Public transportation network: It records designa- tion of each route and all sites number and geometric information on this route. The network file is formed by the relations of site and route of site data and site line table. It records the geospatial location and topological relations of all the bus routes. 5) Station data: Data of parking and maintenance field and repair shop is relatively independent. It records spa- tial and attribute in polygon file. Figure 3. Single-line networ k ge ne r a tion diagram. Copyright © 2010 SciRes. JGIS 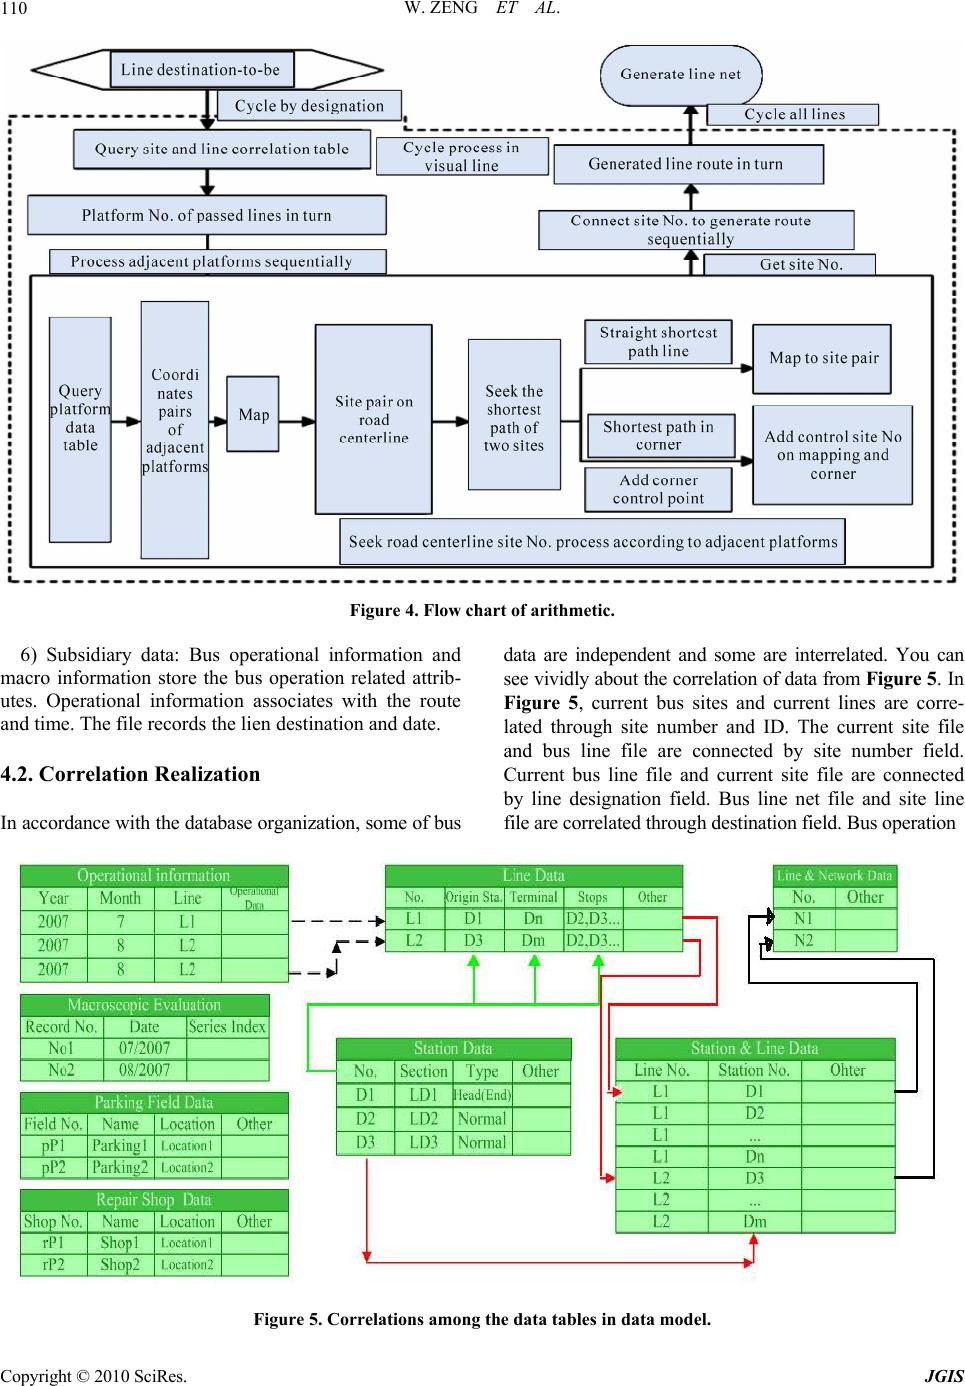 W. ZENG ET AL. 110 Figure 4. Flow chart of arithmetic. 6) Subsidiary data: Bus operational information and macro information store the bus operation related attrib- utes. Operational information associates with the route and time. The file records the lien destin ation and date. 4.2. Correlation Realization In accordance with the database organization , some of bus data are independent and some are interrelated. You can see vividly about the correlation of data from Figure 5. In Figure 5, current bus sites and current lines are corre- lated through site number and ID. The current site file and bus line file are connected by site number field. Current bus line file and current site file are connected by line designation field. Bus line net file and site line file are correlated through destinati on fiel d. Bus operati on Figure 5. Correlations among the data tables in data model. Copyright © 2010 SciRes. JGIS 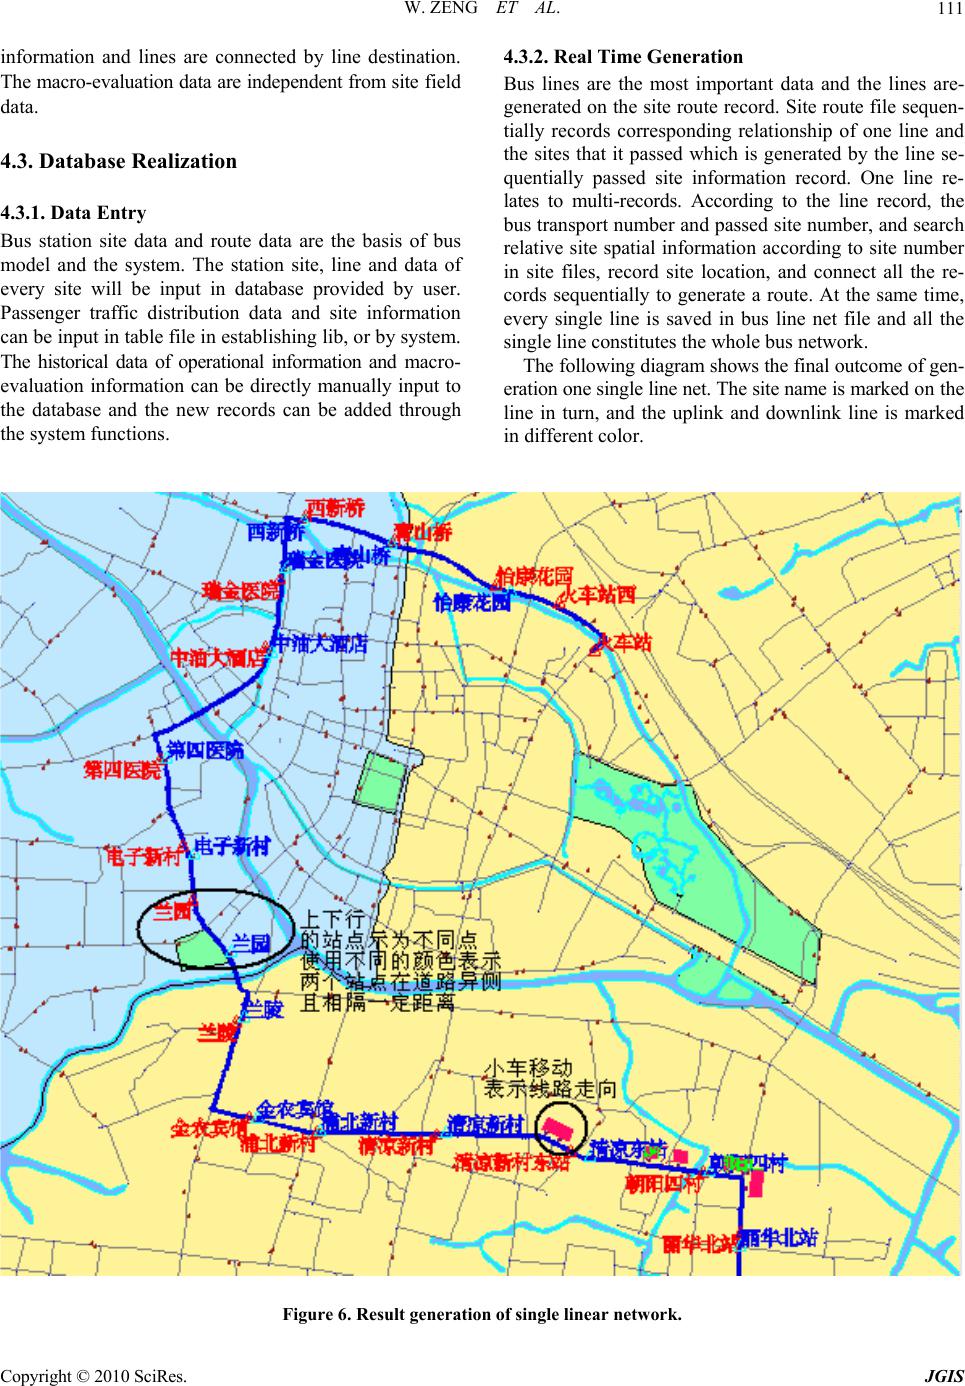 W. ZENG ET AL. Copyright © 2010 SciRes. JGIS 111 information and lines are connected by line destination. The macro-evaluation data are independent from site fie ld data. 4.3. Database Realization 4.3.1. Dat a En try Bus station site data and route data are the basis of bus model and the system. The station site, line and data of every site will be input in database provided by user. Passenger traffic distribution data and site information can be input in table file in establishing lib, or by system. The historical data of operational information and macro- evaluation information can be directly manually input to the database and the new records can be added through the system functions. 4.3.2. Real Time Generation Bus lines are the most important data and the lines are- generated on the site route record. Site ro ute file sequen- tially records corresponding relationship of one line and the sites that it passed which is generated by the line se- quentially passed site information record. One line re- lates to multi-records. According to the line record, the bus transport number and passed site number, and search relative site spatial information according to site number in site files, record site location, and connect all the re- cords sequentially to generate a route. At the same time, every single line is saved in bus line net file and all the single line constitutes th e whole bus network. The following diagram shows the final outcome of gen- eration one single line net. The site name is marked on t he line in turn, and the uplink and downlink line is marked in different color. Figure 6. Result generation of single linear network. 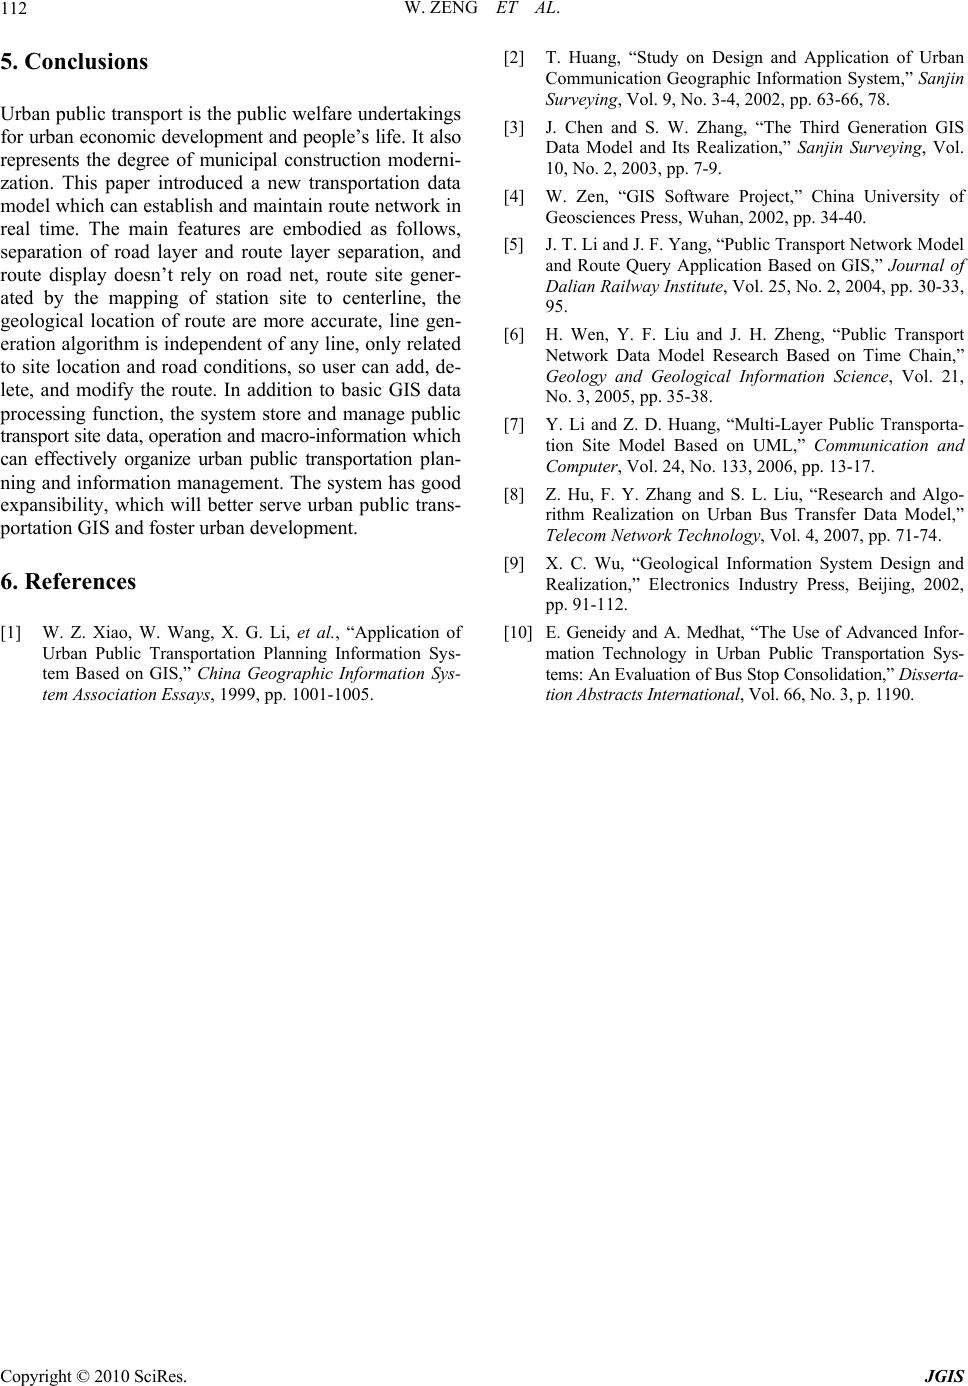 W. ZENG ET AL. Copyright © 2010 SciRes. JGIS 112 5. Conclusions Urban public transport is the public welfare undertaking s for urban economic development and people’s life. It also represents the degree of municipal construction moderni- zation. This paper introduced a new transportation data model which can establish and maintain route network in real time. The main features are embodied as follows, separation of road layer and route layer separation, and route display doesn’t rely on road net, route site gener- ated by the mapping of station site to centerline, the geological location of route are more accurate, line gen- eration algorithm is independent of any line, on ly related to site location and road conditions, so user can add, de- lete, and modify the route. In addition to basic GIS data processing function, the system store and manage public transport site data, operation and macro-information w h ich can effectively organize urban public transportation plan- ning and information management. The system has good expansibility, which will better serve urban public trans- portation GIS and foster urban development. 6. References [1] W. Z. Xiao, W. Wang, X. G. Li, et al., “Application of Urban Public Transportation Planning Information Sys- tem Based on GIS,” China Geographic Information Sys- tem Association Essays, 1999, pp. 1001-1005. [2] T. Huang, “Study on Design and Application of Urban Communication Geographic Information System,” Sanjin Surveying, Vol. 9, No. 3-4, 2002, pp. 63-66, 78. [3] J. Chen and S. W. Zhang, “The Third Generation GIS Data Model and Its Realization,” Sanjin Surveying, Vol. 10, No. 2, 2003, pp. 7-9. [4] W. Zen, “GIS Software Project,” China University of Geosciences Press, Wuhan, 2002, pp. 34-40. [5] J. T. Li and J. F. Yang, “Public Transport Network Model and Route Query Application Based on GIS,” Journal of Dalian Railway Institute, Vol. 25, No. 2, 2004, pp. 30-33, 95. [6] H. Wen, Y. F. Liu and J. H. Zheng, “Public Transport Network Data Model Research Based on Time Chain,” Geology and Geological Information Science, Vol. 21, No. 3, 2005, pp. 35-38. [7] Y. Li and Z. D. Huang, “Multi-Layer Public Transporta- tion Site Model Based on UML,” Communication and Computer, Vol. 24, No. 133, 2006, pp. 13-17. [8] Z. Hu, F. Y. Zhang and S. L. Liu, “Research and Algo- rithm Realization on Urban Bus Transfer Data Model,” Telecom Network Technology, Vol. 4, 2007, pp. 71-74. [9] X. C. Wu, “Geological Information System Design and Realization,” Electronics Industry Press, Beijing, 2002, pp. 91-112. [10] E. Geneidy and A. Medhat, “The Use of Advanced Infor- mation Technology in Urban Public Transportation Sys- tems: An Evaluation of Bus Stop Consolidati on,” Disserta- tion Abstracts International, Vol. 66, No. 3, p. 1190. |