Paper Menu >>
Journal Menu >>
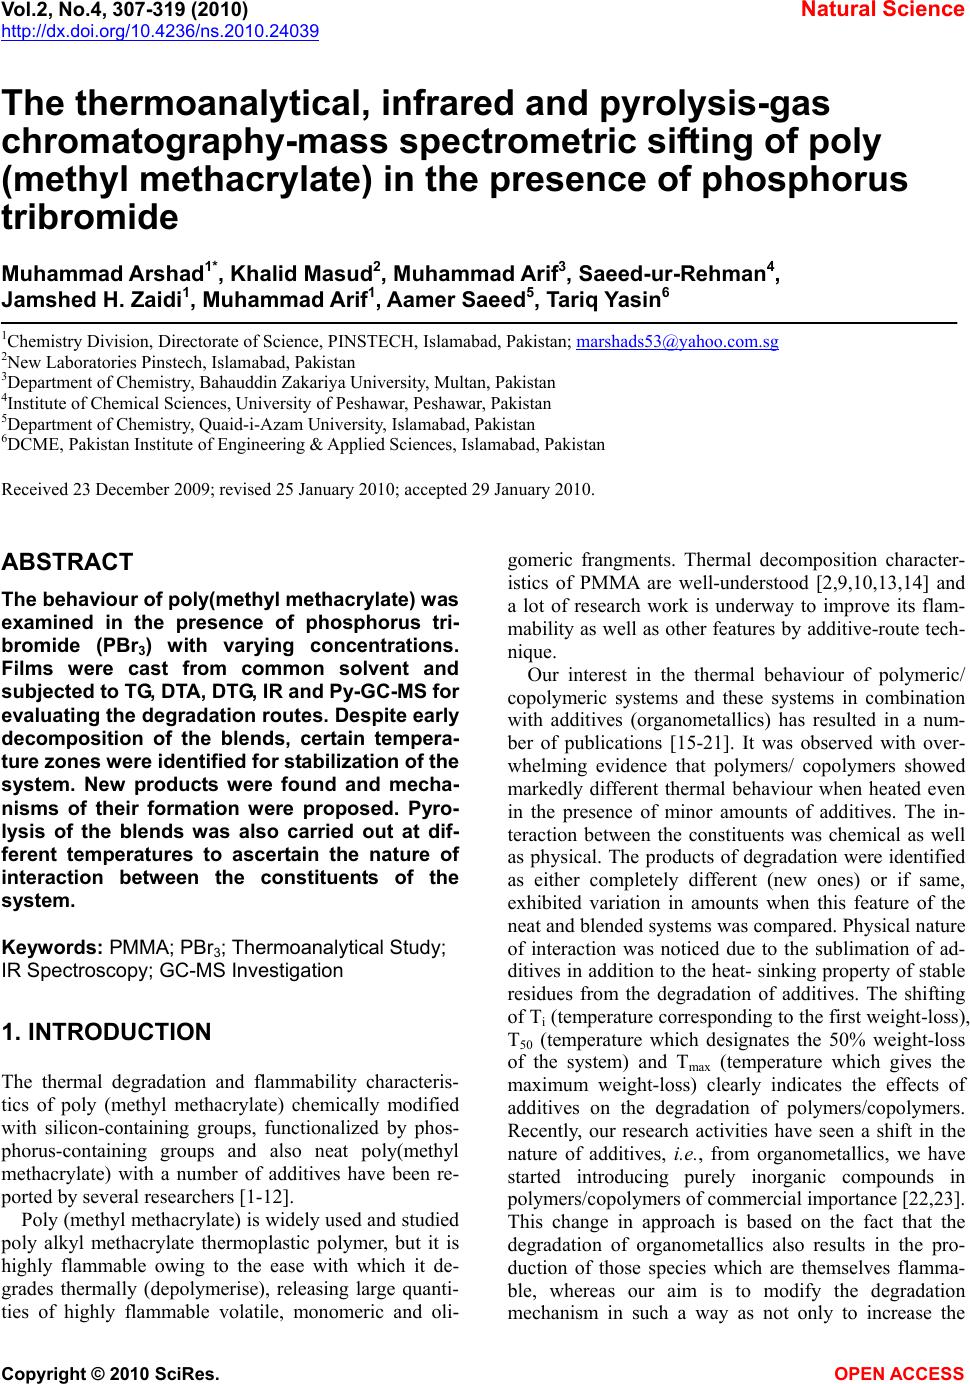 Vol.2, No.4, 307-319 (2010) Natural Science http://dx.doi.org/10.4236/ns.2010.24039 Copyright © 2010 SciRes. OPEN ACCESS The thermoanalytical, infrared and pyrolysis-gas chromatography-mass spectrometric sifting of poly (methyl methacrylate) in the presence of phosphorus tribromide Muhammad Arshad1*, Khalid Masud2, Muhammad Arif3, Saeed-ur-Rehman4, Jamshed H. Zaidi1, Muhammad Arif1, Aamer Saeed5, Tariq Yasin6 1Chemistry Division, Directorate of Science, PINSTECH, Islamabad, Pakistan; marshads53@yahoo.com.sg 2New Laboratories Pinstech, Islamabad, Pakistan 3Department of Chemistry, Bahauddin Zakariya University, Multan, Pakistan 4Institute of Chemical Sciences, University of Peshawar, Peshawar, Pakistan 5Department of Chemistry, Quaid-i-Azam University, Islamabad, Pakistan 6DCME, Pakistan Institute of Engineering & Applied Sciences, Islamabad, Pakistan Received 23 December 2009; revised 25 January 2010; accepted 29 January 2010. ABSTRACT The behaviour of poly(methyl methacrylate) was examined in the presence of phosphorus tri- bromide (PBr3) with varying concentrations. Films were cast from common solvent and subjected to TG, DTA, DTG, IR and Py-GC-MS for evaluating the degradation routes. Despite early decomposition of the blends, certain tempera- ture zones were identified for stabilization of the system. New products were found and mecha- nisms of their formation were proposed. Pyro- lysis of the blends was also carried out at dif- ferent temperatures to ascertain the nature of interaction between the constituents of the system. Keywords: PMMA; PBr3; Thermoanalytical Study; IR Spectroscopy; GC-MS Investigation 1. INTRODUCTION The thermal degradation and flammability characteris- tics of poly (methyl methacrylate) chemically modified with silicon-containing groups, functionalized by phos- phorus-containing groups and also neat poly(methyl methacrylate) with a number of additives have been re- ported by several researchers [1-12]. Poly (methyl methacrylate) is widely used and studied poly alkyl methacrylate thermoplastic polymer, but it is highly flammable owing to the ease with which it de- grades thermally (depolymerise), releasing large quanti- ties of highly flammable volatile, monomeric and oli- gomeric frangments. Thermal decomposition character- istics of PMMA are well-understood [2,9,10,13,14] and a lot of research work is underway to improve its flam- mability as well as other features by additive-route tech- nique. Our interest in the thermal behaviour of polymeric/ copolymeric systems and these systems in combination with additives (organometallics) has resulted in a num- ber of publications [15-21]. It was observed with over- whelming evidence that polymers/ copolymers showed markedly different thermal behaviour when heated even in the presence of minor amounts of additives. The in- teraction between the constituents was chemical as well as physical. The products of degradation were identified as either completely different (new ones) or if same, exhibited variation in amounts when this feature of the neat and blended systems was compared. Physical nature of interaction was noticed due to the sublimation of ad- ditives in addition to the heat- sinking property of stable residues from the degradation of additives. The shifting of Ti (temperature corresponding to the first weight-loss), T50 (temperature which designates the 50% weight-loss of the system) and Tmax (temperature which gives the maximum weight-loss) clearly indicates the effects of additives on the degradation of polymers/copolymers. Recently, our research activities have seen a shift in the nature of additives, i.e., from organometallics, we have started introducing purely inorganic compounds in polymers/copolymers of commercial importance [22,23]. This change in approach is based on the fact that the degradation of organometallics also results in the pro- duction of those species which are themselves flamma- ble, whereas our aim is to modify the degradation mechanism in such a way as not only to increase the 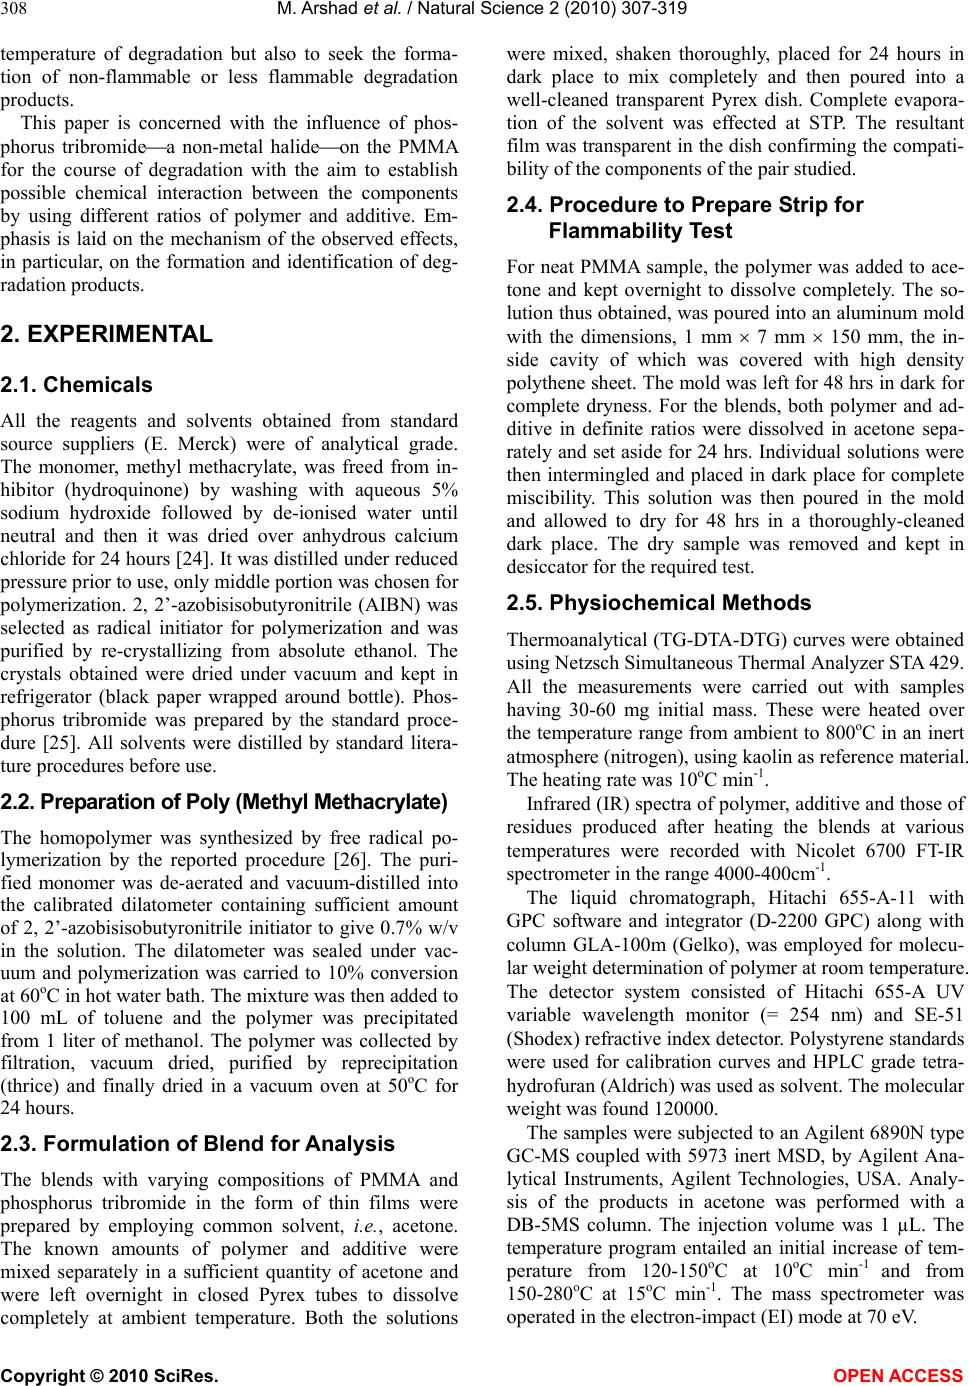 M. Arshad et al. / Natural Science 2 (2010) 307-319 Copyright © 2010 SciRes. OPEN ACCESS 308 temperature of degradation but also to seek the forma- tion of non-flammable or less flammable degradation products. This paper is concerned with the influence of phos- phorus tribromidea non-metal halideon the PMMA for the course of degradation with the aim to establish possible chemical interaction between the components by using different ratios of polymer and additive. Em- phasis is laid on the mechanism of the observed effects, in particular, on the formation and identification of deg- radation products. 2. EXPERIMENTAL 2.1. Chemicals All the reagents and solvents obtained from standard source suppliers (E. Merck) were of analytical grade. The monomer, methyl methacrylate, was freed from in- hibitor (hydroquinone) by washing with aqueous 5% sodium hydroxide followed by de-ionised water until neutral and then it was dried over anhydrous calcium chloride for 24 hours [24]. It was distilled under reduced pressure prior to use, only middle portion was chosen for polymerization. 2, 2’-azobisisobutyronitrile (AIBN) was selected as radical initiator for polymerization and was purified by re-crystallizing from absolute ethanol. The crystals obtained were dried under vacuum and kept in refrigerator (black paper wrapped around bottle). Phos- phorus tribromide was prepared by the standard proce- dure [25]. All solvents were distilled by standard litera- ture procedures before use. 2.2. Preparation of Poly (Methyl Methacrylate) The homopolymer was synthesized by free radical po- lymerization by the reported procedure [26]. The puri- fied monomer was de-aerated and vacuum-distilled into the calibrated dilatometer containing sufficient amount of 2, 2’-azobisisobutyronitrile initiator to give 0.7% w/v in the solution. The dilatometer was sealed under vac- uum and polymerization was carried to 10% conversion at 60oC in hot water bath. The mixture was then added to 100 mL of toluene and the polymer was precipitated from 1 liter of methanol. The polymer was collected by filtration, vacuum dried, purified by reprecipitation (thrice) and finally dried in a vacuum oven at 50oC for 24 hours. 2.3. Formulation of Blend for Analysis The blends with varying compositions of PMMA and phosphorus tribromide in the form of thin films were prepared by employing common solvent, i.e., acetone. The known amounts of polymer and additive were mixed separately in a sufficient quantity of acetone and were left overnight in closed Pyrex tubes to dissolve completely at ambient temperature. Both the solutions were mixed, shaken thoroughly, placed for 24 hours in dark place to mix completely and then poured into a well-cleaned transparent Pyrex dish. Complete evapora- tion of the solvent was effected at STP. The resultant film was transparent in the dish confirming the compati- bility of the components of the pair studied. 2.4. Procedure to Prepare Strip for Flammability Test For neat PMMA sample, the polymer was added to ace- tone and kept overnight to dissolve completely. The so- lution thus obtained, was poured into an aluminum mold with the dimensions, 1 mm 7 mm 150 mm, the in- side cavity of which was covered with high density polythene sheet. The mold was left for 48 hrs in dark for complete dryness. For the blends, both polymer and ad- ditive in definite ratios were dissolved in acetone sepa- rately and set aside for 24 hrs. Individual solutions were then intermingled and placed in dark place for complete miscibility. This solution was then poured in the mold and allowed to dry for 48 hrs in a thoroughly-cleaned dark place. The dry sample was removed and kept in desiccator for the required test. 2.5. Physiochemical Methods Thermoanalytical (TG-DTA-DTG) curves were obtained using Netzsch Simultaneous Thermal Analyzer STA 429. All the measurements were carried out with samples having 30-60 mg initial mass. These were heated over the temperature range from ambient to 800oC in an inert atmosphere (nitrogen), using kaolin as reference material. The heating rate was 10oC min-1. Infrared (IR) spectra of polymer, additive and those of residues produced after heating the blends at various temperatures were recorded with Nicolet 6700 FT-IR spectrometer in the range 4000-400cm-1. The liquid chromatograph, Hitachi 655-A-11 with GPC software and integrator (D-2200 GPC) along with column GLA-100m (Gelko), was employed for molecu- lar weight determination of polymer at room temperature. The detector system consisted of Hitachi 655-A UV variable wavelength monitor (= 254 nm) and SE-51 (Shodex) refractive index detector. Polystyrene standards were used for calibration curves and HPLC grade tetra- hydrofuran (Aldrich) was used as solvent. The molecular weight was found 120000. The samples were subjected to an Agilent 6890N type GC-MS coupled with 5973 inert MSD, by Agilent Ana- lytical Instruments, Agilent Technologies, USA. Analy- sis of the products in acetone was performed with a DB-5MS column. The injection volume was 1 µL. The temperature program entailed an initial increase of tem- perature from 120-150oC at 10oC min-1 and from 150-280oC at 15oC min-1. The mass spectrometer was operated in the electron-impact (EI) mode at 70 eV. 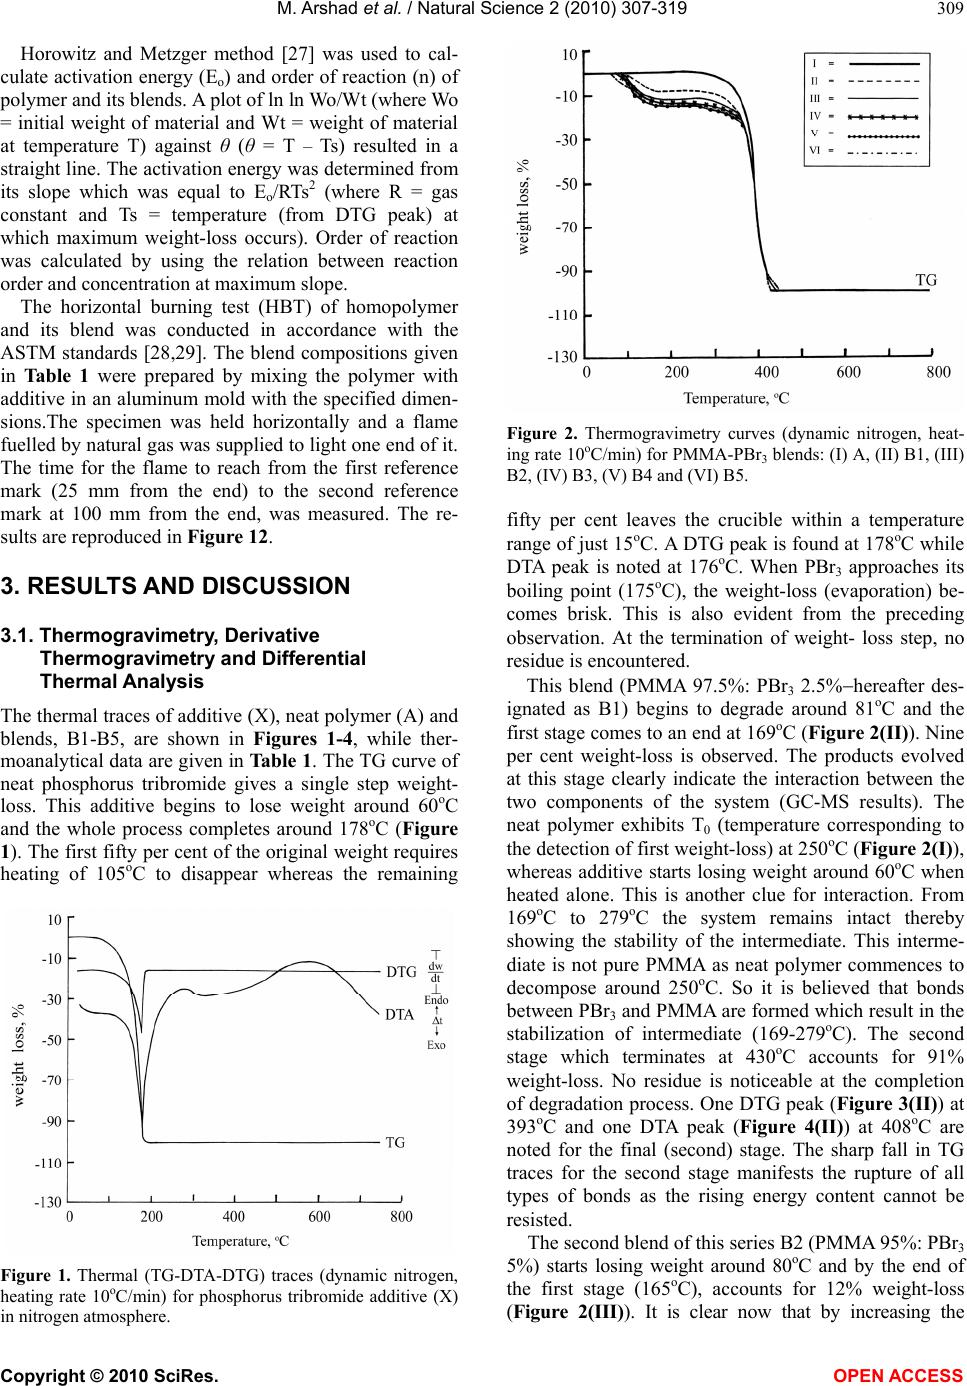 M. Arshad et al. / Natural Science 2 (2010) 307-319 Copyright © 2010 SciRes. OPEN ACCESS 309 Horowitz and Metzger method [27] was used to cal- culate activation energy (Eo) and order of reaction (n) of polymer and its blends. A plot of ln ln Wo/Wt (where Wo = initial weight of material and Wt = weight of material at temperature T) against θ (θ = T – Ts) resulted in a straight line. The activation energy was determined from its slope which was equal to Eo/RTs2 (where R = gas constant and Ts = temperature (from DTG peak) at which maximum weight-loss occurs). Order of reaction was calculated by using the relation between reaction order and concentration at maximum slope. The horizontal burning test (HBT) of homopolymer and its blend was conducted in accordance with the ASTM standards [28,29]. The blend compositions given in Table 1 were prepared by mixing the polymer with additive in an aluminum mold with the specified dimen- sions.The specimen was held horizontally and a flame fuelled by natural gas was supplied to light one end of it. The time for the flame to reach from the first reference mark (25 mm from the end) to the second reference mark at 100 mm from the end, was measured. The re- sults are reproduced in Figure 12. 3. RESULTS AND DISCUSSION 3.1. Thermogravimetry, Derivative Thermogravimetry and Differential Thermal Analysis The thermal traces of additive (X), neat polymer (A) and blends, B1-B5, are shown in Figures 1-4, while ther- moanalytical data are given in Table 1. The TG curve of neat phosphorus tribromide gives a single step weight- loss. This additive begins to lose weight around 60oC and the whole process completes around 178oC (Figure 1). The first fifty per cent of the original weight requires heating of 105oC to disappear whereas the remaining Figure 1. Thermal (TG-DTA-DTG) traces (dynamic nitrogen, heating rate 10oC/min) for phosphorus tribromide additive (X) in nitrogen atmosphere. Figure 2. Thermogravimetry curves (dynamic nitrogen, heat- ing rate 10oC/min) for PMMA-PBr3 blends: (I) A, (II) B1, (III) B2, (IV) B3, (V) B4 and (VI) B5. fifty per cent leaves the crucible within a temperature range of just 15oC. A DTG peak is found at 178oC while DTA peak is noted at 176oC. When PBr3 approaches its boiling point (175oC), the weight-loss (evaporation) be- comes brisk. This is also evident from the preceding observation. At the termination of weight- loss step, no residue is encountered. This blend (PMMA 97.5%: PBr3 2.5%hereafter des- ignated as B1) begins to degrade around 81oC and the first stage comes to an end at 169oC (Figure 2(II)). Nine per cent weight-loss is observed. The products evolved at this stage clearly indicate the interaction between the two components of the system (GC-MS results). The neat polymer exhibits T0 (temperature corresponding to the detection of first weight-loss) at 250oC (Figure 2(I)), whereas additive starts losing weight around 60oC when heated alone. This is another clue for interaction. From 169oC to 279oC the system remains intact thereby showing the stability of the intermediate. This interme- diate is not pure PMMA as neat polymer commences to decompose around 250oC. So it is believed that bonds between PBr3 and PMMA are formed which result in the stabilization of intermediate (169-279oC). The second stage which terminates at 430oC accounts for 91% weight-loss. No residue is noticeable at the completion of degradation process. One DTG peak (Figure 3(II)) at 393oC and one DTA peak (Figure 4(II)) at 408oC are noted for the final (second) stage. The sharp fall in TG traces for the second stage manifests the rupture of all types of bonds as the rising energy content cannot be resisted. The second blend of this series B2 (PMMA 95%: PBr3 5%) starts losing weight around 80oC and by the end of the first stage (165oC), accounts for 12% weight-loss (Figure 2(III)). It is clear now that by increasing the 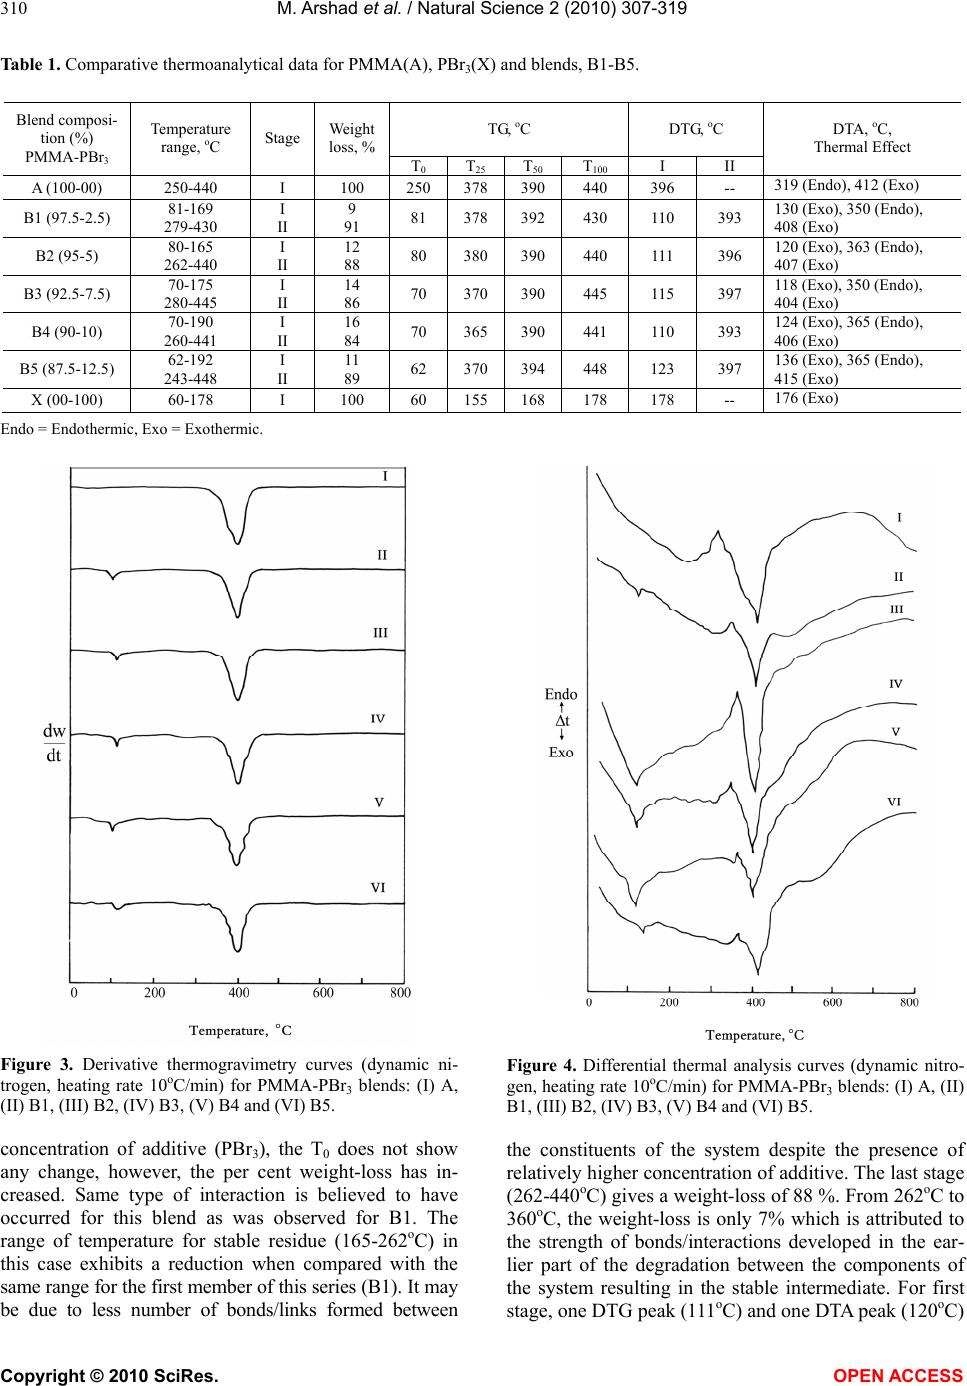 M. Arshad et al. / Natural Science 2 (2010) 307-319 Copyright © 2010 SciRes. OPEN ACCESS 310 Table 1. Comparative thermoanalytical data for PMMA(A), PBr3(X) and blends, B1-B5. Endo = Endothermic, Exo = Exothermic. Figure 3. Derivative thermogravimetry curves (dynamic ni- trogen, heating rate 10oC/min) for PMMA-PBr3 blends: (I) A, (II) B1, (III) B2, (IV) B3, (V) B4 and (VI) B5. concentration of additive (PBr3), the T0 does not show any change, however, the per cent weight-loss has in- creased. Same type of interaction is believed to have occurred for this blend as was observed for B1. The range of temperature for stable residue (165-262oC) in this case exhibits a reduction when compared with the same range for the first member of this series (B1). It may be due to less number of bonds/links formed between Figure 4. Differential thermal analysis curves (dynamic nitro- gen, heating rate 10oC/min) for PMMA-PBr3 blends: (I) A, (II) B1, (III) B2, (IV) B3, (V) B4 and (VI) B5. the constituents of the system despite the presence of relatively higher concentration of additive. The last stage (262-440oC) gives a weight-loss of 88 %. From 262oC to 360oC, the weight-loss is only 7% which is attributed to the strength of bonds/interactions developed in the ear- lier part of the degradation between the components of the system resulting in the stable intermediate. For first stage, one DTG peak (111oC) and one DTA peak (120oC) TG, oC DTG, oC Blend composi- tion (%) PMMA-PBr3 Temperature range, oC Stage Weight loss, % T0 T 25 T 50 T 100 I II DTA, oC, Thermal Effect A (100-00) 250-440 I 100 250 378 390 440 396 -- 319 (Endo), 412 (Exo) B1 (97.5-2.5) 81-169 279-430 I II 9 91 81 378 392 430 110 393 130 (Exo), 350 (Endo), 408 (Exo) B2 (95-5) 80-165 262-440 I II 12 88 80 380 390 440 111 396 120 (Exo), 363 (Endo), 407 (Exo) B3 (92.5-7.5) 70-175 280-445 I II 14 86 70 370 390 445 115 397 118 (Exo), 350 (Endo), 404 (Exo) B4 (90-10) 70-190 260-441 I II 16 84 70 365 390 441 110 393 124 (Exo), 365 (Endo), 406 (Exo) B5 (87.5-12.5) 62-192 243-448 I II 11 89 62 370 394 448 123 397 136 (Exo), 365 (Endo), 415 (Exo) X (00-100) 60-178 I 100 60 155 168 178 178 -- 176 (Exo)  M. Arshad et al. / Natural Science 2 (2010) 307-319 Copyright © 2010 SciRes. OPEN ACCESS 311 appear. For second step, one DTG (Figure 3(III)) and two DTA (Figure 4(III)) peaks are noticed at 396oC, 363oC and 407oC, respectively. No residue is found at the termination of the degradation process. B3 (PMMA 92.5%: PBr3 7.5%) begins to degrade around 70oC and loses 14 % of original weight in the first stage which terminates at 175oC (Figure 2(IV)). The intermediate formed at this stage is stable up to 280oC after which the pyrolysis again starts and the sec- ond step shows a weight-loss of 86 % with no residue at the completion of the decomposition (445oC). From 280oC to 338oC, only 6% weight-loss is observed which is indicative of the toughness of bonds that developed during the early part of pyrolysis. One DTG (Figure 3(IV)) and one DTA (Figure 4(IV)) peak appear for first stage (115 and 118oC, respectively), however, for second stage one DTG and two DTA peaks at 397oC , 350oC and 404oC, respectively, arise. B4 (PMMA 90%: PBr3 10%) shows a weight-loss of 16 % for first stage. It commences to decompose around 70oC and stops losing weight around 190oC (Figure 2(V)). Single DTG (Figure 3(V)) and DTA (Figure 4(V)) peaks are found at 110oC and 124oC, respectively. The intermediate withstands a temperature of 70oC (190- 260oC) before the inception of second stage of degrada- tion. The second step comes to an end at 441oC marking a weight-loss of 84%. The first 6% weight-loss of sec- ond stage requires heating of 96oC which is due to the strong bonds/links produced in the early part of the deg- radation. One DTG and two DTA peaks are observed at 393, 365 and 406oC, respectively. No residue is notice- able at the completion of degradation process. B5 (PMMA 87.5%: PBr3 12.5%) commences its weight- loss around 62oC for first stage which comes to an end at 192oC (Figure 2(VI)). One DTG and one DTA peak appear for this step at 123oC and 136oC, respectively. Eleven per cent weight-loss is evident from TG traces (Figure 2(VI)). The intermediate that is stable up to 243oC, starts decomposing as the temperature increases. The second stage terminates at 448oC. One DTG (Figure 3(VI)) and two DTA (Figure 4(VI)) peaks are found at 397oC, 365oC and 415oC, respectively. The first 8% weight-loss for the second step (out of 89%) requires heating of 109oC (from 243 to 352oC) whereas the re- maining larger portion (81 %) leaves the scene for a heating of 96oC (352-448oC). This is basis of the types of bonds present in the intermediate. There was no resi- due at the end of pyrolysis of this blend. The interaction is clear between the components of the system throughout the series, i.e., B1-B5. The nature of interaction seems to be same for all members of the se- ries with effectiveness decreasing down the series. The percentage of degradation for first stage is higher than the total percentage of additive in the blends B1-B4. The molecular level mixing of the constituents favours the development of links between them which, in turn, in- fluences the degradation of both parts from the begin- ning. The evolution of new products (GC-MS results) in the early part of pyrolysis confirms the chemical interac- tion and mutual effect of the ingredients on each other’s decomposition. 3.2. Blend’s Composition Effect on Thermal Behaviour Figure 5 shows the graph between temperature and weight % of additive. The results reveal a very clear trend of destabilization when T0 is considered. It is ob- served that as the percentage of additive in the blends is increased, a slight stabilization of 20oC is noted which may be attributed to the number of links which are de- veloped between phosphorus and pendent oxygens of polymer per unit volume of additive. For T25 (tempera- ture at which 25% weight-loss occurs), the trend in de- stabilization is not so different for blends when weight percentage of additive goes from 2.5 to 12.5. This seems to be due to the less number of interactions, i.e., cumula- tive impact to lowers. At T50 (temperature at which 50% weight-loss is observed), a very inappreciable stabiliza- tion is observed as energy content is too great to be re- sisted by the different types of interactions or bonds be- tween additive and polymer irrespective of the weight percentage of additive. T100 (temperature for 100 weight- loss) does not show much difference for polymer and blends which may be due to very high temperature re- gion signifying the completion of decomposition process. In this zone, almost all kinds of bonds are prone to breakage. 3.3. Activation Energy (Eo) and Order of Reaction (n) Determination Table 2 presents the activation energy and order of reac- tion of thermal decomposition of polymer, additive and polymer-additive systems. A decreasing trend of activa- tion energy is noticed with the increasing percentage of Figure 5. Effect of blend composition on T0, T25, T50 and T100 values of A and B1-B5 blends.  M. Arshad et al. / Natural Science 2 (2010) 307-319 Copyright © 2010 SciRes. OPEN ACCESS 312 Table 2. Activation energies and order of reaction for A, X and PMMA-additive blends. Blend composition (%) PMMA-PBr3 Eo* (KCal/mol) Order of reaction (n) A 138.9 3/2 B1 43.68 1/2 B2 42.17 1/2 B3 40.29 1 B4 37.65 1 B5 38.03 3/2 X 93.32 0 * = overall activation energy. Figure 6. UV-spectra of X (I) and B4 (II) blend in acetone. additive (2.5-12.5%) in the blends. These results were computed from TG curves. It is believed that decrease in the activation energy is due to the destabilization of the blended system observed in the earlier part of pyrolysis keeping T0 in view. The interaction at the outset of deg- radation between the components of blends triggers an early loss of weight which is attributed to the decreasing trend this parameter exhibits down the series (B1B5). The shifting of T0 to lower temperatures from B1 to B5 is quite evident in the current thermal investigation. 3.4. UV Findings It is well-known fact that PMMA does not absorb in UV region. On the contrary, PBr3 gives a distinct peak at 325 nm (in acetone) whereas its blend with PMMA also absorbs in UV range (Figure 6). The shift in wavelength for PMMA-PBr3 (330 nm) clearly indicates interaction between the components of the system. This shift is at- tributed to the establishment of links between phospho- rus of additive and carbonyl oxygen of polymer and bromines of additive and carbons of polymer backbone (main chain). 3.5. IR Spectra Poly(methyl methacrylate) is a widely-studied polymer and its IR spectrum (Figure 7(I)) gives the characteristic peaks for the presence of ester linkages (1730-1735 cm-1). The absence of peaks in the region of 1630-1640 cm-1 confirms the formation of polymer. The stretchings attributed to C-H bonds can be observed around 3000 cm-1. The IR of PBr3 (Figure 7(II)) shows a broad band at 3362 cm-1 which is due to water absorption (all our en- deavors to save PBr3 from taking moisture from sur- roundings failed as the humidity was high at the time of IR run). The remaining peaks (485, 476, 458, 442, 418, 407 cm-1) are assigned to P-Br bond [30]. The IR peaks for blend (B4PMMA 90%:PBr3 10%selected arbi- trarily to represent the whole series) exhibit some inter- esting features (Figure 7(III)). “Free” PBr3 is either completely absent or if present, is only at trace levels. The absence of peaks around 3362 cm-1 (O-H stretch- ing for water) overrules the presence of free PBr3. The shift observed for ester linkages of PMMA (IR peak at 1718 cm-1) and appearance of some sharp peaks at 1434, 1386, 1141 cm-1 suggest formation of a ‘complex-type’ arrangement involving carbonyl oxygen of PMMA pen- dent groups (either of the same chain or two different chains) and phosphorus of PBr3. The following struc- tures are proposed. Few more peaks at 1238, 667, 599, 564 cm-1 indicate that Br of P-Br bond ‘experiences’ a pull from nearby carbons (backbone as well as ester carbons) [30-33]. For true C-Br and CH3-Br bonds, the stretchings are found at 515-680 and ~1230 cm-1, respectively. This may result in the weakening of this bond (P-Br) as Br ‘moves’ closer to the more electropositive carbon atoms. The results of GC-MS point towards these types of developments. Figure 7. (I) Infrared spectra of PMMA; (II) Additive, PBr3; (III) Blend, B4, PMMA (90%) + PBr3 (10%).  M. Arshad et al. / Natural Science 2 (2010) 307-319 Copyright © 2010 SciRes. OPEN ACCESS 313 CH 2 CCH 2 CH 3 C CH 3 C H 3 CO OOH 3 CO C P Br Br Br CH 3 C CH 3 CO H 3 CO P Br Br Br OCOCH 3 CCH 2 CH 3 and H 2 CC CH 3 CH 2 C C=O O H 3 C C=O OCH 3 P Br Br Br CH 3 and H 2 CCCH 2 C CH 3 CH 3 C=O C=O OOCH 3 H 3 CBr P Br Br OCH 3 C O= C CH 2 CH 3 and C CH 3 H 2 CC C=O O C=O O CH 3 CH 3 P Br Br Br CH 3 CH 2 3.6. Pyrolysis-Gas Chromatography-Mass Spectrometry Behaviour The blend B4 (PMMA:PBr3, 90%:10%) was heated to 250oC for a minute and after bringing the residue to room temperature, GC-MS was taken in acetone to check the nature of degrading blend around this tem- perature. B4 was selected arbitrarily to represent the present series. Since the blends show stability at or around 250oC (TG traces, Figure 2), the identification of products is expected to shed light on the interactions developed by the constituents of blends at this stage. GC-MS of this blend (Figure 8) shows a number of peaks. The products identified clearly indicate the inter- action between the components of the system from an early stage of degradation. The absence of PBr3 in the degradation products (it could not be found in a trap at -196oC) after heating B4 up to 250oC suggests its in- volvement with the pendent groups of the neat polymer or even with the backbone of the PMMA. However, the early weight-loss is attributed to the decomposition of some ‘free’ PBr3 which initiates the degradation of polymer. The formation of Br. (free radicals) may result in the products of peaks at 1, 3, and 4. Peak number 7, gives the bromine radicals replacing the methyls at- tached to the backbone carbons. The other peaks hint at either the contacts developed by one constituent (P) of the additive (PBr3) or both. The product at peak 8 pro- vides the convincing clue for the stability of the system in the region unfolded by TG curves (Figure 2). The  M. Arshad et al. / Natural Science 2 (2010) 307-319 Copyright © 2010 SciRes. OPEN ACCESS 314 Figure 8. GC-MS results of blend, B4 (PMMA (90%) + PBr3 (10%)), heated at 250oC. Figure 9. GC-MS results of blend, B4 (PMMA (90%) + PBr3 (10%)), heated at 300oC. interactions proposed as per IR studies (Figure 7) may be taken as proof now supported by GC-MS studies. The ‘binding’ of pendent groups of PMMA by phosphorus of additive may stop the degradation of polymer in certain temperature ranges furnishing stability to the system. The strength of the overall system lies in the ‘engage- ment’ of various chains by undegraded or partially de- graded additive. The mechanism of the production of these compounds is presented in Schemes I-IV. Peak no. 9 provides a clue (which may also be regarded as the reason of stability of the system around this temperature, i.e., 250 oC) whereby phosphorus is found as part of the backbone. It is worth-noting that phosphorus present in backbone of polymer is attached to carbon and hydrogen whereas bromine replaces either the –OCH3 of pendent group or CH3 attached to backbone carbons. The for- mation of –PH2 and –PH- from PBr3 appears to have taken place along the degrading polymer. This also ex- plains the “blockades” experienced by the degrading polymer [15,20,21]. The GC-MS taken after heating the blend (B4) up to 300oC is to get insight into the nature of products arisen, after the decomposition of stable intermediate (Figure 9). Figure 10. GC-MS results of blend B4, (PMMA (90%) + PBr3 (10%)), heated at 400oC. Figure 11. GC-MS results of blend B4 (PMMA (90%) + PBr3 (10%)), heated to boiling, cooled and mixed with acetone. The product identified at peak number 5 does provide enough information about the stable intermediate. Phos- phorus seems to be linked to two separate chains (Scheme V). Another product (peak no. 6) suggests as if Br. (free radicals) blocks the depolymerisation of the chains (Scheme VI). The products identified (Table 3) after heating the blend (B4) to 400oC also furnish evidence of the mecha- nism of degradation close to the completion of decom- position process (GC-MS, Figure 10). Despite inclusion of phosphorus in the chain (peak 3), replacement of some of the part of pendent group by phosphorus (peak 6) and presence of bromine (peak 6) at the end of few modified MMA units, the breaking of bonds takes place owing to the energy content of this temperature zone (at or around 400oC). Unzipping of the chains cannot be hindered by phosphorus or bromine. Oligomers of neat MMA are absent which is another indication of interac- tion between the components of the system. Another GC-MS (Figure 11) of this blend was re- corded after heating to boiling for two minutes, cooling and then dissolving it in acetone. This was performed to check the overall behaviour of the blend subjecting it to  M. Arshad et al. / Natural Science 2 (2010) 307-319 Copyright © 2010 SciRes. OPEN ACCESS 315 H 2 CC CH 2 CCH 2 C C=O C=O C=O OCH 3 OCH 3 OCH 3 P CH 3 CH 3 CH 3 Br Br Br H 2 C C CH 2 CCH 2 C C=O C=O C=O CH 3 CH 3 CH 3 OCH 3 H abstraction H 2 CC CH 2 CCH 2 C C=O C=O C=O CH 3 CH 3 CH 3 OCH 3 + OCH 3 OCH 3 P Br Br Br Methanol HH MMA + H 3 C CCH 2 CH C=O C=O CH 3 CH 3 HH H 3 C C CH 2 CH C=O C= O CH 3 Br HH Replacement of CH 3 with Br Scheme I H 2 CC CH 2 CH 2 C C=O C=O CH 3 CH 3 OCH 3 C C=O CH 3 OCH 3 PH 2 H 3 C Br P Br Br C CH 3 CH 3 H 3 C Br C=O OCH 3 Br C=O OCH 3 Br OCH 3 Scheme II  M. Arshad et al. / Natural Science 2 (2010) 307-319 Copyright © 2010 SciRes. OPEN ACCESS 316 H 2 C CCH 2 CCH 2 C=O O=C CH 3 CH 3 CH 3 O CH 3 OCH 3 P Br Br Br P Br Br Br H 3 CCCH 2 CCH 3 C=O C=O HH+ + OH Br (Traces) H 3 C CCH 2 CCH 3 C=O C=O HBr HH HBr abstraction CH 3 Scheme III H 2 C C CH 2 CCH 2 C=O C=O CH 3 CH 3 OCH 3 OCH 3 P Br Br Br CCH 2 C=O CH 3 OCH 3 P Br Br Br P Br Br Br H 3 C CCH 2 C=O C C=O H and Br H 3 CCH CH 2 C=O CH C=O Br H Decomposing PBr 3 H 3 CCH CH 2 C=O CH C=O Br H P H HC CH 3 C=O H H 3 CCH CH 2 C=O CH C=O Br H P H CH CH 3 C=O H OCH 3 Remaining part of pendent group Scheme IV  M. Arshad et al. / Natural Science 2 (2010) 307-319 Copyright © 2010 SciRes. OPEN ACCESS 317 H 2 C C CH 2 C C=O C=O CH 3 CH 3 OO H 3 CCH 3 P Br Br Br CCH 2 C=O CH 3 O CH 3 H CCH 2 CH O=C C=O CH 3 CH 3 OO P CH CH 3 C=O O CH 3 + Br which may terminate few depolymerizing modified and unmodified MMA units Scheme V H 2 C C CH 2 C C=O C=O CH 3 CH 3 OOCH 3 CH 3 Br effected by the presence of PBr 3 H 3 CC CH 2 C C=O C=O CH 3 CH 3 OOCH 3 CH 3 Br Scheme VI Table 3. GC-MS results of blend, B4 after heating at 250oC, 300oC and 400oC. Blend heated at 250oC Blend heated at 300oC Blend heated at 400oC Peak no. Product identified Peak no. Product identified Peak no. Product identified 1 C2H3O2Br, C3H6O, CH4O 1 C2H3OBr 1 C5H9Br 2 C5H11O2P 2 C2H4OPBr 2 C2H4PBr or CH2OPBr 3 C3H8PBr 3 CH3OBr 3 C7H14O3P2, C8H13O4P 4 C4H9Br 4 C6H12PBr 4 C7H11O2Br 5 Unidentified 5 C11H17O6P 5 C8H11O2PBr 6 Unidentified 6 C10H17O4Br 6 C12H21O3P2Br 7 C4H5O2Br -- -- -- -- 8 C4H7Br2 -- -- -- -- 9 C9H14O3PBr -- -- -- -- high temperature for short time. Modified MMA units were found confirming the products identified in differ- ent temperature zones earlier. Traces of MMA units were also detected which is in accordance with earlier find- ings. It is further concluded (peak 5) that parts of the pendent groups of MMA units are equally liable to re- placement by bromine and phosphorus. The interaction between additive and polymer is es- tablished. The GC-MS studies help in understanding the mechanism of degradation of the blended system. This interaction imparts stability to the system in certain re- gions (TG curves). The orientation of PBr3 in the system appears to have profound impact on the formation of the products identified during degradation at different tem- peratures. The cross-linking of adjacent chains by the presence of phosphorus gives stability to the system. In addition to this, phosphorus and bromine when terminate the degrading polymer also play role in the formation of these products which ‘block’ further degradation in the regions of stability. 3.7. Flammability Behaviour of Neat Polymer and its Blends Horizontal burning rate (HBR) and time to burn neat  M. Arshad et al. / Natural Science 2 (2010) 307-319 Copyright © 2010 SciRes. OPEN ACCESS 318 Figure 12. Horizontal burning rate of polymer and its blends. Table 4. Horizontal burning rate (HBR) for polymer (A) and blends, B1-B4. Polymer/Blend code number A B1 B2 B3 B4 B5 Time to burn (sec) 11 39 43 49 58 65 Length of strip (mm) 75 75 75 75 75 75 HBR (mm/sec) 6.8 1.9 1.7 1.5 1.291.15 mm = millimeter, sec = second. polymer and its blends are tabulated in Table 4. The trend is clearly a linear one (Figure 12). Higher the con- centration of additive in the blend, lower is the rate of burning obtained. It has been observed that burning rate of blend (B5) decreases to 6 times compared to neat polymer (A). Reduction in burning rate is much more pronounced even with the lowest proportion of additive (B1) and this is easily explained by the retardency caused by the additive towards polymer’s flammability. The uniform distribution of all concentrations of additive throughout polymer is also confirmed. 4. CONCLUSIONS 1) The blends (PMMA-PBr3) lose weight at lower tem- peratures than neat polymer. 2) Despite early destabilization, the blends exhibit sta- bilization temperature zones. 3) The interaction between the components appears to be purely chemical. 4) The earlier decomposition is attributed to the split- ting of PBr3 releasing bromine free radicals (Br.). 5) The formation of products involving phosphorus as part of degrading polymer imparts stability to the blends. 6) The “engaging” of separate polymer chains by phosphorus is another reason of stabilization of the bi- nary system. 7) It seems that free radicals (Br.) not only start the early depolymerization of the polymer but also inhibits this process, thus, providing one more point for stabili- zation. 8) The pendent groups of polymer or a part of them are equally liable to replacement by phosphorus and bromine. 9) The production of monomer has decreased signifi- cantly furnishing ample evidence for chemical interac- tion between the constituents of the system. 5. ACKNOWLEDGEMENTS The authors would like to express their gratitude to PINSTECH, Is- lamabad, Pakistan for providing the opportunity to undertake this research work. Messrs Nehad Ali (Senior Tech. IAD, PINSTECH), Nadeem Ahmad and Muhammad Adeel Khattak are acknowledged for drawing of figures and technical help. REFERENCES [1] Laachachi, A., Cochez, M., Ferriol, M., Leroy, E., Lopez, C.M. and Oget, N. (2004) Influence of Sb2O3 particles as filler on the thermal stability and flammability properties of poly (methyl methacrylate) (PMMA). Polymer Deg- radation and Stability, 85(1), 641-646. [2] Ebdon, J.R., Hunt, B.J. and Joseph, P. (2004) Thermal degradation and flammability characteristics of some polystyrenes and poly (methyl methacrylate) chemically modified with silicon-containing groups. Polymer Deg- radation and Stability, 83(1), 181-185. [3] Gentilhomme, A., Cochez, M., Ferriol, M., Oget, N. and Mieloszynski, J.L. (2003) Thermal degradation of methyl methacrylate polymers functionalized by phosphorus containing molecules – II: Initial flame retardance and mechanistic studies. Polymer Degradation and Stability, 82(2), 347-355. [4] Price, D., Pyrah, K., Hull, T.R., Milnes, G.J., Ebdon, J.R., Hunt, B.J. and Joseph P. (2002) Flame retardance of poly (methyl methacrylate) modified with phosphorus con- taining compounds. Polymer Degradation and Stability, 77(2), 227-233. [5] Price, D., Pyrah, K., Hull, T.R., Milnes, G.J., Ebdon, J.R., Hunt, B.J., Joseph, P. and Konkel, C.S. (2001) Flame re- tarding poly (methyl methacrylate) with phosphorous containing compounds: Comparison of an additive with a reactive approach. Polymer Degradation and Stability, 74(3), 441-447. [6] Ebdon, J.R., Price, D., Hunt, B.J., Joseph, P., Gao, F., Milnes, G.J. and Cunliffe, L.K. (2000) Flame retardance in some polystyrene and poly (methyl methacrylate) with covalently bound phosphorus – containing groups: Initial screening experiments and some laser pyrolysis mecha- nistic studies. Polymer Degradation and Stability, 69(3), 267-277. [7] Chang, T.C. and Wu, K.H. (1997) The effect of silicon and phosphorus on the thermo-oxidative degradation of poly (methyl methacrylate). Polymer Degradation and Stability, 57(4), 325-330. [8] Nair, C.P.R., Clouet, G. and Guilbert, Y. (1989) Flame and thermal resistance of phosphorous – functionalized poly (methyl methacrylate) and polystyrene. Polymer  M. Arshad et al. / Natural Science 2 (2010) 307-319 Copyright © 2010 SciRes. OPEN ACCESS 319 Degradation and Stability, 26(4), 305-331. [9] Chandrasiri, J.A. and Wilkie, C.A. (1994) Thermal deg- radation of poly (methyl methacrylate) in the presence of tin (IV) chloride and tetraphenyltin. Polymer Degrada- tion and Stability, 45(1), 91-96. [10] Chandrasiri, J.A., Roberts, D.E. and Wilkie, C.A. (1994) The effect of some transition metal chlorides on the thermal degradation of poly (methyl methacrylate): A study using TGA–FTIR spectrometry. Polymer Degrada- tion and Stability, 45(1), 97-101. [11] McNeill, I.C. and McGuiness, R.C. (1984) The effect of zinc bromide on the thermal degradation of poly (methyl methacrylate): Part I – Thermal analysis studies and gen- eral nature of the interaction. Polymer Degradation and Stability, 9(3), 167-183. [12] McNeill, I.C. and McGuiness, R.C. (1984) The effect of zinc bromide on the thermal degradation of poly (methyl methacrylate): Part 2 – Reaction products, structural changes and degradation mechanism. Polymer Degrada- tion and Stability, 9(4), 209-224. [13] Song, J., Fischer, C. H. and Schnabel, W. (1992) Thermal oxidative degradation of poly (methyl methacrylate). Polymer Degradation and Stability, 36(3), 261-266. [14] Wochnowski, C., Eldin, M. A. S. and Metev S. (2005) UV-laser-assisted degradation of poly (methyl methacry- late). Polymer Degradation and Stability, 89(2), 252-264. [15] Zulfiqar, S., Paracha, A. and Masud, K. (1996) The thermal degradation of poly (allyl methacrylate). Poly- mer Degradation and Stability, 52(1), 89-93. [16] Zulfiqar, S., Masud, K., Siddique, B. and Paracha, A. (1996) Thermal degradation of phenyl methacrylate-sty- rene copolymers. Polymer Degradation and Stability, 52(3), 293-299. [17] Zulfiqar, S., Masud, K., Piracha, A. and McNeill, I.C. (1997) Thermal degradation of allyl methacrylate-methyl methacrylate copolymers. Polymer Degradation and Sta- bility, 55(3), 257-263. [18] Zulfiqar, S. and Masud, K. (2000) Thermal degradation of blends of allyl methacrylate-methyl methacrylate co- polymers with aluminum ethoxide. Polymer Degradation and Stability, 70(2), 229-236. [19] Zulfiqar, S., Masud, K. and Ameer, Q. (2002) Thermal degradation of blends of phenyl methacrylate-styrene copolymers with aluminum ethoxide. Polymer Degrada- tion and Stability, 77(3), 457-464. [20] Zulfiqar, S. and Masud, K. (2002) Thermal degradation of blends of allyl methacrylate-methyl methacrylate co- polymers with aluminum isopropoxide. Polymer Degra- dation and Stability, 78(2), 305-313. [21] Zulfiqar, S., Masud, K. and Ameer, Q. (2003) Thermal degradation behavior of blends of phenyl methacry- late-styrene copolymers with aluminum isopropoxide. Journal of Thermal Analysis and Calorimetry, 73(3), 877-886. [22] Arshad, M., Masud, K., Arif, M., Rehman, S., Chohan, Z.H., Arif, M., Qureshi, A.H., Saeed, A., Salma, U. and Awan, M.S. (2008) A comparative study of roles played by aluminum tribromide and aluminum acety- lacetonate on the thermal degradation of PMMA by si- multaneous thermoanalytical techniques. The Nucleus, 45(1-2), 63-72. [23] Arshad, M., Masud, K., Arif, M., Rehman, S., Arif, M., Zaidi, J.H., Chohan, Z.H., Saeed, A. and Qureshi, A.H. (2009) The effect of AlBr3 additive on the thermal deg- radation of PMMA: A study using TG–DTA–DTG, IR and Py–GC–MS techniques. Journal of Thermal Analysis and Calorimetry, 96(3), 873-881. [24] Riddick, J.A., Bunger, W.B. and Sakano, T.K. (1986) Organic solvents – physical properties and methods of purification. John-Wiley and Sons, New York. [25] Furniss, B.S. and Vogel, A.I. (1978) Vogel’s textbook of practical organic chemistry. Longman Group, London, 458-459. [26] Grassie, N., McNeill, I.C. and Cooke, I. (1968) Thermal degradation of polymer mixtures. I. Degradation of poly- styrene-poly (methyl methacrylate) mixtures and a com- parison with the degradation of styrene-methyl metha- crylate copolymers. Journal of Applied Polymer Science, 12, 831-837. [27] Horowitz, H. H. and Metzger, G. A. (1963) New analysis of thermogravimetric traces. Analytical Chemistry, 35, 1464-1468. [28] Flammability Test. UL94, ASTM D 635. [29] Sain, M., Park, S.H., Suhara, F. and Law, S. (2004) Flame retardant and mechanical properties of natural fi- bre-PP composites containing magnesium hydroxide. Polymer Degradation and Stability, 83(2), 363-367. [30] Smith, A.L. (1979) Applied infrared spectroscopy fun- damentals, techniques and analytical problem-solving. John Wiley and Sons, A Wiley-Interscience Publication, New York, 297&308. [31] Sadtler Research Laboratories (1974) The Sadtler Stan- dard Spectra. PA 5, Philadelphia. [32] Robinson, J.W. (1974) CRC Handbook of spectroscopy. CRC Press, Inc., USA, 2. [33] Szymanski, H.A. and Erikson, R. E. (1970) Infrared band handbook. 2nd Edition, IFI/Plenum, New York, 1-2. |