 Vol.3, No.1, 1-15 (2012) Journal of Bio physical Chemistry http://dx.doi.org/10.4236/jbpc.2012.31001 Thermodynamic contributions of 5’- and 3’-single strand dangling-ends to the stability of short duplex DNAs Rebekah Dickman1,2, Fidelis Manyanga1, Greg P. Brewood1, Daniel J. Fish1*, Cameron A. Fish1,3, Charlie Summers1,4, M. Todd Horne1, Albert S. Benight1,2 1Portland Bioscience, Inc., Portland, USA; *Corresponding Author: djf@pdxbio.com 2Portland State University, Portland, USA 3Cleveland High School, Portland, USA 4LaSalle Catholic College Preparatory, Milwaukee, USA Received 27 August 2011; revised 20 October 2011; accepted 11 November 2011 ABSTRACT Differential scanning calorimetry (DSC) melting analysis was performed on 27 short double stranded DNA duplexes containing 1 5 to 2 5 base pairs. Experimental duplexes were divided into two categories cont ainin g either t wo 5’ dangling- ends or one 5’ and one 3’ dangling-end. Duplex regions were incrementally reduced from 25 to 15 base pairs with a concurrent increase in length of dangling-ends from 1 to 10 bases. Blunt-ended duplexes from 15 to 25 base pairs served as controls. An additional set of mole- cules containing 21 base pair duplexes and a single four base dangling-end were also exa- mined. DSC melting curves were measured in varying concentrations of sodium ion (Na+). From these measurements, thermodynamic parame- ters for 5’ and 3’ dangling-ends were evaluated as a function of dangling end length. 5’ ends were found to be slightly stabilizing but essen- tially constant while the 3’ ends were desta- bilizing with increasing length of the dangling- end. 3’ ends also display a stronger depen- dence on Na+ concentration. In lower Na+ en- vironment, the 3’ ends were more destabilizing than in higher salt environment suggesting a more significant electrostatic component of the destabilizing interactions. Analysis of thermo- dynamic parameters of dangling ended dup- lexes as a function of Na+ concentration indicated the 3’ dangling ends behave differently than 5' dangling ended and blu nt-ended duplexes. Mole- cules with one 5’ and one 3’ dangling end showed variation in excess specific heat capacity (Cp) when compared to the blunt-ended molecule, while the molecules with two 5’ ends had Cp values that were essentially the same as blunt- ended duplexes. These observations suggested differences exist in duplexes with 3’ and 5’ dangling ends, which are interpreted in terms of composite differences in interactions with Na+, solvent, and terminal base pairs of the duplex. Keywords: DNA Thermodynamics; Dangling-Ends; DNA Stability 1. INTRODUCTION The generic scheme for the design of optimum probes for use in multiplex hybridization reactions involves two independent alignment and comparison steps [1-3]. In the first step, all possible probes of a given length cover- ing the targeted region of interest are generated and com- pared with one another in a pairwise fashion. All possible pairs of strands are aligned in an antiparallel manner and the thermodynamic stability is determined for each align- ment. In this process, the first alignment of two strands of the same length is the maximally overlapped one, with no single strand dangling ends. In subsequent alignments, one strand slides incrementally across the other, one base at a time, in the 5’ direction. Stability of the duplex at each alignment is determined from the number of com- plementary base pairs and mismatches in the overlap (duplex) region, and the contribution of the two 5’ dan- gling ends (both of the same length) on the ends of the duplex [4]. For each alignment, the length of the dan- gling ends increases with concomitant shortening of the overlap duplex region. Once all possible strands have been aligned and compared, and thermodynamic results processed, the optimum probe set can be determined. During the second stage of probe design, the optimum probe set must be scanned against the entire genome in Copyright © 2012 SciRes. OPEN A CCESS  R. Dickman et al. / Journal of Biophysical Chemistry 3 (2012) 1-15 2 which the target sequence resides [5-7]. In this step, the shorter (probe) strand is iteratively scanned against the much longer (target genome) strand, which offers a 5’ dangling end and 3’ dangling end at each alignment step. The primary aim of this work was evaluation of the thermodynamic contributions of the dangling single strand ends to duplex stability. If this is achieved, a more realis- tic thermodynamic stability can be determined at each alignment through inclusion of better thermodynamic parameters for the 5’ and 3’ dangling ends. In this study, the relative contributions of 5’ and 3’ dangling ends to overall duplex stability as a function of end length were quantitatively evaluated. Results ob- tained in three Na+ environments indicate 5’ ends were stabilizing while 3’ ends were neutral or destabilizing. Use of how evaluated parameters augment duplex stabil- ity calculations is demonstrated. 2. MATERIALS AND METHODS 2.1. DNA Molecules DNA strands for duplex molecules were purchased from Integrated DNA Technologies (IDT, Coralville, IA) and subjected to the standard desalting protocol per- formed by the supplier. As part of the design process, all sequences were inspected for potential intramolecular hairpin formation using the IDT oligoanalyzer [8]. Se- quence composition for the duplex was maintained around 50% G-C base pairs and thermodynamic screening was used to remove any molecules with potential intramole- cular structures above 20˚C. DNA strands were received from the supplier as a dried powder. 2.2. Quantification of Samples DNA solutions for DSC melting curves were solvated with NaCl (85, 300 or 1000 mM) and buffered in 10 mM Na2PO4 and 0.1 mM EDTA. Solution pH was adjusted to 7.3 ± 0.1 using an Orion 4-Star pH/Conductivity Meter (Thermo Electron Corporation, Beverly, MA). Further details of buffer preparation have been described else- where [9,10]. Samples were initially hydrated with 2.0 mL of 85 mM buffered sodium solution and allowed to stand for at least one hour at room temperature. Concen- trations of diluted single strand DNAs were determined by absorbance at 260 nm (A260) using the molar extinc- tion coefficient provided by the supplier [11,12]. DNA samples were diluted with buffer so that A260 values ranged from 0.2 - 0.9 optical density (OD) units. Ab- sorbance measurements were made using a Hewlett- Packard 8452A Diode Array Spectrophotometer (Hew- lett-Packard Corporation, Palo Alto, CA). Quartz cu- vettes having 1.0 cm path lengths were used. After con- centration determination, single strands were mixed in a 1:1 ratio and the final duplex concentration adjusted with buffer to around 1.0 mg/ml. Duplexes were annealed at room temperature for at least one hour prior to duplex characterization and melting experiments. After initial mixing, the A260 was noted and compared to the A260 value measured at higher temperatures well above the melting transition. This value was then used to estimate a suitable molar extinction coefficient for the duplex. Sub- sequently, duplex concentrations were determined from the low and high temperature A260 values. 2.3. Buffer Exchange To change the ionic strength of the buffer, sample solutions were transferred to a DNA Centricon YM-3 centrifugal filter (Millipore, Bedford, MA) having a molecular weight cut-off of 3000 Daltons. Samples were washed with 2 ml of nanopure water and spun for approximately 90 minutes at 4000 - 4500 rpm. An addi- tional 1 ml of nanopure water was added and the sample spun to dryness. Recovered samples were reconstituted in the desired buffer solution and stored at 4˚C. Following buffer exchange, sample concentrations were determined using optical absorbance measurements at 260 nm. Generally sample recovery was greater than 95%. A comparison of pre- and post-transition duplex absorbance values was used to assess possible degrada- tion. Sample quality was also determined by polyacryla- mide gel electrophoresis. Electrophoresis was performed on 12% polyacrylamide gels using a Hoeffer MiniVE, vertical electrophoresis mini gel system. Other details of DNA quantification protocols have been described else- where [6,13,14]. 2.4. Differential Scanning Calorimetry Thermodynamic parameters, ΔHcal and ΔScal, of the heat induced melting transitions of duplex DNAs were evaluated from measurements of the excess heat capacity, ΔCp, versus temperature values obtained by DSC measurements over the range of 10˚C to 120˚C. ΔCp values were made using a Nano-Differential Scanning Calorimeter (Calorimetry Sciences Corporation, Provo, UT). The instrument utilizes a two-cell design and electronic comparison scheme to measure excess heat capacity of a sample as it is heat denatured. Prior to loading, samples were degassed by bubbling with helium gas for 10 minutes. Experiments were performed under positive pressure (3 atm) with a heating rate of 2.0˚C/min. Concentrations of melted DNA samples were between 0.5 and 1.2 mg/ml. Multiple heating and cooling curves were collected for each sample and analyzed individually. Three different DSC instruments were used to collect the data. Variations in the thermodynamic parameters re- sulting from small differences in different DSC cell Copyright © 2012 SciRes. OPEN A CCESS  R. Dickman et al. / Journal of Biophysical Chemistry 3 (2012) 1-15 3 volumes were within experimental error (<10%). Re- gardless of the direction of transition (heating or cooling) or DSC employed, all melting curves were highly reproducible. Prior to measuring samples, a standard curve (i.e. buffer versus buffer curve) was taken at the same heating rate, over the same temperature range and at the same buffer concentration as sample melting curves. These curves were used to standardize subsequent DSC sample curves. 2.5. Data Analysis Analysis of DSC data was performed using the CpCalc 2.1 (Applied Thermodynamics, Middlesex, NY) software package supplied by the manufacturer. After being stan- dardized for machine noise by the buffer-buffer curve, ΔCp versus temperature curves were normalized for total DNA strand concentration, molecular mass, cell volume and partial specific volume. A progressive polynomial baseline was fit to connect linear regions in the lowest and highest temperature portions of the curve to allow for curve integration. The integrated area under the curve provided a measurement of the calorimetric transition enthalpy, ΔHcal, given by 2 1 d T cal p T CT T . (1) For all DSC melting experiments performed, values were measured from T1 = 10˚C to T2 = 120˚C. The corresponding calorimetric entropy, ΔScal, was determined by dividing by the tempera- ture and integrating over the same temperature range. p CT p CT 2 1 d Tp cal T CT ST T . (2) Reported values of the calorimetric free-energy, , were then determined at T = 298.15 K using the Gibb’s relation, cal GT cal calcal GHTS. (3) In the analyses performed, it was assumed that the overall difference in excess heat capacity from the be- ginning to the end of the melting transition was negligi- bly small, (i.e. 1pp ~ 0). Consequences of this assumption are that evaluated thermodynamic parameters are most accurate in the transition region and that the parameters are temperature independent. 2 CT CT 2.6. Sequence Design Short DNA molecules were used to evaluate the ther- modynamic contributions of single strand dangling ends on overall duplex stability. Duplexes were grouped into three sets according to the orientation of their dangling ends with respect to the core region. By design it is im- plicitly assumed the molecules studied can be partitioned into two separate regions: 1) a duplex region (of length nD) and 2) single strand dangling ends (of length nL). Explicit sequences are shown in Table 1. Blunt-ended control sequences, designated as set I, are shown in the column on the left. These core sequences range in length from 25 to 15 base pairs. Two types of single strand dan- gling ended molecules are also shown in Table 1. The set II molecules (center column) contain two 5’ dangling ends (5’/5’) and the set III molecules (right column) con- tain one 5’ and one 3’ dangling end (5’/3’). For all mole- cules of the same nD, the duplex sequence was main- tained to allow for relative thermodynamic calculations. In order to eliminate variations due to end stacking, the final (terminal) base pair at each end of the duplex was kept constant along with the initial base of the dangling end. Although core sequences were not identical, efforts were made to keep the composition of the duplex con- stant at 50% GC as the length of the central region was decreased. Duplex molecules shown in Ta b l e 1 are composed of two annealed single strands. For set II molecules the length of each strand was maintained at 25 base pairs. Here, the duplex region was decreased incrementally while the length of 5’ single strands on both ends was increased. Ten different dangling-ended sequences were studied with nD ranging from 24 to 15 base pairs and nL ranging from 1 to 10 bases. Likewise, for set III mole- cules, as duplex length decreased, the length of 5’ and 3’ dangling ends increased. To accomplish this, one strand was lengthened while the other shortened. Six different dangling ended sequences were studied with nD ranging from 24 to 17 base pairs and nL ranging from 1 to 8 bases. An additional set of molecules was employed to assess the additive properties of thermodynamic parameters found for dangling ended sequences. They are referred to as set IV molecules and are shown in Table 2. Briefly, they are the half molecules of set II and set III DNAs with a duplex core of 21 base pairs and a four base dan- gling end from one of the strands. For completeness, all four possible orientations of placement of the dangling end were included. 3. RESULTS 3.1. Dangling Ends Thermodynamic parameters measured as a function of sodium ion concentration ([Na+]) are listed in Table 3 for the 27 duplexes studied. Plots of ΔH versus TΔS were linear with a mean correlation coefficient of R2 = 0.96 for all molecules in the three Na+ environments (see Sup- plementary Figure 1). Such a high linearity is typically observed for short duplex melting and indicates entropy- nthalpy compensation. Although not fully understood, e Copyright © 2012 SciRes. OPEN A CCESS  R. Dickman et al. / Journal of Biophysical Chemistry 3 (2012) 1-15 Copyright © 2012 SciRes. OPEN A CCESS 4 Table 1. DNA sequences and controls. Set I duplexes are blunt-ended control molecules. Set II molecules show the duplexes in the first column (i.e. set I) having 5’ dangling ends on both strands of the duplex. For clarity, only sequences of the dangling ends are shown explicitly. The core duplex regions, matching the molecules of set I, are indicated by dashed lines. Sequences of set III mole- cules are given in the third column. For all molecules having a 5’ overhang, the terminal 5’ stack identity is retained (5’AC/3’G). For those having a 3’ overhang, the terminal 3’ stack is retained as (5’C/3’AG). I II III Control Sequences nD 5’/5’ Sequences nL5’/3’ Sequences 5’ CATCATCGAACTCAGGTCTCACTTG 3’ GTAGTAGCTTGAGTCCAGAGTGAAC 25 5’ CATCATCGAACCAGGTCTCACTTG 3’ GTAGTAGCTTGGTCCAGAGTGAAC 24 5’ A------------- -------------A 15’ A-------------A ------------- 5’ CATCATCGACCAGGCTTCACTTG 3’ GTAGTAGCTGGTCCGAAGTGAAC 23 5’ GA------------ ------------AG 25’ GA------------AG ------------ 5’ CAAGTGATCGCTGAGAGAGTTG 3’ GTTCACTAGCGACTCTCTCAAC 22 5’ AGA----------- -----------AGA 35’ AGA-----------AGA ----------- 5’ CATGTGATCGCTAGTGAGATG 3’ GTACACTAGCGATCACTCATC 21 5’ TAGA---------- ----------AGAT 45’ TAGA----------AGAT ---------- 5’ CATCTCACAGCGATCACTTG 3’ GTAGAGTGTCGCTAGTGAAC 20 5’ CTAGA--------- ---------AGATC 5 5’ CATCTCACAGCGTAACTTG 3’ GTAGAGTGTCGCATTGAAC 19 5’ CCTAGA-------- --------AGATCC 65’ CCTAGA--------AGATCC -------- 5’ CATCACAGGCGTTACATG 3’ GTAGTGTCCGCAATGTAC 18 5’ TCCTAGA------- -------AGATCCT 7 5’ CATCCGACTCTGCAATG 3’ GTAGGCTGAGACGTTAC 17 5’ ATCCTAGA------ ------AGATCCTA 85’ATCCTAGA------AGATCCTA ------ 5’ CATTCGAAGTCCAGTG 3’ GTAAGCTTCAGGTCAC 16 5’ GATCCTAGA----- -----AGATCCTAG 9 5’ CATAGCTGCACGTTG 3’ GTATCGACGTGCAAC 15 5’ TGATCCTAGA---- ----AGATCCTAGT 10 Table 2. Sequences for set IV molecules. Duplex sequences with either one 3’ or 5’ dangling end and one blunt end. The dashed duplex region is given by the duplex sequence shown in Table 1 for nD = 21 and nL = 4. IV Sequences nD n L a 5’ TAGA---------- ---------- 21 4 b 5’ ---------- ----------AGAT 21 4 c 5’ ----------TAGA ---------- 21 4 d 5’ ---------- TAGA---------- 21 4 such behavior is reportedly typical for melting of short duplex DNAs [1-3]. Apparently there is only a slight dependence of the slopes and intercepts on the concen- tration of sodium ions. 3.2. Thermodynamic Contributions to Duplex Stability From the data of Table 3, quantitative estimates can be made on thermodynamic contributions of both 5’ and 3’ dangling ends to duplex stability. The melting thermo- dynamics of short blunt-ended duplexes can be predicted with reasonable accuracy using the nearest-neighbor (n-n) model and corresponding sets of sequence dependent stability parameters [4,5]. The n-n model assumes the duplex region for a dangling ended molecule has the same calculated thermodynamic stability as the matching blunt ended duplex. Thus, the thermodynamic parameters of short duplex DNAs can be reliably parsed into two distinct contributions, those from the duplex region, and those from dangling ends. Following this principle, by preserving the duplex region and varying only the se- quences of the dangling ends, it should be possible to determine individual contributions from dangling ends. Of course, reliability of this estimate assumes that inter- actions between the duplex and single strand regions are separable as described, and that the duplex region and inherent structure and stability remain unaffected (in a thermodynamic sense) by the presence of dangling ends. 3.3. Thermodynamic Characterization Given the set of DNA molecules and thermodynamic arameters evaluated, and under the umbrella of the afo- p 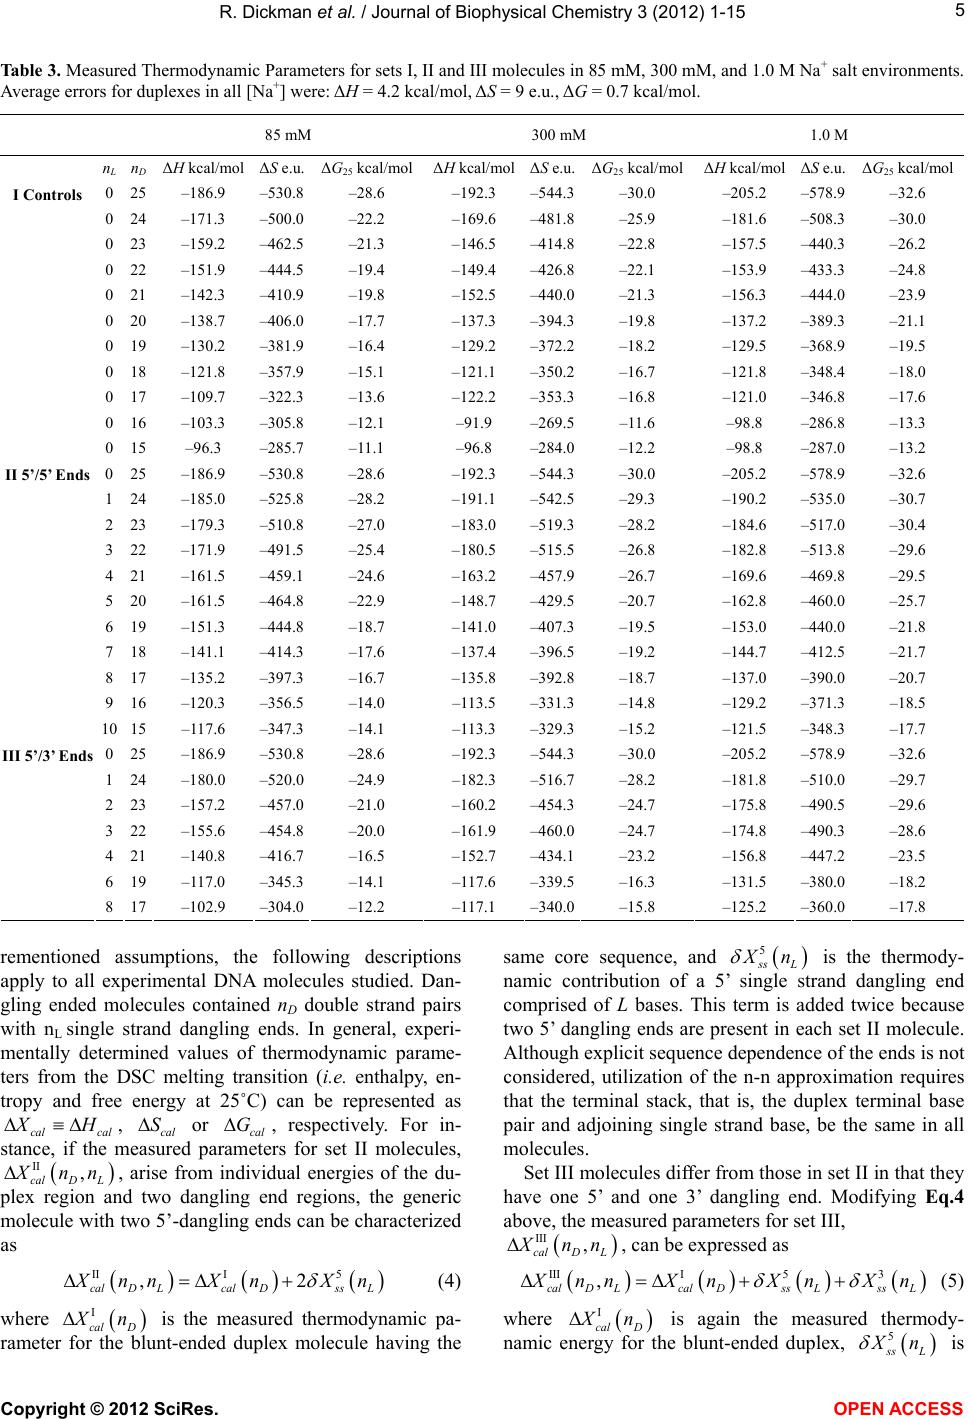 R. Dickman et al. / Journal of Biophysical Chemistry 3 (2012) 1-15 5 Table 3. Measured Thermodynamic Parameters for sets I, II and III molecules in 85 mM, 300 mM, and 1.0 M Na+ salt environments. Average errors for duplexes in all [Na+] were: ΔH = 4.2 kcal/mol, ΔS = 9 e.u., ΔG = 0.7 kcal/mol. 85 mM 300 mM 1.0 M nL n D ΔH kcal/molΔS e.u. ΔG25 kcal/molΔH kcal/molΔS e.u.ΔG25 kcal/molΔH kcal/mol ΔS e.u. ΔG25 kcal/mol 0 25 –186.9 –530.8 –28.6 –192.3 –544.3–30.0 –205.2 –578.9 –32.6 0 24 –171.3 –500.0 –22.2 –169.6 –481.8–25.9 –181.6 –508.3 –30.0 0 23 –159.2 –462.5 –21.3 –146.5 –414.8–22.8 –157.5 –440.3 –26.2 0 22 –151.9 –444.5 –19.4 –149.4 –426.8–22.1 –153.9 –433.3 –24.8 0 21 –142.3 –410.9 –19.8 –152.5 –440.0–21.3 –156.3 –444.0 –23.9 0 20 –138.7 –406.0 –17.7 –137.3 –394.3–19.8 –137.2 –389.3 –21.1 0 19 –130.2 –381.9 –16.4 –129.2 –372.2–18.2 –129.5 –368.9 –19.5 0 18 –121.8 –357.9 –15.1 –121.1 –350.2–16.7 –121.8 –348.4 –18.0 0 17 –109.7 –322.3 –13.6 –122.2 –353.3–16.8 –121.0 –346.8 –17.6 0 16 –103.3 –305.8 –12.1 –91.9 –269.5–11.6 –98.8 –286.8 –13.3 I Controls 0 15 –96.3 –285.7 –11.1 –96.8 –284.0–12.2 –98.8 –287.0 –13.2 0 25 –186.9 –530.8 –28.6 –192.3 –544.3–30.0 –205.2 –578.9 –32.6 1 24 –185.0 –525.8 –28.2 –191.1 –542.5–29.3 –190.2 –535.0 –30.7 2 23 –179.3 –510.8 –27.0 –183.0 –519.3–28.2 –184.6 –517.0 –30.4 3 22 –171.9 –491.5 –25.4 –180.5 –515.5–26.8 –182.8 –513.8 –29.6 4 21 –161.5 –459.1 –24.6 –163.2 –457.9–26.7 –169.6 –469.8 –29.5 5 20 –161.5 –464.8 –22.9 –148.7 –429.5–20.7 –162.8 –460.0 –25.7 6 19 –151.3 –444.8 –18.7 –141.0 –407.3–19.5 –153.0 –440.0 –21.8 7 18 –141.1 –414.3 –17.6 –137.4 –396.5–19.2 –144.7 –412.5 –21.7 8 17 –135.2 –397.3 –16.7 –135.8 –392.8–18.7 –137.0 –390.0 –20.7 9 16 –120.3 –356.5 –14.0 –113.5 –331.3–14.8 –129.2 –371.3 –18.5 II 5’/5’ Ends 10 15 –117.6 –347.3 –14.1 –113.3 –329.3–15.2 –121.5 –348.3 –17.7 0 25 –186.9 –530.8 –28.6 –192.3 –544.3–30.0 –205.2 –578.9 –32.6 1 24 –180.0 –520.0 –24.9 –182.3 –516.7–28.2 –181.8 –510.0 –29.7 2 23 –157.2 –457.0 –21.0 –160.2 –454.3–24.7 –175.8 –490.5 –29.6 3 22 –155.6 –454.8 –20.0 –161.9 –460.0–24.7 –174.8 –490.3 –28.6 4 21 –140.8 –416.7 –16.5 –152.7 –434.1–23.2 –156.8 –447.2 –23.5 6 19 –117.0 –345.3 –14.1 –117.6 –339.5–16.3 –131.5 –380.0 –18.2 III 5’/3’ Ends 8 17 –102.9 –304.0 –12.2 –117.1 –340.0–15.8 –125.2 –360.0 –17.8 rementioned assumptions, the following descriptions apply to all experimental DNA molecules studied. Dan- gling ended molecules contained nD double strand pairs with nL single strand dangling ends. In general, experi- mentally determined values of thermodynamic parame- ters from the DSC melting transition (i.e. enthalpy, en- tropy and free energy at 25˚C) can be represented as cal cal H II , calD L , cal or cal , respectively. For in- stance, if the measured parameters for set II molecules, S G nn, arise from individual energies of the du- plex region and two dangling end regions, the generic molecule with two 5’-dangling ends can be characterized as III 5 ,2 cal DLcal Dss L nnXnX n (4) where I cal D n is the measured thermodynamic pa- rameter for the blunt-ended duplex molecule having the same core sequence, and 5 sL n is the thermody- namic contribution of a 5’ single strand dangling end comprised of L bases. This term is added twice because two 5’ dangling ends are present in each set II molecule. Although explicit sequence dependence of the ends is not considered, utilization of the n-n approximation requires that the terminal stack, that is, the duplex terminal base pair and adjoining single strand base, be the same in all molecules. Set III molecules differ from those in set II in that they have one 5’ and one 3’ dangling end. Modifying Eq.4 above, the measured parameters for set III, III , calD L nn, can be expressed as I 3 , calDLcalDssL III 5 ss L nnXXn n Xn (5) where I cal D n is again the measured thermody- namic energy for the blunt-ended duplex, 5 sL n is Copyright © 2012 SciRes. OPEN A CCESS 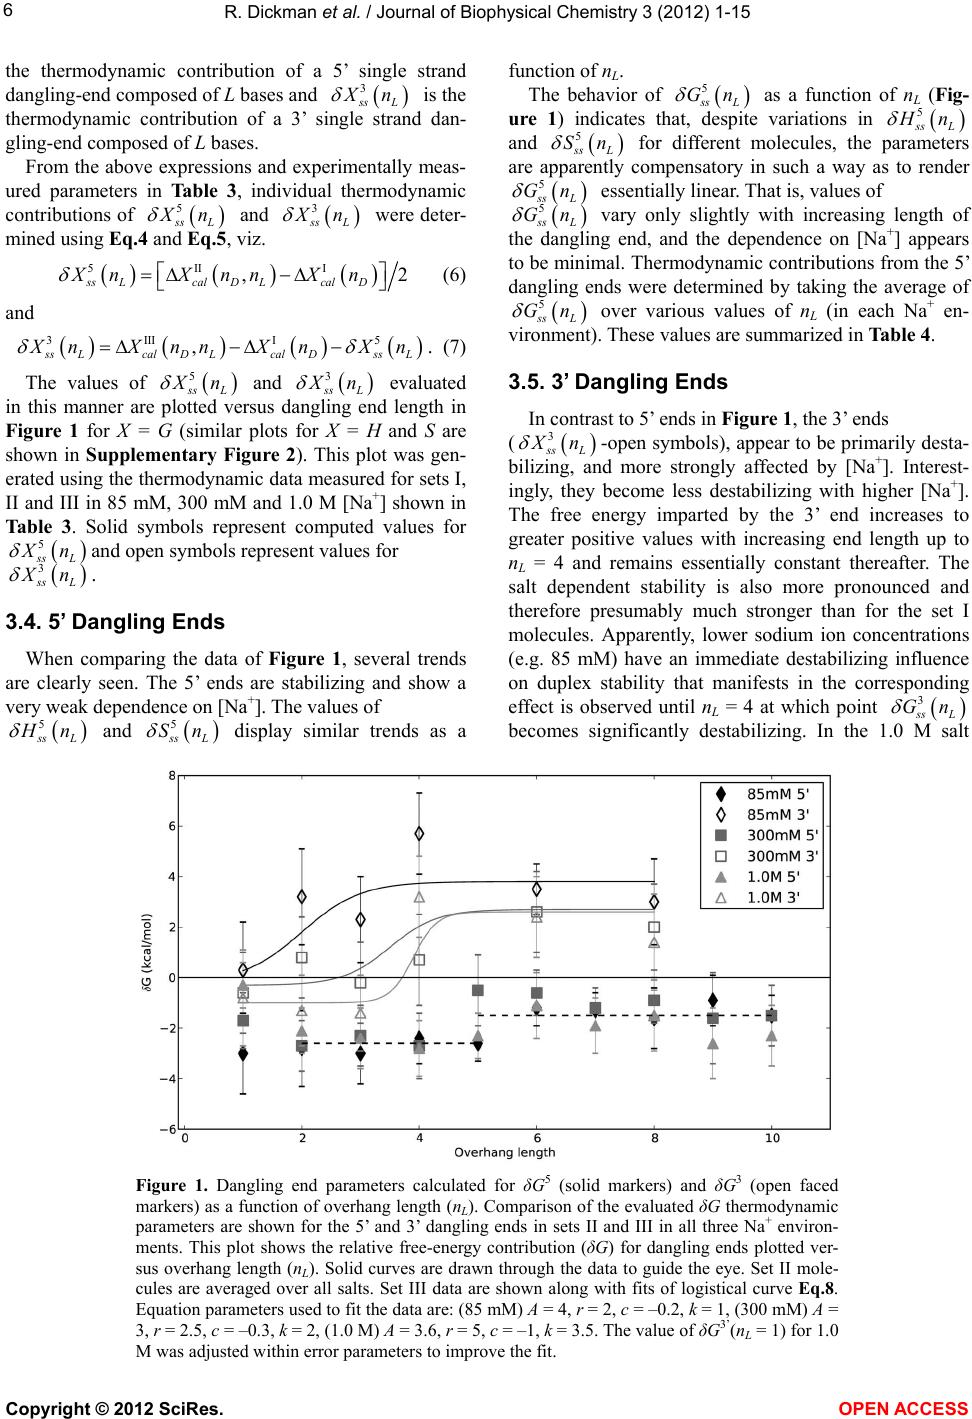 R. Dickman et al. / Journal of Biophysical Chemistry 3 (2012) 1-15 6 the thermodynamic contribution of a 5’ single strand dangling-end composed of L bases and 3 sL n is the thermodynamic contribution of a 3’ single strand dan- gling-end composed of L bases. From the above expressions and experimentally meas- ured parameters in Table 3, individual thermodynamic contributions of 5 sL n and 3 sL n were deter- mined using Eq.4 and Eq.5 , viz. 5II I , ssLcal DLcalD XnX nnX n 2 (6) and 3IIII 5 , sLcalDL calDssL nXnnXnXn . (7) The values of 5 sL n and 3 sL n evaluated in this manner are plotted versus dangling end length in Figure 1 for X = G (similar plots for X = H and S are shown in Supplementary Figure 2). This plot was gen- erated using the thermodynamic data measured for sets I, II and III in 85 mM, 300 mM and 1.0 M [Na+] shown in Table 3. Solid symbols represent computed values for 5 sL n 3 and open symbols represent values for sL n . 3.4. 5’ Dangling Ends When comparing the data of Figure 1, several trends are clearly seen. The 5’ ends are stabilizing and show a very weak dependence on [Na+]. The values of 5 sL n and 5 sL Sn display similar trends as a function of nL. The behavior of 5 sL Gn as a function of nL (Fig- ure 1) indicates that, despite variations in 5 sL n and 5 s Sn L for different molecules, the parameters are apparently compensatory in such a way as to render 5 sL Gn essentially linear. That is, values of 5 sL vary only slightly with increasing length of the dangling end, and the dependence on [Na+] appears to be minimal. Thermodynamic contributions from the 5’ dangling ends were determined by taking the average of Gn 5 sL over various values of nL (in each Na+ en- vironment). These values are summarized in Table 4. Gn 3.5. 3’ Dangling Ends In contrast to 5’ ends in Figure 1, the 3’ ends ( 3 sL n -open symbols), appear to be primarily desta- bilizing, and more strongly affected by [Na+]. Interest- ingly, they become less destabilizing with higher [Na+]. The free energy imparted by the 3’ end increases to greater positive values with increasing end length up to nL = 4 and remains essentially constant thereafter. The salt dependent stability is also more pronounced and therefore presumably much stronger than for the set I molecules. Apparently, lower sodium ion concentrations (e.g. 85 mM) have an immediate destabilizing influence on duplex stability that manifests in the corresponding effect is observed until nL = 4 at which point 3 sL Gn becomes significantly destabilizing. In the 1.0 M salt Figure 1. Dangling end parameters calculated for δG5 (solid markers) and δG3 (open faced markers) as a function of overhang length (nL). Comparison of the evaluated δG thermodynamic parameters are shown for the 5’ and 3’ dangling ends in sets II and III in all three Na+ environ- ments. This plot shows the relative free-energy contribution (δG) for dangling ends plotted ver- sus overhang length (nL). Solid curves are drawn through the data to guide the eye. Set II mole- cules are averaged over all salts. Set III data are shown along with fits of logistical curve Eq.8. Equation parameters used to fit the data are: (85 mM) A = 4, r = 2, c = –0.2, k = 1, (300 mM) A = 3, r = 2.5, c = –0.3, k = 2, (1.0 M) A = 3.6, r = 5, c = –1, k = 3.5. The value of δG3’(nL = 1) for 1.0 M was adjusted within error parameters to improve the fit. Copyright © 2012 SciRes. OPEN A CCESS 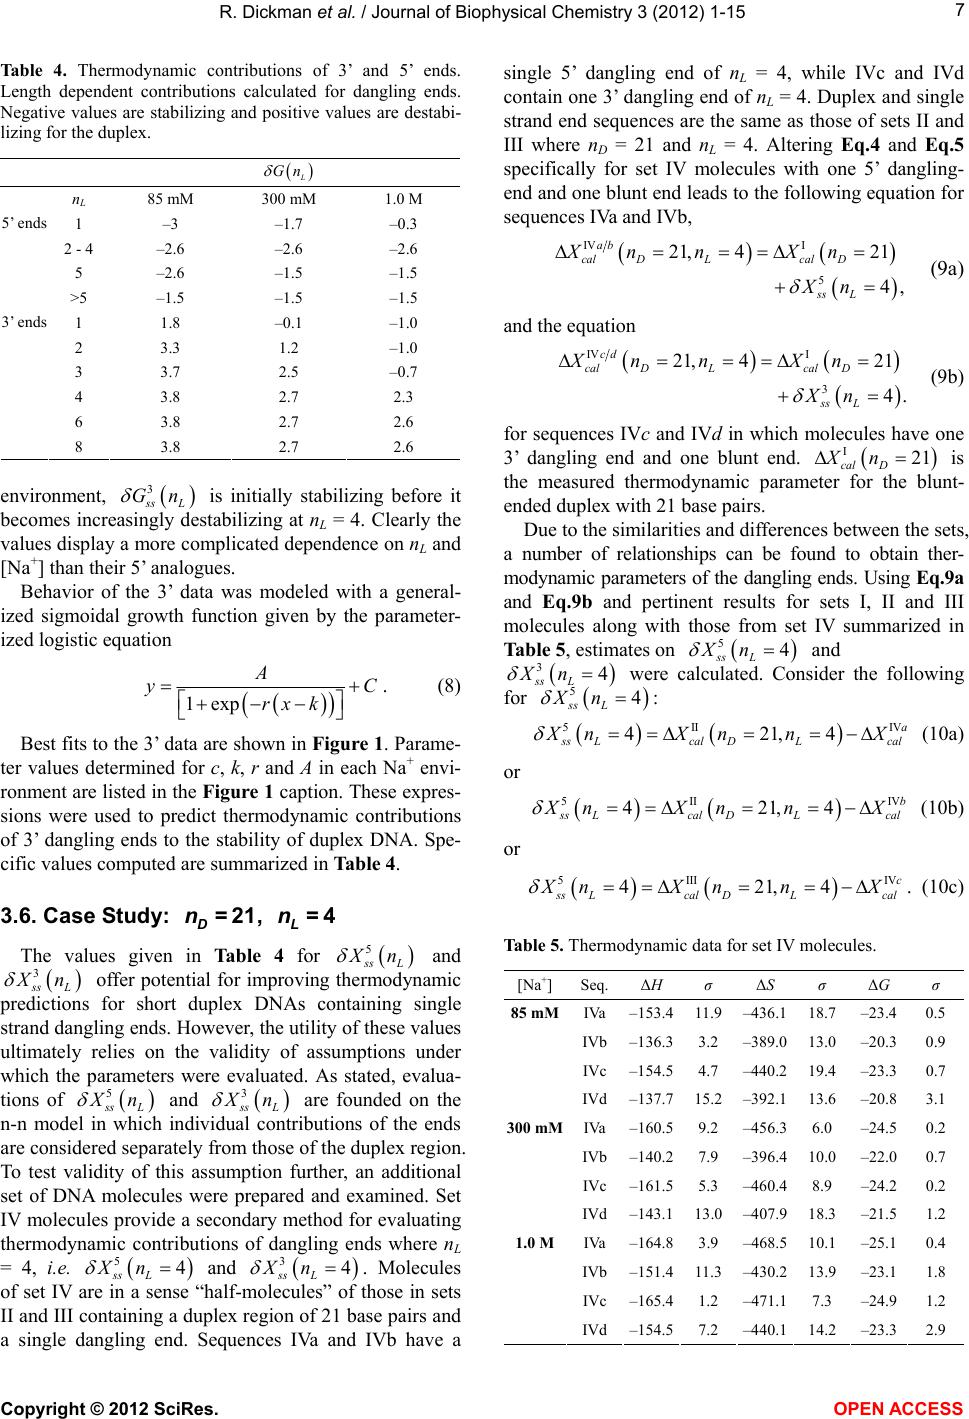 R. Dickman et al. / Journal of Biophysical Chemistry 3 (2012) 1-15 7 Table 4. Thermodynamic contributions of 3’ and 5’ ends. Length dependent contributions calculated for dangling ends. Negative values are stabilizing and positive values are destabi- lizing for the duplex. L Gn nL 85 mM 300 mM 1.0 M 1 –3 –1.7 –0.3 2 - 4 –2.6 –2.6 –2.6 5 –2.6 –1.5 –1.5 5’ ends >5 –1.5 –1.5 –1.5 1 1.8 –0.1 –1.0 2 3.3 1.2 –1.0 3 3.7 2.5 –0.7 4 3.8 2.7 2.3 6 3.8 2.7 2.6 3’ ends 8 3.8 2.7 2.6 environment, 3 sL Gn is initially stabilizing before it becomes increasingly destabilizing at nL = 4. Clearly the values display a more complicated dependence on nL and [Na+] than their 5’ analogues. Behavior of the 3’ data was modeled with a general- ized sigmoidal growth function given by the parameter- ized logistic equation 1exp A yC rx k . (8) Best fits to the 3’ data are shown in Figure 1. Parame- ter values determined for c, k, r and A in each Na+ envi- ronment are listed in the Figure 1 caption. These expres- sions were used to predict thermodynamic contributions of 3’ dangling ends to the stability of duplex DNA. Spe- cific values computed are summarized in Table 4. 3.6. Case Study: , D n=21L n=4 The values given in Table 4 for 5 sL n and 3 sL n offer potential for improving thermodynamic predictions for short duplex DNAs containing single strand dangling ends. However, the utility of these values ultimately relies on the validity of assumptions under which the parameters were evaluated. As stated, evalua- tions of 5 sL n and 3 sL n 3 Xn are founded on the n-n model in which individual contributions of the ends are considered separately from those of the duplex region. To test validity of this assumption further, an additional set of DNA molecules were prepared and examined. Set IV molecules provide a secondary method for evaluating thermodynamic contributions of dangling ends where nL = 4, i.e. and ssL. Molecules of set IV are in a sense “half-molecules” of those in sets II and III containing a duplex region of 21 base pairs and a single dangling end. Sequences IVa and IVb have a single 5’ dangling end of nL = 4, while IVc and IVd contain one 3’ dangling end of nL = 4. Duplex and single strand end sequences are the same as those of sets II and III where n D = 21 and nL = 4. Altering Eq.4 and Eq.5 specifically for set IV molecules with one 5’ dangling- end and one blunt end leads to the following equation for sequences IVa and IVb, 5 ss L Xn4 4 IV I 5 21, 421 4, ab calDLcal D ss L Xn nXn Xn (9a) and the equation IV I 3 21, 421 4. cd calDLcal D ss L Xn nXn Xn (9b) for sequences IVc and IVd in which molecules have one 3’ dangling end and one blunt end. is the measured thermodynamic parameter for the blunt- ended duplex with 21 base pairs. I21 cal D Xn Due to the similarities and differences between the sets, a number of relationships can be found to obtain ther- modynamic parameters of the dangling ends. Using Eq.9a and Eq.9b and pertinent results for sets I, II and III molecules along with those from set IV summarized in Table 5, estimates on and 54 ss L Xn 34 ss L Xn were calculated. Consider the following for 4 5 ss L Xn : 421,4 a5II IV sLcalDLcal nXnn X (10a) or 5II 421,4 bIV sLcalDLcal nXnn X (10b) or 5 IIIIV 421,4 c sLcalDLcal nXnn X. (10c) Table 5. Thermodynamic data for set IV molecules. [Na+]Seq. ΔH σ ΔS σ ΔG σ IVa –153.411.9–436.1 18.7 –23.40.5 IVb–136.3 3.2 –389.0 13.0 –20.30.9 IVc–154.5 4.7 –440.2 19.4 –23.30.7 85 mM IVd–137.7 15.2–392.1 13.6 –20.83.1 IVa –160.59.2 –456.3 6.0 –24.50.2 IVb–140.2 7.9 –396.4 10.0 –22.00.7 IVc–161.5 5.3 –460.4 8.9 –24.20.2 300 mM IVd–143.1 13.0–407.9 18.3 –21.51.2 IVa –164.83.9 –468.5 10.1 –25.10.4 IVb–151.4 11.3 –430.2 13.9 –23.11.8 IVc–165.4 1.2 –471.1 7.3 –24.91.2 1.0 M IVd–154.5 7.2 –440.1 14.2 –23.32.9 Copyright © 2012 SciRes. OPEN A CCESS 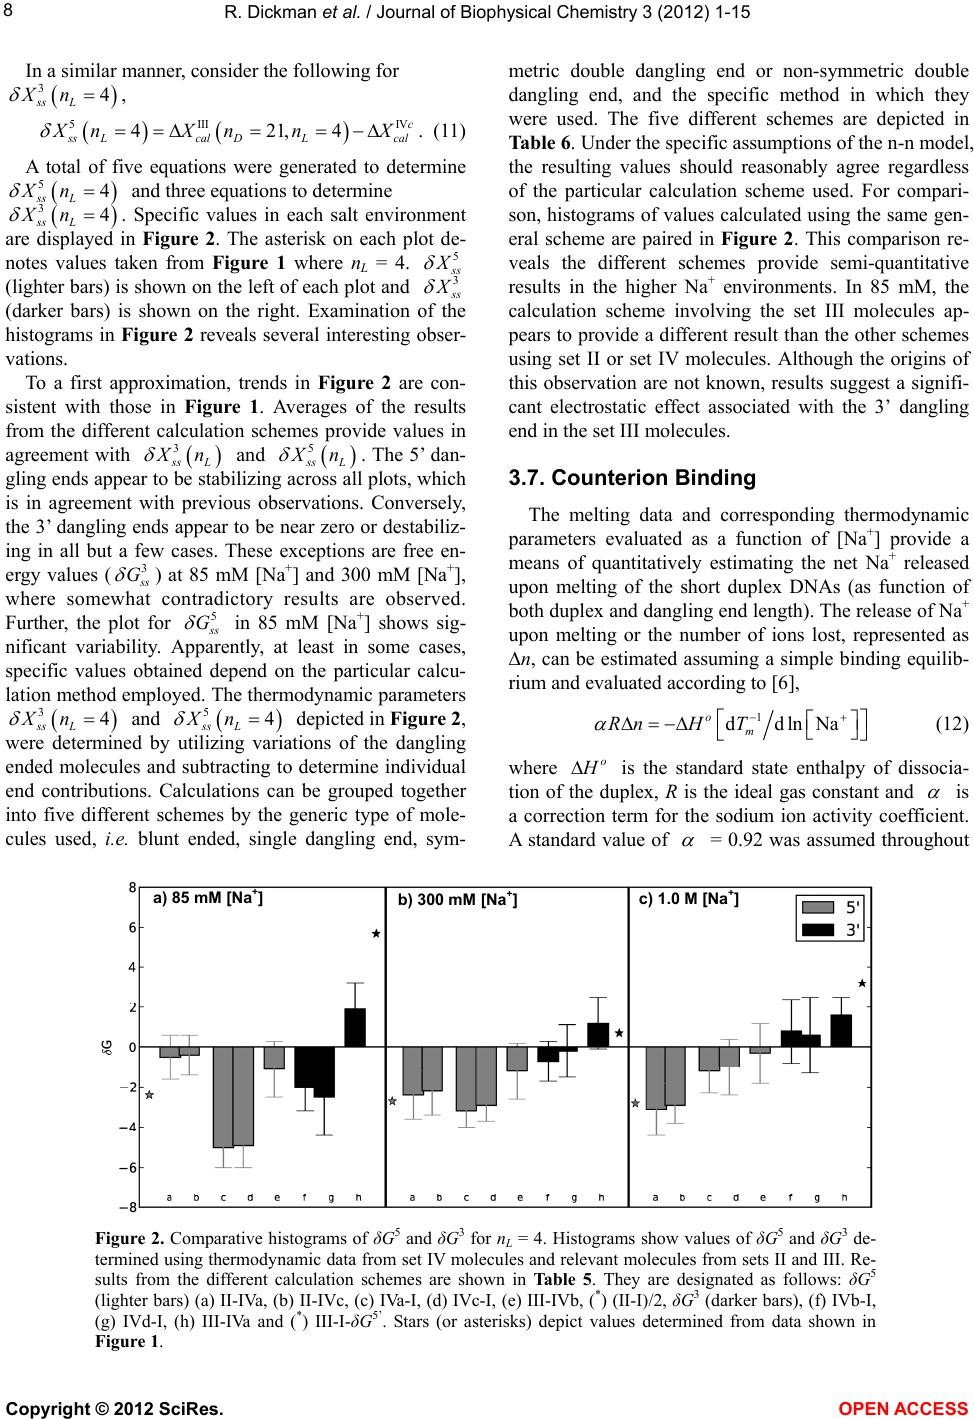 R. Dickman et al. / Journal of Biophysical Chemistry 3 (2012) 1-15 8 In a similar manner, consider the following for , 34 ss L Xn 5III 421,4 cIV sLcalDLcal nXnn X . (11) A total of five equations were generated to determine and three equations to determine . Specific values in each salt environment are displayed in Figure 2. The asterisk on each plot de- notes values taken from Figure 1 where nL = 4. 54 ss L Xn 34 ss L Xn 5 s 3 (lighter bars) is shown on the left of each plot and s (darker bars) is shown on the right. Examination of the histograms in Figure 2 reveals several interesting obser- vations. To a first approximation, trends in Figure 2 are con- sistent with those in Figure 1. Averages of the results from the different calculation schemes provide values in agreement with 3 sL n and 5 sL n . The 5’ dan- gling ends appear to be stabilizing across all plots, which is in agreement with previous observations. Conversely, the 3’ dangling ends appear to be near zero or destabiliz- ing in all but a few cases. These exceptions are free en- ergy values (3 s 5 G ) at 85 mM [Na+] and 300 mM [Na+], where somewhat contradictory results are observed. Further, the plot for s G 5 Xn in 85 mM [Na+] shows sig- nificant variability. Apparently, at least in some cases, specific values obtained depend on the particular calcu- lation method employed. The thermodynamic parameters and ssL 34 ss L Xn 4 depicted in Figure 2, were determined by utilizing variations of the dangling ended molecules and subtracting to determine individual end contributions. Calculations can be grouped together into five different schemes by the generic type of mole- cules used, i.e. blunt ended, single dangling end, sym- metric double dangling end or non-symmetric double dangling end, and the specific method in which they were used. The five different schemes are depicted in Table 6. Under the specific assumptions of the n-n model, the resulting values should reasonably agree regardless of the particular calculation scheme used. For compari- son, histograms of values calculated using the same gen- eral scheme are paired in Figure 2. This comparison re- veals the different schemes provide semi-quantitative results in the higher Na+ environments. In 85 mM, the calculation scheme involving the set III molecules ap- pears to provide a different result than the other schemes using set II or set IV molecules. Although the origins of this observation are not known, results suggest a signifi- cant electrostatic effect associated with the 3’ dangling end in the set III molecules. 3.7. Counterion Binding The melting data and corresponding thermodynamic parameters evaluated as a function of [Na+] provide a means of quantitatively estimating the net Na+ released upon melting of the short duplex DNAs (as function of both duplex and dangling end length). The release of Na+ upon melting or the number of ions lost, represented as ∆n, can be estimated assuming a simple binding equilib- rium and evaluated according to [6], 1 ddlnNa o m RnH T (12) where o is the standard state enthalpy of dissocia- tion of the duplex, R is the ideal gas constant and is a correction term for the sodium ion activity coefficient. A standard value of = 0.92 was assumed throughout a) 85 mM [Na + ] b) 300 mM [Na + ]c) 1.0 M [Na + ] Figure 2. Comparative histograms of δG5 and δG3 for nL = 4. Histograms show values of δG5 and δG3 de- termined using thermodynamic data from set IV molecules and relevant molecules from sets II and III. Re- sults from the different calculation schemes are shown in Table 5. They are designated as follows: δG5 (lighter bars) (a) II-IVa, (b) II-IVc, (c) IVa-I, (d) IVc-I, (e) III-IVb, (*) (II-I)/2, δG3 (darker bars), (f) IVb-I, (g) IVd-I, (h) III-IVa and (*) III-I-δG5’. Stars (or asterisks) depict values determined from data shown in Figure 1. Copyright © 2012 SciRes. OPEN A CCESS  R. Dickman et al. / Journal of Biophysical Chemistry 3 (2012) 1-15 9 Table 6. Calculated thermodynamic data for dangling ends by method of subtraction. The dashed duplex region is given by the du- plex sequence shown in Table 1 for nD = 21 and nL = 4. Scheme Sequences Compared Parameter 5’ TAGA---------- ----------AGAT − 5’ TAGA---------- ---------- δG5 1 5’ TAGA---------- ----------AGAT – 5’ ---------- ----------AGAT δG5 5’ TAGA---------- ---------- – 5’ ---------- ---------- δG5 5’ ---------- ----------AGAT – 5’ ---------- ---------- δG5 5’ ---------- TAGA ---------- – 5’ ---------- ---------- δG3 2 5’ ---------- TAGA---------- – 5’ ---------- ---------- δG3 5’ TAGA----------AGAT ---------- – 5’ ----------TAGA ---------- δG5 3 5’ TAGA----------AGAT ---------- – 5’ TAGA---------- ---------- δG3 4 [ 5’ TAGA---------- ----------AGAT – 5’ ---------- ---------- ] × (1/2) δG5 5 5’ TAGA----------AGAT ---------- – 5’ ---------- ---------- – δG5 δG3 [6]. From linear fits of versus 1 m TK ln Na plots, the slopes in Eq.12, 1 ddT lnNa m , and Δn were evaluated for sets I, II and III duplexes. For comparison, the counterion release per phosphate nN (13) was plotted versus dangling end length for sets I, II and III duplexes and is shown in Figure 3. For these calcula- tions N is the total number of phosphates in the duplex, including those in the single strand ends. A close inspection of the plots in Figure 3 reveals in- Figure 3. Counterions released: ΔΨ (the net counterion re- leased per phosphate) versus nL for the three main molecule sets. teresting behaviors for as a function of decreasing duplex length (and subsequent increase of the dangling end length) for all three sets. For the set I and set II molecules, decreases stepwise with decreasing duplex length and is essentially identical for both types of duplexes. For the set III molecules, decreases following a similar trend, but is approximately 15% smaller at each point on the plot. These data indicate a net lower amount of Na+ released per phosphate (on av- erage) during the melting process for set III molecules compared to sets I and II. Since relatively higher charge density of the duplex compared to single strands is the underlying origin of counterions released upon duplex melting, the fact that set I and set II molecules display similar counterion re- lease curves suggests the duplexes have similar charge densities. More importantly, the ends must behave simi- larly (in a counterion binding sense) and have similar charge densities and counterion binding properties re- gardless of end type. Conversely, the observed behavior for set III molecules suggests several plausible scenarios. Either the 3’ single strand dangling ends bind less Na+ compared to the 5’ single strand dangling ends, while the duplex binds counterions to the same extent, or the du- plex adjoined by a 3’ end is perturbed to an extent that decreases the local duplex charge density and results in overall less counterion binding to the duplex state, and consequently a net lowering of the counterions released upon melting. Both scenarios will be further considered below. Copyright © 2012 SciRes. OPEN A CCESS  R. Dickman et al. / Journal of Biophysical Chemistry 3 (2012) 1-15 10 3.8. Heat Capacities of Dangling Ends In DSC experiments, the thermodynamic parameters of the melting transition, cal and cal are evalu- ated from the area under the melting curve, S p CT versus Temperature. The experimental transition en- thalpy is given by, ΔΔ oo cal p THHCTT (14) where is an arbitrary reference temperature and o T is a correction term for small variations in different salt environments. Generally for short duplex DNA the assumption is made that differences between and are small in the transition region where the thermo- dynamic parameters are evaluated, thus o T 0 T p C [1]. As a matter of practice, calculated values of ca l and cal are routinely used to predict thermodynamic sta- bilities of duplexes at temperatures far below (37˚C) the actual transition region (55˚C - 75˚C), where there is more biological relevance and where practical applica- tions occur. The accuracy of such predictions relies on the validity of the assumption that evaluated parameters are temperature independent and the overall change in excess heat capacity ( S C). If then the ther- modynamic parameters evaluated from analysis of the melting transition region may not be accurate for predic- tions at lower temperatures. 0 p C As the technology to measure these transitions has grown in sophistication and precision over the past 15 years, some studies have reported the existence of a rela- tive standard transition heat capacity for all DNA du- plexes. Estimates for this value are as high as 100 cal·deg–1·(mol·base·pair)–1 and vary slightly with se- quence and salt [2,3,7]. Recently, the average value of cal·deg–1·(mol·base·p air)–1 has been reported as a good approximation [8]. Inclusion of the 64.6 21.4 p C C parameter allows for more accurate predictions of the transition enthalpy and entropy at temperatures below the transition region [6,7]. For dangling ended molecules, a question arises re- garding their effect on, and contributions to C . To address this question, plots of cal versus m T in all Na+ environments for sets I, II and III were constructed and are shown in Figure 4. Using all of the data, each set of molecules displays a different linear slope. Values of C determined from slopes are 31.2 cal·deg–1·base pair–1 for set I, 25.1 cal·deg–1·base·pair–1 for set II, and 68.9 cal·deg–1·base·pair–1 for set III. These values for sets I and II differ somewhat from the average reported C value of 64.6 ± 21.4 cal·deg–1·(mol·base·pair)–1. However, if values from the lowest [Na+] are omitted, C val- ues of 54.1, 54.6, 85.2 cal·deg–1·b ase·pa ir–1 are found for sets I, II and III respectively, which is in reasonable agreement with the reported best value. Figure 4. m vs Tm for each type of molecule in all salts. Set II molecules display a ΔCp value of 25.1 cal·deg–1·base·pair–1, set III molecules have 68.9 cal·deg–1·base·pair–1 and ΔCp for set I molecules is 31.2 cal·deg–1·base·pair–1. HT Differences in C values for each type of duplex were estimated using Eq.14. For each dangling-ended duplex, the difference between transition enthalpies of the dangling ended molecule of set II and corresponding blunt-ended molecule of set I, evaluated at the transition temperature of the corresponding dangling-ended duplex, , is II m T IIII IIIIo mp mm TTHHCT T (15) where II IIII p CC p C is the difference in the heat capacities of the dangling-ended duplexes of set II and the corresponding blunt-ended duplexes of set I. Clearly a plot of II m TT II I p C versus should have a slope of II m T , viz. IIIIII I dd mm p TT TC . (16) An analogous expression for can also be found with . If there were no difference in III I p C III m TT C for set II and set I molecules, a plot of II I p C III I p C versus would produce a line having zero slope. Such a line is seen in Figure 5 for the dangling ended molecules of set II. Conversely, if a plot of versus produces a line having some non-zero slope, as observed in Figure 5 for the set III dangling ended molecules, additional factors related to the dangling ends must con- tribute to their II m T III m T C . The slope for set III molecules from the plot in Figure 5 provides an estimated value of cal·deg–1·base·pair–1, which is in excess to IIII p C52.5 C of the blunt ended molecule. Thus, if the re- ported average value of p cal·deg–1·base pair–1 for the blunt-ended molecules is used, an estimated 64.6C 117 cal·deg–1·base·pair–1 is found for the set III molecules. Inclusion of this difference with the noted Copyright © 2012 SciRes. OPEN A CCESS  R. Dickman et al. / Journal of Biophysical Chemistry 3 (2012) 1-15 11 Figure 5. m vs Tm for each type of molecule in all salts. As compared to the set I molecules, set II molecules dis- play a ΔΔCp = –5.8 cal·deg–1·base·pair–1 and set III molecules have ΔΔCp = 52.5 cal·deg–1·base·pair–1. HT difference in sodium release per phosphate further sug- gests changes in the set III duplexes. These will be dis- cussed in more detail below. 4. DISCUSSION 4.1. 5’ Dangling Ends A number of factors are involved in determining the relative influence a dangling single strand end will have on the adjoining duplex. These include: the type of molecule (i.e. whether it is DNA or RNA), identities of the terminal duplex base pair and initial dangling-end base, and relative orientation of the first dangling base with respect to the terminal duplex base pair. Here, the duplex terminal base pair and adjoining single strand base were held constant in order to focus on relative ef- fects of the end position (5’ versus 3’) as a function of increasing length. Previous studies have examined ther- modynamic contributions of various permutations and combinations of dangling end length, end sequence and sequence of terminating duplex base pair of DNA dan- gling ends to duplex stability [9,10,13-16]. None, how- ever, have examined effects of end length in an incre- mental fashion for ends ranging in length from nL = 1 to 10 bases, nor have they compared 5’ and 3’ ends in dif- ferent Na+ environments. However, there remain several places where these results can be compared with pub- lished work. Thermodynamic effects of all possible single base dangling ends were studied by Santa Lucia and cowork- ers through UV melting analysis [13,17]. In their sys- tematic study, molecules were designed to have a duplex fixed at eight base pairs and single dangling bases at- tached to the 5’ or 3’ ends. Relevant sequence dependent interactions (e.g. those of the terminal 5’AC/3’G stack) determined in their study should be comparable with our results in 1.0 M [Na+]. After conversion to 25˚C, they re- port an observed stabilization of kcal/ mol. It appears that our value of at 25˚C for the 5’AC/3’G stack of −0.3 kcal/mol is not nearly as stabilizing as reported. However, for longer ends where nL is greater than 1, an average value of 25 25 1.21G 25 1 L Gn G 2.6 kcal/mol was obtained, which is in better agreement with published results. Over 20 years ago, Doktycz et al. published results from melting studies of four-base dangling-ended DNA hairpin molecules [14]. The general sequence, 5’(XY)2- (GGATAC)2(T)4, naturally folds to form a hairpin with a six base duplex stem, a T4 single strand loop connecting one end of the duplex and a four base 5’ dangling end on the other. Considering only the molecules with the same specific end sequences (i.e. those with a terminal stack of 5’AC/3’G), the reported 25 G had an average value of −1.17 kcal/mol in 115 mM [Na+]. In this salt environ- ment, for nL = 4 our data has coalesced to an average value of −1.5 kcal/mol, in reasonable agreement with published results. Ohmichi published results of melting studies using an eight base pair duplex molecule with 5’ dangling ends varying from one to four bases [9]. The terminating se- quence in their molecules was slightly different, 5’AG/3’C instead of 5’AC/3’G, which prohibits a direct comparison. Nonetheless, trends reported as a function of increasing length can be considered. For a single base 5’ dangling end in 1.0 M [Na+], a stabilization of 25 0.3G kcal/ mol was reported. Addition of a second dangling end base increased stabilization to −0.4 kcal/mol. This trend seemed to reach a constant value at three bases with 25 0.6G kcal/mol. This increase in stability coupled to the lengthening of the single strand dangling end is qualitatively consistent with our observations. 4.2. 3’ Dangling Ends Compared to 5’ dangling ends, fewer studies of 3’ dan- gling ends have been performed. Overall, reports have found that 3’ dangling ends make favorable contributions to duplex stability, and are thus stabilizing, but less so than their 5’ counterparts [4,9]. In contrast we found 3’ ends to be generally destabilizing. Although unexpected, observations of destabilizing dangling ends are not un- precedented. The terminal stacks, 5’GT/3’A, 5’T/3’AC and 5’T/3’TA were found by SantaLucia to be mildly destabi- lizing [13]. Additionally comparison of the published temperature corrected value for the 5’C/3’AG stack, 25 1.0G kcal/mol [13], is in good agreement with our results in 1.0 M [Na+], where 25 0.8G kcal/mol. Perhaps by focusing only on single dangling bases in Copyright © 2012 SciRes. OPEN A CCESS  R. Dickman et al. / Journal of Biophysical Chemistry 3 (2012) 1-15 12 high salt, the case found here to have the greatest stabi- lizing effect, the appearance of 3’ dangling end destabi- lization was overlooked. 4.3. Origins of Stabilization Our results indicate that 5’ dangling ends are equally or more stabilizing than their 3’ counterparts. This be- havior has been previously documented and can possibly be explained by examining DNA single strand structure. In the duplex state, DNA adopts the preferable B-form, which persists to some degree in the single strand state. NMR studies of single strand DNA hexamers with mul- tiple A-A base stacks showed that in DNA, the imidazole stacks above the pyrimidine in the 5’ to 3’ direction [18]. A systematic review of crystal structures from the pro- tein database demonstrated for DNA that addition of a single strand base on the 5’ end is positioned in such a way that it can freely interact with the hydrogen bonds of the terminal base pair. In contrast, a 3’ base end is posi- tioned away from the same hydrogen bonds, and there- fore is less likely to experience such stabilization [19]. Thus, placement of the dangling base is optimal for ter- minal base pair interactions in DNA on the 5’ end but when an additional base is added to the 3’ end of DNA minimal overlap occurs which apparently translates to fewer stabilizing interactions. 4.4. Structural Perturbations Our results indicate a 3’ dangling end is generally de- stabilizing to a DNA duplex. Previous studies of counte- rion binding to duplex DNA suggests fewer Na+ ions bind near the ends compared to in the middle [6,20]. This suggests differences between the dangling ended and blunt molecules should result in negligible changes in counterion binding if the duplex region of the dangling- ended duplex is not affected by the ends. Comparison of the blunt ended duplexes and set II molecules support this assumption. The net counterion release per phos- phate is the same for the two sets (I and II) of molecules and the plots of vs. nL (in Figure 3) are the same. Conversely, for the set III molecules having 3’/5’ dan- gling ends, the plot of vs. nL is approximately 15% lower than for the set I and set II molecules and indicates a net lower Na+ release during melting suggesting the duplex region for set III is perturbed in some way that results in slight differences of the associated counterion binding properties. When DNA molecules anneal from their single strand state to form a duplex state, a net change in solvent ex- posed surface occurs. This change is accompanied by the burying of hydrophobic residues, which contributes to C. Differences in the estimated C values for set II, when compared to set III (Figures 4 and 5), further support the idea of subtle differences between the duplex regions. Comparison of C values for the blunt-ended set I molecules and the set II molecules revealed an es- sentially constant C with a cal difference of about 1 cal·deg–1·base·pair–1. There was also no marked length dependence, indicating that most of the stability came from interactions of the first base with the terminal base pair, presumably due to the favorable stacking in- teractions. Conversely, comparison of C values for set III and set I molecules revealed a significant differ- ence, p52C.5 cal·deg–1·base·pair–1. Here cal is initially around 0.5 and decreases to −0.5 as the length of the dangling end increases to nL = 10. This suggests an initial smaller buried surface area as compared to the 5’ dangling end, which is lost as the dangling end increases in length. The continued loss of enthalpy suggest that with longer dangling ends, the duplex region itself may be perturbed in this particular molecular environment. 4.5. Predictive Ability and Applications to Probe Design Ascertaining specific thermodynamics involved in probe/target alignment and being able to further predict energies of all possible alignments is key to optimal probe design. The ability to design probes with exquisite accuracy is imperative to successfully locate target se- quences differing by as little as a single nucleotide. In fact, molecules used in this study were designed to mimic those that might occur in a multiplex hybridiza- tion reaction (such as on a DNA microarray) where dan- gling ends presumably occur with a moderate to high frequency. The more specific the predictive ability of thermodynamic binding properties, the more effective probe design can be achieved. In the n-n model the free energy of melting a duplex molecule is given by initiation oo s onal tack a o G dditi o GGG . (17) For calculations involving the duplex region, this model uses combinations of the 10 possible n-n values (stack ) experimentally determined by a number of in- dependent labs that are generally in good agreement with one another [17]. The first term, initiation, is the cost required to begin the annealing process and therefore has a positive free energy contribution. This value has re- cently been determined by our group, as well as other investigators [21,22]. The last term, additional , encom- passes any extra terms such as those arising from sym- metry considerations, a terminating A·T base pair or sin- gle strand dangling ends. The sum of terms estimates the total free energy. o G o G o G Current prediction programs relying on the n-n model o calculate thermodynamic properties are limited by the t Copyright © 2012 SciRes. OPEN A CCESS 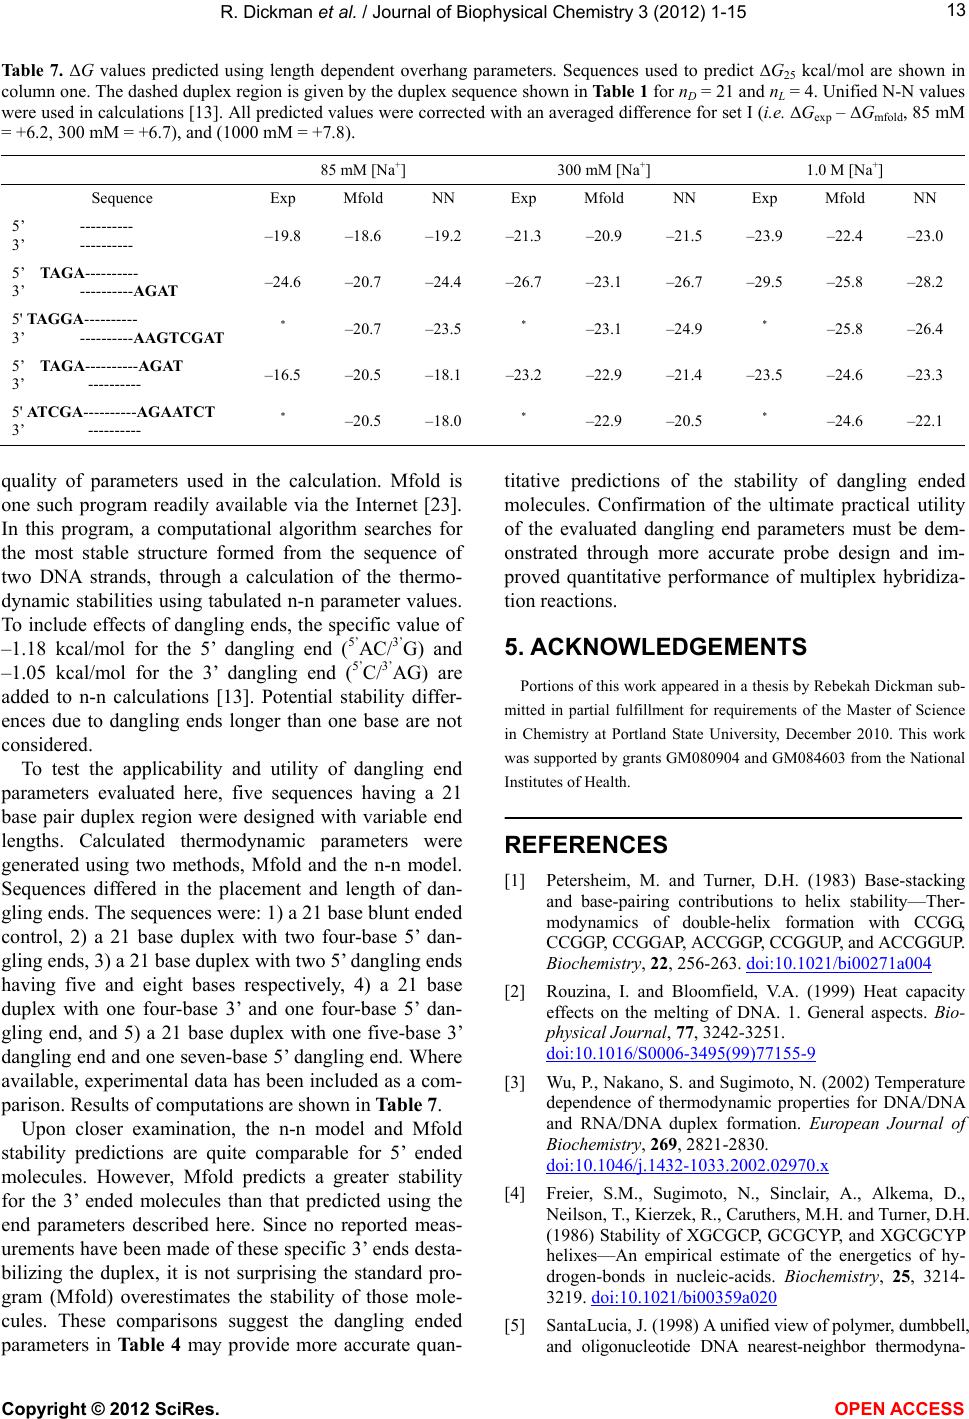 R. Dickman et al. / Journal of Biophysical Chemistry 3 (2012) 1-15 Copyright © 2012 SciRes. 13 Table 7. ΔG values predicted using length dependent overhang parameters. Sequences used to predict ∆G25 kcal/mol are shown in column one. The dashed duplex region is given by the duplex sequence shown in Table 1 for nD = 21 and nL = 4. Unified N-N values were used in calculations [13]. All predicted values were corrected with an averaged difference for set I (i.e. ∆Gexp – ∆Gmfold, 85 mM = +6.2, 300 mM = +6.7), and (1000 mM = +7.8). 85 mM [Na+] 300 mM [Na+] 1.0 M [Na+] Sequence Exp Mfold NN Exp Mfold NN Exp Mfold NN 5’ ---------- 3’ ---------- –19.8 –18.6 –19.2 –21.3 –20.9 –21.5 –23.9 –22.4 –23.0 5’ TAGA---------- 3’ ----------AGAT –24.6 –20.7 –24.4 –26.7 –23.1 –26.7 –29.5 –25.8 –28.2 5' TAGGA---------- 3’ ----------AAGTCGAT * –20.7 –23.5 * –23.1 –24.9 * –25.8 –26.4 5’ TAGA----------AGAT 3’ ---------- –16.5 –20.5 –18.1 –23.2 –22.9 –21.4 –23.5 –24.6 –23.3 5' ATCGA----------AGAATCT 3’ ---------- * –20.5 –18.0 * –22.9 –20.5 * –24.6 –22.1 quality of parameters used in the calculation. Mfold is one such program readily available via the Internet [23]. In this program, a computational algorithm searches for the most stable structure formed from the sequence of two DNA strands, through a calculation of the thermo- dynamic stabilities using tabulated n-n parameter values. To include effects of dangling ends, the specific value of –1.18 kcal/mol for the 5’ dangling end (5’AC/3’G) and –1.05 kcal/mol for the 3’ dangling end (5’C/3’AG) are added to n-n calculations [13]. Potential stability differ- ences due to dangling ends longer than one base are not considered. OPEN A CCESS To test the applicability and utility of dangling end parameters evaluated here, five sequences having a 21 base pair duplex region were designed with variable end lengths. Calculated thermodynamic parameters were generated using two methods, Mfold and the n-n model. Sequences differed in the placement and length of dan- gling ends. The sequences were: 1) a 21 base blunt ended control, 2) a 21 base duplex with two four-base 5’ dan- gling ends, 3) a 21 base duplex with two 5’ dangling ends having five and eight bases respectively, 4) a 21 base duplex with one four-base 3’ and one four-base 5’ dan- gling end, and 5) a 21 base duplex with one five-base 3’ dangling end and one seven-base 5’ dangling end. Where available, experimental data has been included as a com- parison. Results of computations are shown in Table 7. Upon closer examination, the n-n model and Mfold stability predictions are quite comparable for 5’ ended molecules. However, Mfold predicts a greater stability for the 3’ ended molecules than that predicted using the end parameters described here. Since no reported meas- urements have been made of these specific 3’ ends desta- bilizing the duplex, it is not surprising the standard pro- gram (Mfold) overestimates the stability of those mole- cules. These comparisons suggest the dangling ended parameters in Ta b l e 4 may provide more accurate quan- titative predictions of the stability of dangling ended molecules. Confirmation of the ultimate practical utility of the evaluated dangling end parameters must be dem- onstrated through more accurate probe design and im- proved quantitative performance of multiplex hybridiza- tion reactions. 5. ACKNOWLEDGEMENTS Portions of this work appeared in a thesis by Rebekah Dickman sub- mitted in partial fulfillment for requirements of the Master of Science in Chemistry at Portland State University, December 2010. This work was supported by grants GM080904 and GM084603 from the National Institutes of Health. REFERENCES [1] Petersheim, M. and Turner, D.H. (1983) Base-stacking and base-pairing contributions to helix stability—Ther- modynamics of double-helix formation with CCGG, CCGGP, CCGGAP, ACCGGP, CCGGUP, and ACCGGUP. Biochemistry, 22, 256-263. doi:10.1021/bi00271a004 [2] Rouzina, I. and Bloomfield, V.A. (1999) Heat capacity effects on the melting of DNA. 1. General aspects. Bio- physical Journal, 77, 3242-3251. doi:10.1016/S0006-3495(99)77155-9 [3] Wu, P., Nakano, S. and Sugimoto, N. (2002) Temperature dependence of thermodynamic properties for DNA/DNA and RNA/DNA duplex formation. European Journal of Biochemistry, 269, 2821-2830. doi:10.1046/j.1432-1033.2002.02970.x [4] Freier, S.M., Sugimoto, N., Sinclair, A., Alkema, D., Neilson, T., Kierzek, R., Caruthers, M.H. and Turner, D.H. (1986) Stability of XGCGCP, GCGCYP, and XGCGCYP helixes—An empirical estimate of the energetics of hy- drogen-bonds in nucleic-acids. Biochemistry, 25, 3214- 3219. doi:10.1021/bi00359a020 [5] SantaLucia, J. (1998) A unified view of polymer, dumbbell, and oligonucleotide DNA nearest-neighbor thermodyna- 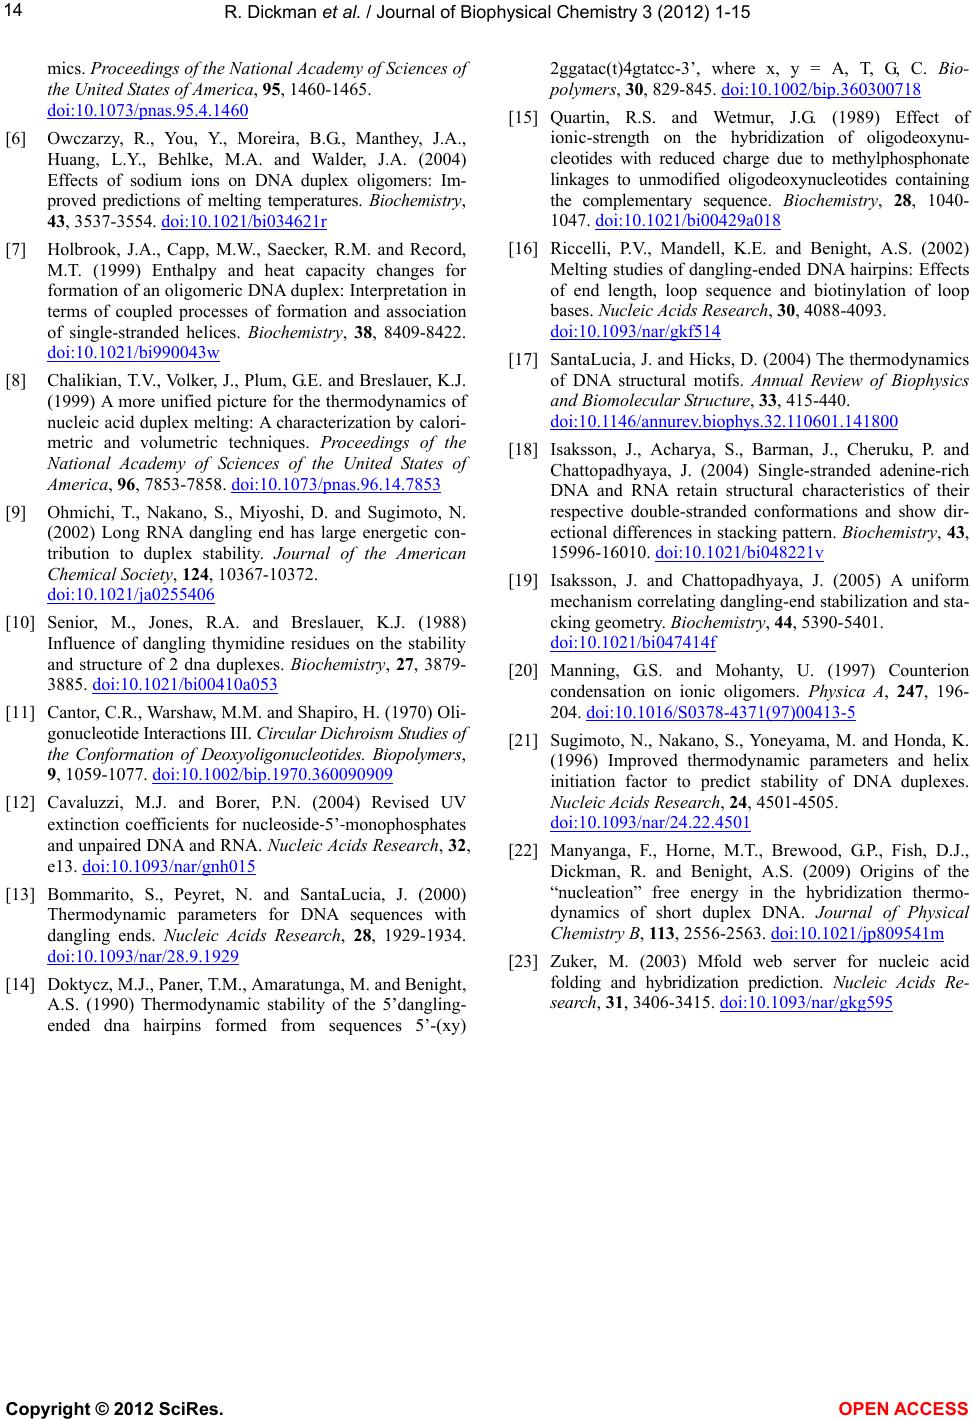 R. Dickman et al. / Journal of Biophysical Chemistry 3 (2012) 1-15 14 mics. Proceedings of the National Academy of Sciences of the United States of America, 95, 1460-1465. doi:10.1073/pnas.95.4.1460 [6] Owczarzy, R., You, Y., Moreira, B.G., Manthey, J.A., Huang, L.Y., Behlke, M.A. and Walder, J.A. (2004) Effects of sodium ions on DNA duplex oligomers: Im- proved predictions of melting temperatures. Biochemistry, 43, 3537-3554. doi:10.1021/bi034621r [7] Holbrook, J.A., Capp, M.W., Saecker, R.M. and Record, M.T. (1999) Enthalpy and heat capacity changes for formation of an oligomeric DNA duplex: Interpretation in terms of coupled processes of formation and association of single-stranded helices. Biochemistry, 38, 8409-8422. doi:10.1021/bi990043w [8] Chalikian, T.V., Volker, J., Plum, G.E. and Breslauer, K.J. (1999) A more unified picture for the thermodynamics of nucleic acid duplex melting: A characterization by calori- metric and volumetric techniques. Proceedings of the National Academy of Sciences of the United States of America, 96, 7853-7858. doi:10.1073/pnas.96.14.7853 [9] Ohmichi, T., Nakano, S., Miyoshi, D. and Sugimoto, N. (2002) Long RNA dangling end has large energetic con- tribution to duplex stability. Journal of the American Chemical Society, 124, 10367-10372. doi:10.1021/ja0255406 [10] Senior, M., Jones, R.A. and Breslauer, K.J. (1988) Influence of dangling thymidine residues on the stability and structure of 2 dna duplexes. Biochemistry, 27, 3879- 3885. doi:10.1021/bi00410a053 [11] Cantor, C.R., Warshaw, M.M. and Shapiro, H. (1970) Oli- gonucleotide Interactions III. Circular Dichroism Studies of the Conformation of Deoxyoligonucleotides. Biopolymers, 9, 1059-1077. doi:10.1002/bip.1970.360090909 [12] Cavaluzzi, M.J. and Borer, P.N. (2004) Revised UV extinction coefficients for nucleoside‐5’‐monophosphates and unpaired DNA and RNA. Nucleic Acids Research, 32, e13. doi:10.1093/nar/gnh015 [13] Bommarito, S., Peyret, N. and SantaLucia, J. (2000) Thermodynamic parameters for DNA sequences with dangling ends. Nucleic Acids Research, 28, 1929-1934. doi:10.1093/nar/28.9.1929 [14] Doktycz, M.J., Paner, T.M., Amaratunga, M. and Benight, A.S. (1990) Thermodynamic stability of the 5’dangling- ended dna hairpins formed from sequences 5’-(xy) 2ggatac(t)4gtatcc-3’, where x, y = A, T, G, C. Bio- polymers, 30, 829-845. doi:10.1002/bip.360300718 [15] Quartin, R.S. and Wetmur, J.G. (1989) Effect of ionic-strength on the hybridization of oligodeoxynu- cleotides with reduced charge due to methylphosphonate linkages to unmodified oligodeoxynucleotides containing the complementary sequence. Biochemi st ry , 28, 1040- 1047. doi:10.1021/bi00429a018 [16] Riccelli, P.V., Mandell, K.E. and Benight, A.S. (2002) Melting studies of dangling-ended DNA hairpins: Effects of end length, loop sequence and biotinylation of loop bases. Nucleic Acids Research, 30, 4088-4093. doi:10.1093/nar/gkf514 [17] SantaLucia, J. and Hicks, D. (2004) The thermodynamics of DNA structural motifs. Annual Review of Biophysics and Biomolecular Structure, 33, 415-440. doi:10.1146/annurev.biophys.32.110601.141800 [18] Isaksson, J., Acharya, S., Barman, J., Cheruku, P. and Chattopadhyaya, J. (2004) Single-stranded adenine-rich DNA and RNA retain structural characteristics of their respective double-stranded conformations and show dir- ectional differences in stacking pattern. Biochemistry, 43, 15996-16010. doi:10.1021/bi048221v [19] Isaksson, J. and Chattopadhyaya, J. (2005) A uniform mechanism correlating dangling-end stabilization and sta- cking geometry. Biochemistry, 44, 5390-5401. doi:10.1021/bi047414f [20] Manning, G.S. and Mohanty, U. (1997) Counterion condensation on ionic oligomers. Physica A, 247, 196- 204. doi:10.1016/S0378-4371(97)00413-5 [21] Sugimoto, N., Nakano, S., Yoneyama, M. and Honda, K. (1996) Improved thermodynamic parameters and helix initiation factor to predict stability of DNA duplexes. Nucleic Acids Research, 24, 4501-4505. doi:10.1093/nar/24.22.4501 [22] Manyanga, F., Horne, M.T., Brewood, G.P., Fish, D.J., Dickman, R. and Benight, A.S. (2009) Origins of the “nucleation” free energy in the hybridization thermo- dynamics of short duplex DNA. Journal of Physical Chemistry B, 113, 2556-2563. doi:10.1021/jp809541m [23] Zuker, M. (2003) Mfold web server for nucleic acid folding and hybridization prediction. Nucleic Acids Re- search, 31, 3406-3415. doi:10.1093/nar/gkg595 Copyright © 2012 SciRes. OPEN A CCESS  R. Dickman et al. / Journal of Biophysical Chemistry 3 (2012) 1-15 15 Supplementary Figures 85 mM [Na + ] 300 mM [Na + ] 1000 mM [Na + ] Supplementary Figure 1. cal versus cal TS (T = 298.15 K) for the 27 duplex DNAs in 85 mM, 300 mM and 1.0 M [Na+]. H Supplementary Figure 2. Comparison of the evaluated thermodynamic parameters for the 5’ and 3’ dangling ends in sets II and III ((a) δH and (b) δS), in the three Na+ envi- ronments plotted versus overhang length, nL. Copyright © 2012 SciRes. OPEN A CCESS
|