Paper Menu >>
Journal Menu >>
 Journal of Transportation Technologies, 2012, 2, 41-49 http://dx.doi.org/10.4236/jtts.2012.21005 Published Online January 2012 (http://www.SciRP.org/journal/jtts) The Dynamic Location Model to Consider Backgr ound Traffic Nahry Yusuf, Sutanto Soehodho Department of Civil Engineering, Faculty of Engineering, Universitas Indonesia, Depok, Indonesia Email: nahry@eng.ui.ac.id, ssoehodho@yahoo.com Received October 15, 2011; revised November 17, 2011; accepted December 9, 2011 ABSTRACT This study concerns to the determination of location of freight distribution warehouses. It is part of a series of research projects on a distribution system we developed to deal with cases in a public service obligation state-owned company (PSO-SOC). This current research is characterized by the consideration of background traffic of the entire time period of planning rather than one certain time target on location model. It is aimed that the location decision to be more applicable and accommodative to the dynamic of the traffic condition. Once the decision is implemented, it will give the best outcome for the entire time period, not only for the initial time, end time or certain time of time period. A heuristic approach is proposed to simplify complexity of the model and network representation technique is applied to solve the model. A hyphotetical example is discussed to illustrate the mechanism of finding the optimal solution in term of both its objective function and applicability. Keywords: Background Traffic; Location Model; Freight Distribution 1. Introduction Research on determination location of facilities of freight distribution system has been done for many years. Those research works are differentiated in many aspects, such as number of types of commodities, number of channels, variables involved, mathematical complexity, objective of the system, and other features [1-4]. Nevertheless, this research area is still challenging to be explored in order to enhance the previous works and solve particular pro- blems. This current research is part of series of research on location model which concerns to Public Service Obli- gation State-Owned Company’s (PSO-SOC) distribution system [5-7]. It is a continuation of our most recent re- search concerning the dynamic of background traffic [8]. Background traffic is the terminology used for the move- ment of vehicles which occupy the highway system to- gether with freight vehicles. In our previous model, we considered the effect of background traffic on the loca- tion decision of warehouses. Such model, as well as other previous location models takes into account the back- ground traffic of certain time target (time reference). Most of them do not mention explicitly which part of time period of planning to represent the traffic condition [9]. As the location decision is designed for a long time period, such as 15 - 20 years, and it is commonly known that the traffic is very dynamic in nature, then to consider only one certain time to be the reference of the number of background traffic may cause the decision obsolete prior to its final year. In order to accommodate the dynamic of background traffic, we propose a dynamic location model which con- siders the fluctuation of background traffic using time increment during time period of planning. The location decision of such model is amenable for people to con- struct or operate warehouses in stages throughout time period of planning. This current research is focused to develop the mechanism of choosing the best combination of warehouses to be opened to accommodate the real traffic condition at the most and at the same time it could be applicable in practice. The structure of this paper is as follows. Section 2 in- troduces the model formulation and Section 3 presents the model solution. An illustrative example is discussed in Section 4 to show the mechanism proposed in Section 3. Finally, Section 5 provides conclusion and future re- search directions. 2. Model Formulation In order to show the effect of the dynamic of background traffic on the location decision, Figure 1 shows the rela- tions among the determinants of location decision. From Figure 1 it is shown that the existence of certain warehouse may generate traffic flow, both in direct and indirect way. It is clear that the activities of warehouse must produce and attract some traffic flows in direct way, C opyright © 2012 SciRes. JTTs 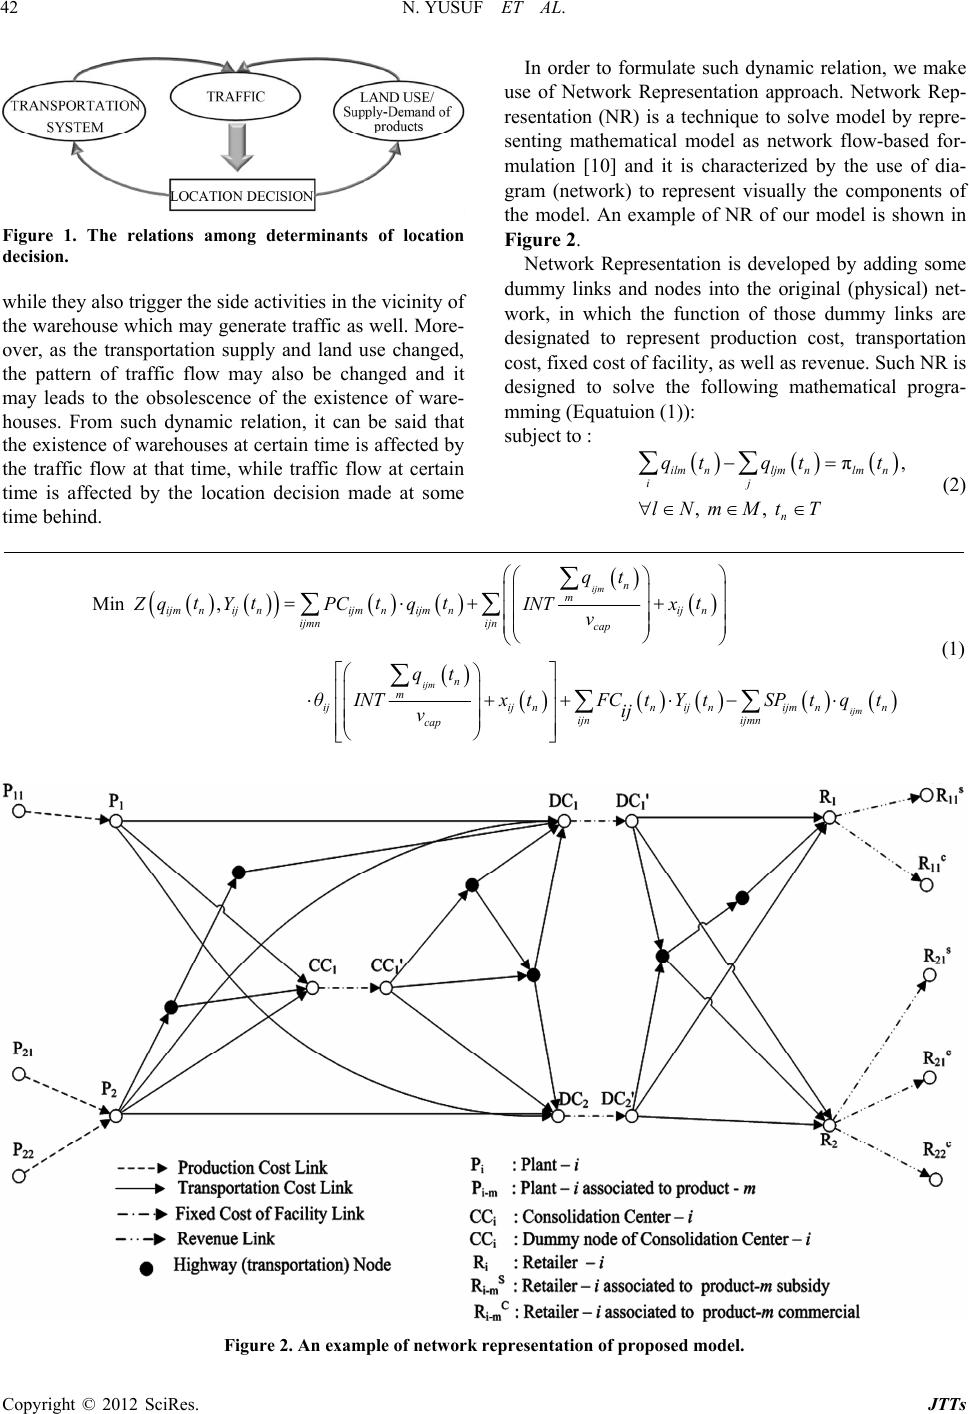 N. YUSUF ET AL. 42 Figure 1. The relations among determinants of location decision. while they also trigger the side activities in the vicinity of the warehouse which may generate traffic as well. More- over, as the transportation supply and land use changed, the pattern of traffic flow may also be changed and it may leads to the obsolescence of the existence of ware- houses. From such dynamic relation, it can be said that the existence of warehouses at certain time is affected by the traffic flow at that time, while traffic flow at certain time is affected by the location decision made at some time behind. In order to formulate such dynamic relation, we make use of Network Representation approach. Network Rep- resentation (NR) is a technique to solve model by repre- senting mathematical model as network flow-based for- mulation [10] and it is characterized by the use of dia- gram (network) to represent visually the components of the model. An example of NR of our model is shown in Figure 2. Network Representation is developed by adding some dummy links and nodes into the original (physical) net- work, in which the function of those dummy links are designated to represent production cost, transportation cost, fixed cost of facility, as well as revenue. Such NR is designed to solve the following mathematical progra- mming (Equatuion (1)): subject to : π, , , ilmljm lnnm ij n qq lNmM tt T t t n (2) Min , ijm ijm ijm nn nn nn n m ijmijijm nijmij ijmnijn cap n m ijijij ijm ijn ijm n cap nn n q Zq YPCqINTx v q θINTxFC YSP t ttt tt t tt q ij vtt t (1) Figure 2. An example of network representation of proposed model. Copyright © 2012 SciRes. JTTs 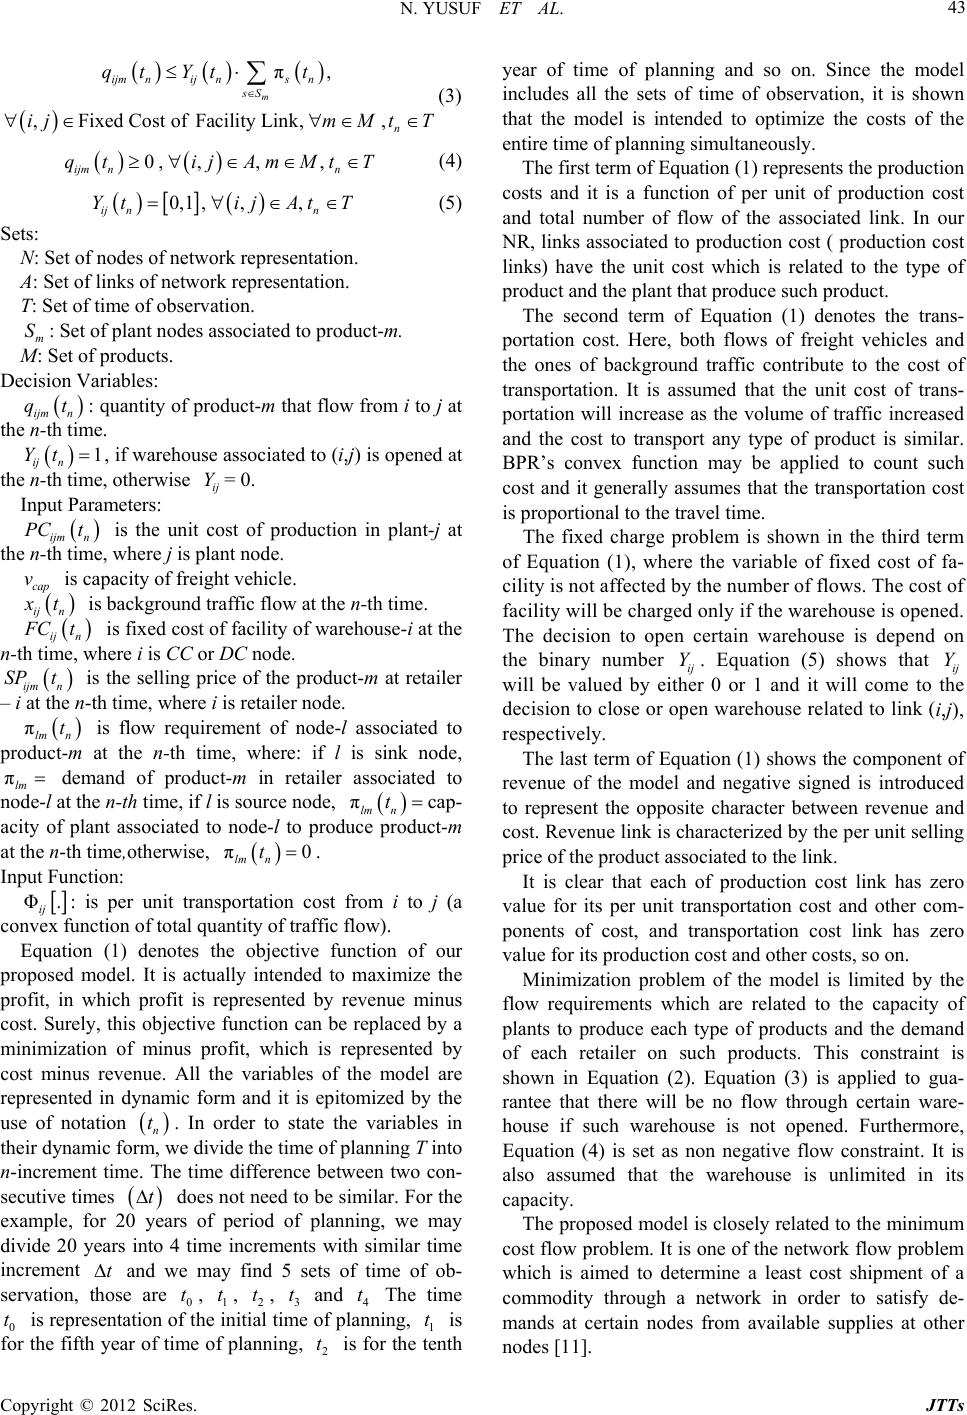 N. YUSUF ET AL. 43 π, ,Fixed CostofFacility Link,, m nnijm ijs sS n n qt ttY ijmM tT (3) 0, ,,, nijm n qijAmMt tT (4) 0,1 ,,, nij n YitjA tT (5) Sets: et of nodes of network representation. ted to product-m. M: D of product-m that flow from i to j at th house associated to (i,j) is opened at th it cost of production in plant-j at th N: S A: Set of links of network representation. T: Set of time of observation. m S: Set of plant nodes associa Set of products. ecision Variables: ijm n qt : quantity e n-th time. 1 ij n Yt , if ware e n-th time, otherwise ij Y= 0. Input Parameters: ijm n PCt is the un e n-th time, where j is plant node. cap v is capacity of freight vehicle. ij n x t is background traffic flow at the n-th time. ij n F Ct is fixed cost of facility of warehouse-i at the n- roduct-m at retailer associated to pr th time, where i is CC or DC node. ijm n SPt is the selling price of the p – i at the n-th time, where i is retailer node. πlm n t is flow requirement of node-l oduct-m de-l at the n-th time, where: if l is sink node, πlm demand of product-m in retailer associated to at the n-th time, if l is source node, πlm t no n cap- acity of plant associated to node-l to prodct-m at the n-th time,otherwise, uce produ π0 lm n t. Input Function: Φ. ij : is per unit transportation cost from i to j (a co of our pr s the production co e trans- po hown in the third term of Equation (1) shows the component of re nk has zero va the flo sed model is closely related to the minimum co nvex function of total quantity of traffic flow). Equation (1) denotes the objective function oposed model. It is actually intended to maximize the profit, in which profit is represented by revenue minus cost. Surely, this objective function can be replaced by a minimization of minus profit, which is represented by cost minus revenue. All the variables of the model are represented in dynamic form and it is epitomized by the use of notation n t. In order to state the variables in their dynamic forme divide the time of planning T into n-increment time. The time difference between two con- secutive times t does not need to be similar. For the example, for 2ars of period of planning, we may divide 20 years into 4 time increments with similar time increment t and we may find 5 sets of time of ob- servation, se are 0 t, 1 t, 2 t, 3 t and 4 t The time 0 t is representation ofhe initial ti of plaing, 1 t is r the fifth year of time of planning, 2 t is for the h year of time of planning and so on. Since the model includes all the sets of time of observation, it is shown that the model is intended to optimize the costs of the entire time of planning simultaneously. The first term of Equation (1) represent , w 0 ye tho tmenn fo tent sts and it is a function of per unit of production cost and total number of flow of the associated link. In our NR, links associated to production cost ( production cost links) have the unit cost which is related to the type of product and the plant that produce such product. The second term of Equation (1) denotes th rtation cost. Here, both flows of freight vehicles and the ones of background traffic contribute to the cost of transportation. It is assumed that the unit cost of trans- portation will increase as the volume of traffic increased and the cost to transport any type of product is similar. BPR’s convex function may be applied to count such cost and it generally assumes that the transportation cost is proportional to the travel time. The fixed charge problem is s Equation (1), where the variable of fixed cost of fa- cility is not affected by the number of flows. The cost of facility will be charged only if the warehouse is opened. The decision to open certain warehouse is depend on the binary number ij Y. Equation (5) shows that ij Y will be valued by eithr 0 or 1 and it will come to t decision to close or open warehouse related to link (i,j), respectively. The last term of e he venue of the model and negative signed is introduced to represent the opposite character between revenue and cost. Revenue link is characterized by the per unit selling price of the product associated to the link. It is clear that each of production cost li lue for its per unit transportation cost and other com- ponents of cost, and transportation cost link has zero value for its production cost and other costs, so on. Minimization problem of the model is limited by w requirements which are related to the capacity of plants to produce each type of products and the demand of each retailer on such products. This constraint is shown in Equation (2). Equation (3) is applied to gua- rantee that there will be no flow through certain ware- house if such warehouse is not opened. Furthermore, Equation (4) is set as non negative flow constraint. It is also assumed that the warehouse is unlimited in its capacity. The propo st flow problem. It is one of the network flow problem which is aimed to determine a least cost shipment of a commodity through a network in order to satisfy de- mands at certain nodes from available supplies at other nodes [11]. Copyright © 2012 SciRes. JTTs  N. YUSUF ET AL. 44 3. Model Solution In order to minimize th del discussed in the p e complexity of the proposed mo- revious section, we make use of ctivities, an r time of ∆t would be the time period of heuristic approach to solve the problem. Figure 3 shows the mechanism which is used to synthesize the dynamic concept of the proposed location model. Based on the capacity of plant, demand of retailers, as well as the con- dition of the traffic and all related costs at time t0, we can determine the decision to open a set of warehouses. Such decision may be derived from any location model which is aimed to minimize the cost of the system [6]. Furthermore, as the traffic changed after time t0 due to land use development, included the warehouse a d the demand and supply side of the products may also be changed, we can determine the best set of warehouses for time t1. The similar phenomenon is treated to make location decision of time t2, t3 and t4. In certain situation where the traffic change is pre- dicted to be very dynamic, the shorte required to find the best location decision which fit to the real traffic condition at the most. The decisions made for time t1 - t4 are actually the best decision to locate the warehouses during planning. This mechanism is essentially represented in the proposed mathematical programming of Equation (1), in which the total cost of the system during the time period of planning is the summation of total cost of the system of all time observations during time period of planning. It is clear that the minimum cost of each time of observation must make contribution to the minimum cost of the entire time period of planning. From the mathematical point of view, such location decision is guaranteed to be the best decision to locate some warehouses among one set of potential warehouses. However, in some condition the decision could not be applied in practice. It can be explained through Figure 3. From the example on Figure 3, it can be seen that warehouse 1, 2, 4 and 5 are opened at t0 but warehouse 2 is not feasible to be opened at time t1 and t2 and it is replaced by warehouse 3 at time t2. Practically it is actually not common to open and close warehouse con- secutively and then open them at the following time, as experienced by warehouse 2 and 3 of the example (Fi- gure 3). If this is the rule, justification should be made to decide the combination of warehouses which shall be the second best suited to the background traffic condition during the time period of planning while at the same it could be feasible from the practical side. The mechanism of making location decision which taking into account the dynamic of traffic is presented in Figure 4 and it could be explained as follows: Figure 3. Dynamic of location decision. Copyright © 2012 SciRes. JTTs  N. YUSUF ET AL. 45 Figure 4. Step wise of choosing the second best combination of warehouses. Step 0 : Define the time increment ∆t and time period of planning T. Make projection of freight supply and demand and cost of transportation for each time of observation tn during T, where the number of observation = T/∆t + 1. Set n = 0. Step 1: Do User Equilibrium traffic assignment to find background traffic of the n-th year. The assignment must be based on the forecasted generated trips due to land use development (included warehouse activities) during the period of (n – 1)-th year to n-th year. Step 2: Make location decision of the n-th year. If the n-th year is the final year T, go to Step 4. Step 3: Set n := n + 1, go to Step 1. Step 4: Set the rule for choosing the second best com- bination of warehouses. Step 5: Determine alternatives of combination of war- ehouses to be opened during T. Step 6: Do production assigment and distribution of all time observations for all alternative combinations of ware- houses. Step 7: Choose the best alternative to be the second best choice of location. Some considerations could be used for the rule of dete- rmining alternatives of warehouse combination (Step 4). The rule is applied to the initial (best) combination of warehouses and it could be explained as follows: 1) The most frequently appeared warehouses must be- come member of the second best combination. 2) When certain warehouse is opened at certain time, it must be opened until the final year T. 3) When there is more than ∆t years time lapse be- tween two consecutive times of opening certain ware- house (see the example of warehouse 2 or 3 in Figure 3), coefficient α could be used for final decision. 4) Coefficient α represents the tolerable percentage of lapse time between two consecutive times of opening certain warehouse if it is compared to time T. 5) The most frequently appeared combination of ware- houses (at the initial condition) could be the alternative combination. By applying such rules, we can find one or more alter- natives of combination and we can compare the objective function of all the alternatives and finally choose the best one. 4. Illustrative Example In order to show the mechanism proposed in Section 3, the ensuing contrived example is discussed. The 2-stage Copyright © 2012 SciRes. JTTs  N. YUSUF ET AL. 46 distribution network consists of 2 plants, 2 potential sites of distribution center level 1, 3 potential sites of distri- bution centers level 2 and 3 retailers (Figure 5). It deals with 1 type of product and 2 types of demand, those are commercial and subsidized demand. Table 1 shows cap- acity of each plant, as well as its production cost. Table 2 shows the demand of each retailer on each product, as well as its selling price. We design the time period of planning T as 20 years, with the increment time is 5 years, so that we have 5 times of observation. As the scenario of the system, the capacity of some links of the network is set to be 1.5 times of its initial capacity at year 10 (time t2 ) and some other links’s are increased at year 15 (time t3). Regarding the tolerable percentage of lapse time between two consecutive times of opening certain warehouse, we assume to apply coefficient α as 20%. It implies that we may consider the existence of certain warehouse only if maximum time lapse between two consecutive times of opening such warehouse is 10 years (equal to 1 time of observation). The solution is initialized by carrying out the traffic assignment for the initial time t0. Using any kind of traf- fic assignment tool, link traffic flow for the entire net- work could be determined. Based on these flows and other parameters of supply and demands of products, lo- cation decision of time t0 could be determined using any kind of location model ouse 2, 3, 4 and 5 is t0 u make projection of the generated trips for time t1 due to the land use development during time t0 to t 1, included the activities of warehouses, and it is then followed by the prediction of background traffic of the entire network for time t1. Again, based on these flows and the projec- tion of demand and supply of the products at time t1, lo- cation decision of time t1 is determined. Furthermore, the location decisions of the remaining time of observation may be determined with the similar way. The more the number of time increment (time of observation), the more fit the decision to the real condition of traffic. From this notion, we may also find that if the location model only considers one certain time for representing the back- ground traffic (such as initial time, mid year or final year), we may lose the opportunity to reduce the cost (or increase the profit) from the system. Figure 6 shows the best combination of warehouses of the illustrative example for the entire period of planning. From Figure 6, it can be seen that at the initial time (t0) the best composition of warehouses is 2, 3, 4, and 5. At time t1, the location decision is not changed even though the composition of background traffic is changed. As some link capacities are changed at time t2, the com- position of warehouses is changed to warehouse 1 and 4. Finally, at time t3 and t4 warehouse 1, 3, 4 and 5 become the best composition. Since such compositions are der- ived from the location model which is applied at the is clear that the com- 6 could be considered [6]. Figure 6 shows that ware- he best combination for time t. entire time period of planning, it bination of warehouses on Figureh F rthermore, having the best location of time t0, we can as the best composition of warehouses. work of the example. Figure 5. Distribution net Copyright © 2012 SciRes. JTTs  N. YUSUF ET AL. 47 Table 1. Plant capacity. Plant Capacity (unit cost of production) Plant Product-1 1 1000 (4) 2 2000 (5) Total 3000 Table 2. Demand. Demand on product(selling price) Retailer 1S 1 C 1 400 (20) 600 (50) 2 200 (20) 700 (75) 3 200 (20) 900 (50) Total 3000 S: Subsidy, C: Commercial. Furthermore, when we investigate the best combina- tion on Figure 6, we can see that warehouse 2 is actually not feasible to be opened since it is just opened at time t0 and t1, and it is not required at the remaining time. For warehouse 3 and 4, even though they are not required at time t2, we may still consider them due to the existence of the coefficient of α. By applying some rules as described in Section 3, we can propose 3 alternatives of combination of warehouses to be applied. For each of alternatives we can determine its objective function throughout the time period (Table 3). It is carried out in the slightly similar way with Step 1 and 2 of step wise on Figure 4. The only difference is the location decision of step 2 is replaced by allocation deci- sion. In allocation problem, the existence (location) of warehouses is predetermined. Figure 6. The (initial) best combination of warehouses (Ob- jective function = 246659). among the three alternatives in term of its objective function and it in- dicates that warehouse 1, 3, 4 and 5 are feasible to be opened during the time period of planning to replace the initial best combination as shown in Figure 6. From the context of objective function, it is understood that the alternative 1 is supposed to give more profit than the others and it is the closest alternative to the best one. Table 3. The objective functions of the alternatives of warehouse combination. Objective Function (DC opened) Figures 7(a)-(c) and Table 3 show the three alterna- tives, together with the associated objective function for the entire time of planning. Since our mathematical mo- del is a minimization problem, in which the value of the objective function represents minus profit which will be gained by the company by opening the associated ware- houses, the bigger the number, the worse the value of the decision. Since the initial best combination is found through the optimization of location model, then the ob- jective functions of all the alternatives must be worse than the initial best one but it may be more practical to be applied. From Figures 7(a)-(c) and Tab le 3, it can be seen that alternative 1 (Figure 7(a)) is the best Alternatives of warehouse combination t0 t1 t2 t3 t4 Total The initial (best) combination –52,769 (2, 3, 4, 5) 9198 (2, 3, 4, 5) 50,244 (1, 4) 76,872 (1, 3, 4, 5) 163,014 (1, 3, 4, 5) 246,659 Alternative 1 –35,507 (1, 3, 4, 5) 29,769 (1, 3, 4, 5) 122,439 (1, 3, 4, 5) 76,872 (1, 3, 4, 5) 163,014 (1, 3, 4, 5) 356,587 Alternative 2 –52,769 (2, 3, 4, 5) 9198 (2, 3, 4, 5) 83,135 (2, 3, 4, 5) 126,153 (2, 3, 4, 5) 219,116 (2, 3, 4, 5) 384,833 Alternative 3 –52,769 (2, 3, 9,198 84,865 126,689 4, 5) 217,528 (1, 2, 3, 4, 5) 385,511 4, 5) (2, 3, 4, 5) (1, 2, 3, 4, 5) (1, 2, 3, Copyright © 2012 SciRes. JTTs  N. YUSUF ET AL. 48 (a) (b) (c) Figure 7. ative 1 of waombin jective function = 356587); (b) Thtive 2 house combination (Objective function = 384833);e Alternativouse combijectiv = 385511). 5. (a) The Alternrehouse catb- of ware- ion (O e Alterna (c) Th e 3 of warehnation (Obe function Conclusions We propose a new approach of finding the best location of distribution warehouses which is aimed not only to minimize the cost (or maximize the profit) but also to accomodate the practical side of development a set of ware- houses. The main characteristic of the model is the in- clusion of the background traffic of the entire time period of planning which is divided into some increment times. The location decision could be utilized to build or open the warehouse(s) in stages during time period of planning. Mechanism proposed to select the best composition of warehouses is dominated by the heuristic approach. Fur- ther research is recommended to scrutinize the rules of warehouse selection in order to find the second best decision which is as close as possible to the best one. REFERENCES [1] R. K. Ahuja, T. L. Magnanti and J. B. Orlin, “Network Flows,” Prentice Hall, Hoboken, 1993. [2] K. S. Bhutta, F. Huq, G. Frazier and Z. Mohamed, “An Integrated Location, Production, Distribution and Invest- ment Model for a Multinational Corporation,” Interna- tional Journal Production Economics, Vol. 86, No. 3, 2003, pp. 201-216. doi:10.1016/S0925-5273(03)00046-X [3] L. Dupont, “Branch and Bound Algorithm for a Facility Location Problem with Concave Site Dependent Costs,” International Journal Production Economics, Vol. 112, No. 1, 2008, pp 245-254. doi:10.1016/j.ijpe.2007.04.001 [4] F. Glover, D. Klingman and N. V. Phillips, “Network Models in Optimization and Their Applications in Prac- tice,” John Wiley & Sons, Inc., Hoboken, 1992. doi:10.1002/9781118033173 [5] Nahry and S. Soehodho, “Consideration of the Dy- namic of Traffic Congestion on Location Model,” Proceedings the 16th HKSTS International Conference, Hong Kong, 2011, (Unpublished). [6] G. T. Ross and R. M. Soland, “A Multicriteria Approach to the Location of Public Facilitis,” European Journal of . 5, 1980, pp. 307-321. doi:10.1016/0377-2217(80)90142-3 e Operational Research, Vol. 4, No y, “Strategic Design of Dis- tri- bution System of State-Owned Companies: Preliminary tage of Logistics Research Ses and Eva on Model Parameters,” International Journal on Logistics TranspoVol. 3, N9. [8] Soehodhry, “T Consideration in Design of Freight Distribution System,” IATSS Research, 34, Nopp. 55- [9] S. Soehodho and Nahry, “Optimization of Location Mo- of Capaetwork Transpol. o. 1, 2-68. [10] ty Location Pro- ing ch,s andons ch,9, 23-2589. [7] S. Soehodho and Nahr Seri luation and rtation, o. 1, 200 S. o and Nahraffic Flow Vol. ., 1, 201061. del citated N,” Jurnal ortasi, V 11, N011, pp. 59 M. Sun, “Solvin blem g the Uncapac Tabu S itated Facili Compute Us Resear ear Vol. 33, No. ” r 006, pp. 256 Operati Copyright © 2012 SciRes. JTTs  N. YUSUF ET AL. 49 doi:10.1016/j.cor.2005.07.014 [11] Y. Bai, T. Hwang, S. Kang and Y. Ouyang, “Biofuel Re- finery Location and Supply Chain Planning under Traffic ransportation Research, Part B, Vol. 45, 162-175. doi:10.1016/j.trb.2010.04.006 Congestion,” T No. 1, 2011, pp. Copyright © 2012 SciRes. JTTs |