 Geomaterials, 2012, 2, 1-9 http://dx.doi.org/10.4236/gm.2012.21001 Published Online January 2012 (http://www.SciRP.org/journal/gm) 1 Soil Physical Properties as Predictors of Soil Strength Indices: Trinidad Case Study Ronald Roopnarine1, Gaius Eudoixe1*, Derek Gay2 1Department of Food Production, University of the West Indies, St. Augustine, Trinidad 2Department of Civil Engineerin g, University of the West Indies, St. Augustine, Trinidad Email: *ronald.roopnarine@sta.uwi.edu Received October 18, 2011; revised November 29, 2011; accepted December 11, 2011 ABSTRACT Characterizing soil engineering properties and analyzing their spatial pattern has a key role in managing soils for dif- ferent land uses. A study was conducted to generate two soil engineering properties; shear strength (SS) and friction angle (FA) both related to slope stability from the datab ase of soil agricu ltural indices. A total of 30 so ils were analyzed in two batches of 15 for physicochemical and engineering properties. The first batch was subjected to correlation and regression analysis among properties, whilst the second was used to validate model predictions. Soil friction angle showed strong significant correlations with clay and sand percent. Further stepwise regression resulted in these two properties being the only predictors of peak and residual friction angle. None of the tested properties explained shear strength distribution among the soils. The validated model predicted friction angles for the larger database, which showed non-significant temporal differences from the present dataset used in this study. Spatially distribution of both peak and residual friction angles varied across Trinidad, higher friction angles being associated with higher slopes. Combination of this data with other spatial land attributes would greatly improve land management and slope stability prediction. Keywords: Soil; Friction Angle; Engineering Properties 1. Introduction Estimation of soil strength indices is required for the de- sign of foundations, retaining walls, and pavements in ci- vil engineering applications and for determining the re- sistance to traction and tillage tools in agricultural appli- cations (Freudlund & Vanapali, 2002) [1]. These indices are also essential in assessing the stability of slopes and soil, and can be used to construe the ability of a soil to with- stand stresses and strains associated with naturally occur- ring instances of; increased pore pressure, cracking, swel- ling, development of slickensides, leaching, weathering, undercutting, and cyclic loading (Duncan & Wright, 2005) [2] as well as anthropogenic changes to the landscape. Shear strength and friction angle are two important soil strength indices which have not been given due at- tention, particularly in a country dominated by structur- ally weak and expanding soils (Brown and Bally, 1967) [3]. Locally, available soil information and spatial char- acterization have been centered on agricultural data. Soil physical and chemical data, along with profile descrip- tions are provided by Brown and Bally (1967) [3] and Smi- th (1983) [4] . Changing land use and development has seen alternative uses for this information with obvious limitations. Soil engineers rely on the existing soil phy- siochemical data and their theoretical relationships with engineering strength parameters to support and address land use decisions and slop e stability issues. The need to estimate and spatially characterize these engineering bas- ed indices for a wide range of soils using a quick and re- liable method is paramount to proper planning and man- agement. The difficulty and in some cases the high cost of at- taining the soil strength indices has led to many resear- chers seeking correlations with easily measured soil in- dex properties (Eid, 2006) [5]. Several empirical proce- dures have been developed over the years to predict the shear strength of soils, particularly unsaturated soils. Drained residual strength was shown to correlate with clay content as well as type of clay minerals (Stark & Eid, 1997) [6]. The authors also showed strong correlations between drained residual strength and liquid limit. The soil water characteristic curve (SWCC) along with satu- rated shear strength parameters have been used to predict the shear strength of unsaturated soils (Vanapalli et al., 1996 [7]; Freudlund et al., 1996 [8]; Oberg & Salfours, 1997 [9]; Khallili & Khabbaz, 1997 [10]; Bao et al., *Corresponding author. C opyright © 2012 SciRes. GM  R. ROOPNARINE ET AL. 2 1998 [11]). Other investigators suggested mathematical relationships such as elliptical and hyperbolic functions to predict the shear strength of unsaturated soils (Abra- mento & Carvalho, 1990 [12]; De Campos & Carillo, 1995 [13]; Escario & Juca, 1989 [14]; Lu, 1992 [15]; Shen & Yu, 1996 [16]; Xu, 1997 [17]). Soil friction angle, which is a measure of the ability of a unit of soil to withstand a shear stress, is a derivative of the measurement of soil shear strength. It is the angle, measured between the normal force (confining stress) and the resultant force within the soil colu mn (Coulomb, 1776) [18] that is attained when failure just occurs in response to a shearing stress. Peak soil friction angle refers to the initial angle attained from the initial shearing phase, while the residual friction angle refers to the angle obtained following the initial failure of the soil sample. Skempton (1964) [19], introduced the concept of residual strength and residual friction angle and proposed that it is this “softened strength” that governs the behavior of re- activated landslides and demonstrated that residual streng- ths as well as residual friction angles are typically much lower than their peak counterparts for clayey soils and that they consequ ently have a detrimental effect on long- term slope stability. The concept has since received con- siderable attention. Specifically, research efforts have fo- cused on determining correlations between the residual friction angle of soils and soil indexes such as Atterberg limits, and clay fraction (Kaya & Kwong, 2007) [20]. Harris et al. (1984) [21] proposed that specific engineer- ing properties were related to particle size distribution and mineralogy. Tsiambaos (1991) [22] studied the in- fluence of the variation in clay mineral content on the residual strength of soils and attempted correlations with clay size faction and plasticity index. Tugrul & Zarif (1998) [23] showed that there were strong correlations between engineering properties of soils and particle size distribution and indicated that particle size distribution was more influential than mineralogy. Relationships between engine ering param eters and m ore specifically shear strength and friction angle with simple soil index properties vary across regions, which indicate a need for localized inv estigations. This study f ocused on identifying and modeling such relationships, across a wi- de range of soils. 2. Methodology 2.1. Soil Selection and Sampling According to Suter (1960) [24] Trinidad is divided into five physiographic zones (northern range, northern basin, central range, southern range and southern basin), which provided the rationale for selecting a cross section of soils. A total of 15 soils were selected with at least two soil series in each zone to encompass the diversity of soil properties (Tabl e 1 ). An additional 15 soils were selected following model development and used to validate the model. For each of the initial 15 soil series two types of samples were taken (disturbed and undisturbed) at a dep- th between (1.6 - 2.0 m). For the 15 soil series used for validation, only undisturbed samples were taken. Undis- turbed samples were taken using a core (height 0.15 m, diameter 0.073 m) that was inserted vertically using a core sampler. The core sample was then sealed in plastic wrap and stored for laboratory analysis. Disturbed sam- ples were collected using an auger and were prepared for subsequent laboratory analysis by air drying and grinding to pass a 2 mm sieve. Samples were stored in plastic con- tainers until analyzed. In total 25% of the soil series were represented in the stud y. 2.2. Laboratory Analysis 2.2.1. D isturbe d Samples The disturbed samples were subjected to physical and chemical tests based on expected relationships with soil strength indices (Kaya & Kwong, 2007 [20]; Harris et al., 1979 [21]) and availab le soil survey data. Six parameters were analyzed including; effective cation exchange capa- city determined by the barium chloride method (Sch- werdtfeg er & Hender shot, 200 9) [25 ], pH determined po- tentiometrically in a soil to water ratio of 1:1 (Thomas, 1996) [26], particle size distribution determined using the hydrometer method (Gee & Or, 2002) [27], Atterberg limits determined according to ASTM 2000a (McBride, 2000) [28], non-capillary void space and bulk density (Db) dete rmined by (Brady & W ei l, 2 002) [29]. Table 1. Physiographic zones, and families of the selected soils. Physiographic ZoneSoil Series Family† San Souci fine, mixed Anglais clayey, kaolinitic Diego Martin coarse-loamy, carbonatic Northern Range Maracas clayey, oxidic Piarco clayey, kaolinitic Bejucal very-fine, mixed, acid Northern Basin River Estate fine-loamy, micaceous Montserrat fine, oxidic Biche very-fine, mixed Brasso very-fine, montmorillonitic, nonacid Central Range Marac very-fine, mixed Princess Town very-fine, montmorillonitic, nonacid Moruga fine-loamy, mixed Talparo very-fine, mixed, acid South Range and Basin Ecclessville very-fine, mixed, acid Copyright © 2012 SciRes. GM  R. ROOPNARINE ET AL. Copyright © 2012 SciRes. GM 3 2.2.2. Undistu r be d Samples A modified version of the drained direct shear test (Va- napalli, 2002) [30 ] was used to determine shear strength. Soils were subjected to three vertical-confining stresses (0.5 normal stress, normal stress and 1.5 normal stress). The modifications involved using a constant shear rate on all samples of 0.35 mm·min–1 and a constant series of confining stresses. This was done to ensure that all the samples were exposed to similar stresses throughout the experiment and to ensure that there was consistency in the process. A plot of the maximum shear stresses versus the vertical (normal) confining stresses for each of the tests was produced. From the plot, a straight-line ap- proximation of the Mohr-Coulomb failure envelope cur- ve was drawn. The drained direct shear tests allowed the determination of peak and residual shear strength and friction angle respectively. This was conducted on all 30 undisturbed soils. The initial fifteen (Table 1 ) were used in model development, the remaining 15 where used to validate the mo del. 2.3. Statistical Analysis and Model Development Person’s product moment correlation s were performed to determine variable colinearity and to aid in the selection of predictive variables, of soil strength parameters. Vari- ables were subjected to a stepwise regression to deter- mine the best model for predicting FA and SS that con- tained statistically significant, intuitiv ely meaningful pre- dictive variables. Only data elements that contributed sig- nificantly (P < 0.05) to predicting FA and SS and that contributed greater than 5% to the overall improvement of the R2 were included in the equations. Where signifi- cant relationships were observed th e models were used to generate FA and SS from the entire Brown and Bally (1966 [31], 1967 [3]) database. To account for temporal variability of parameters, the generated data was statisti- cally compared to Brown and Bally, (1966 [31], 1967 [3]) for the respective soil series at the study depth, using t tests. The model was further validated with an indepen- dent dataset by comparing measured versus predicted values using Pearson’s correlations. The generated data was then used to produce geospatial engineering maps. Categories for friction angle were determined based on the range and standard deviation (SD) of the data. 3. Results 3.1. Characterization Data The range in properties of sampled soils used to develop the prediction equation s for SS and FA are shown in Ta- ble 2. A broad variation in taxonomical classification was seen, with differences in mineralogy and lithology, necessary criteria for validity and reliability. Normality tests indicated that the data was normally distributed. The clay and sand contents ranged from 27.2 - 94.3 and 1.74% - 56.7 % respectively. Similar br oad variation was seen for most soil properties, especially where cor- related to sand or clay (Table 3). Two soils sh owed alk a- line pH values, whilst 53% of the sampled group were strongly to extremely acid. Plastic and liquid limits ranged from 16.6 - 33.3 and 17.4% - 79.6 % respectively. A notable difference was observed between Anglais and Piarco series which are both described as clayey, kao- linitic but showed contrasting plastic index values, the latter being much higher (23.2%). Significant positive correlations were observ ed between plastic limits, ECEC and particle distribution (Table 3), with values for the former two properties increasing with increasing clay content. Capillary vo id space as well as bulk density was typical for mineral soils and showed minimal variation. The two properties were negatively correlated. Unex- pectedly, ECEC showed no relation to clay or sand con- tent, but ranged from 5.44 - 39.6 cmol+·kg–1. Table 2. Predictive soil properties used in developing SS and FA regression equations. Soil Series pH ECEC Clay Sand PL LL NCVP Db cmol+·kg–1 % g·cm–3 San Souci 6.36 21.4 34.0 44.7 26.7 39.0 6.65 1.39 Anglais 4.18 5.44 27.2 56.7 16.6 17.4 12.3 1.36 Diego Martin 6.86 12.5 34.6 47.1 25.0 22.5 7.99 1.37 Maracas 3.85 11.6 62.1 25.5 26.3 63.7 10.9 1.46 Piarco 3.45 14.3 39.6 51.6 23.2 56.5 10.8 1.47 Bejucal 3.95 20.2 94.3 1.74 25.0 64.5 1.73 1.17 River Estate 6.78 16.9 40.9 44.9 28.6 38.3 9.16 1.31 Montserrat 6.07 35.0 44.7 37.0 27.7 40.6 7.53 1.42 Biche 7.71 18.7 51.6 26.2 23.1 30.8 3.45 1.06 Brasso 6.98 19.8 58.3 28.2 31.3 50.8 5.13 1.53 Marac 4.01 22.8 58.3 29.2 33.3 43.5 6.95 1.34 Princess Town 7.3 39.6 79.2 13.4 33.3 79.6 12.9 1.20 Moruga 4.54 25.5 52.5 33.4 26.0 39.9 12.4 1.39 Talparo 5.93 33.3 93.2 4.77 32.7 61.0 3.82 1.45 Ecclessville 3.56 16.8 69.4 16.5 33.2 36.8 3.46 1.53  R. ROOPNARINE ET AL. 4 Table 3. Correlations betwee n soil proper ties and FA and SS. Soil Property† FA-P FA-R SS-P SS-RpH ECEC Sand Silt Clay PL LL Db (˚) (kN·m–2) (cmol·kg–1)(%) (g·cm–3) FA-R 0.843*** SS-P 0.281 0.153 SS-R 0.365 0.401 0.732** pH –0.038 0.061 –0.282 0.025 ECEC –0.392 –0.458 0.187 0.1260.363 Sand 0.720** 0.566* 0.097 0.097–0.043–0.523 Silt 0.475 0.651* 0.059 0.1510.340–0.319 0.618* Clay –0.711** –0.636* –0.094 –0.120–0.0610.509 –0.975***–0.776** PL –0.688** –0.634* 0.092 0.0010.3510.647* –0.612* –0.365 0.593* LL –0.543* –0.679** 0.005 0.132–0.0910.545* –0.653* –0.755**0.735* 0.536* Db† 0.118 0.034 0.351 0.115–0.398–0.081 0.297 –0.062 –0.221 0.144 –0.044 CVS† –0.433 –0.194 –0.283 –0.258 0.1390.072 –0.603* –0.061 0.501 0.163 0.082–0.636* 3.2. Soil Engineering Properties and Model Development Peak SS ranged from 27.8 - 49.7 kN·m–2 with a SD of 6.61 kN·m–2 whilst peak FA ranged from 11.7˚ - 43.5˚ with a SD of 10.2˚ (Table 4). Peak FA showed strong and significant (P < 0.01) positive and negative correla- tions with sand (R2 = 0.720) , and clay (R2 = –0.7 11) and PL (R2 = –0.688) respectively. Similarly significant but less strong relationships were seen for residual FA. Soil physiochemical variables showed no relationship with ei- ther peak o r r esidual S S . Table 5 shows th e results of t tests used to compare % clay and sand of the study data set and Brown and Bally (1966, [31] 1967 [3]). There was no significant difference between the data set. Further correlation analysis reveal- ed significant (P < 0.05) positive relationships between these two data sets with R2 values of 0.747 and 0.731 for clay and sand respectively. This validated the us e of Bro- wn and Bally (1970), data set to generate predicted val- ues for peak and resid ual FA. Clay and sand content explained 80% and 70% of the variation in the peak and residual FA of the data set re- spectively. The following regression equations were de- veloped: FA-P24.50.159% clay0.357% sand FA-R = 92.80.886% clay0.723% sand (1) (2) Measured versus predicted peak and residual FA val- ues for Equations (1) and (2) regression models are shown in Figures 1(a) and (b). The 95% confidence in- tervals about the slope an d intercept of the regression line for prediction of both peak and residual FA, indicate no significant difference from unity (Table 5). Peak and residual FA prediction equations values compared ag- ainst the measured independent data set resulted in an R2 of 0.93 and 0.60 respectively. The generated peak and residual FA data were con- verted to spatial coordinates and are shown in Figures 2 and 3 respectively. Colour codes identify FA categories Table 4. Measured soil strength (SS) and friction angle (FA) of selected soils used in developing predictive equations. Soil Series SS-P SS-R FA-P FA-R kN·m–2 ˚ San Souci 43.9 35.8 41.8 37.9 Anglais 42.8 34.1 43.5 35.6 Diego Martin 39.3 28.3 33.8 25.9 Maracas 45.7 38.7 25.9 20.3 Piarco 48.6 30.6 39.9 15.5 Bejucal 27.8 20.2 11.7 10.5 River Estate 31.8 23.7 28.0 21.5 Montserrat 45.1 30.6 27.0 20.3 Biche 41.1 31.8 31.0 28.8 Brasso 32.4 26.0 21.4 19.3 Marac 43.5 38.9 19.0 16.5 Princes Town 45.1 37.0 15.5 9.1 Moruga 49.7 30.1 14.3 12.7 Talparo 47.4 33.5 16.7 11.7 Ecclessville 47.7 29.1 24.8 21.5 Table 5. Statistical indices of t tests for difference between data sets for regression variables. Data Set Sand Clay MeanSE P Mean SEP Our Study 29.64.4 57.5 5.5 Brown and Bally (1970)27.64.9 0.774 60.9 6.2 0.685 shown in association with soil series. Greater friction an- gles are associated with soils of the northern range and basin with the lower values within the central range and southern basin. Areas depicted in white represent regions for which no data was available which in most cases re- presented reclaimed land. 4. Discussion 4.1. Characterization Data The initial characterization of soil physiochemical prop- Copyright © 2012 SciRes. GM 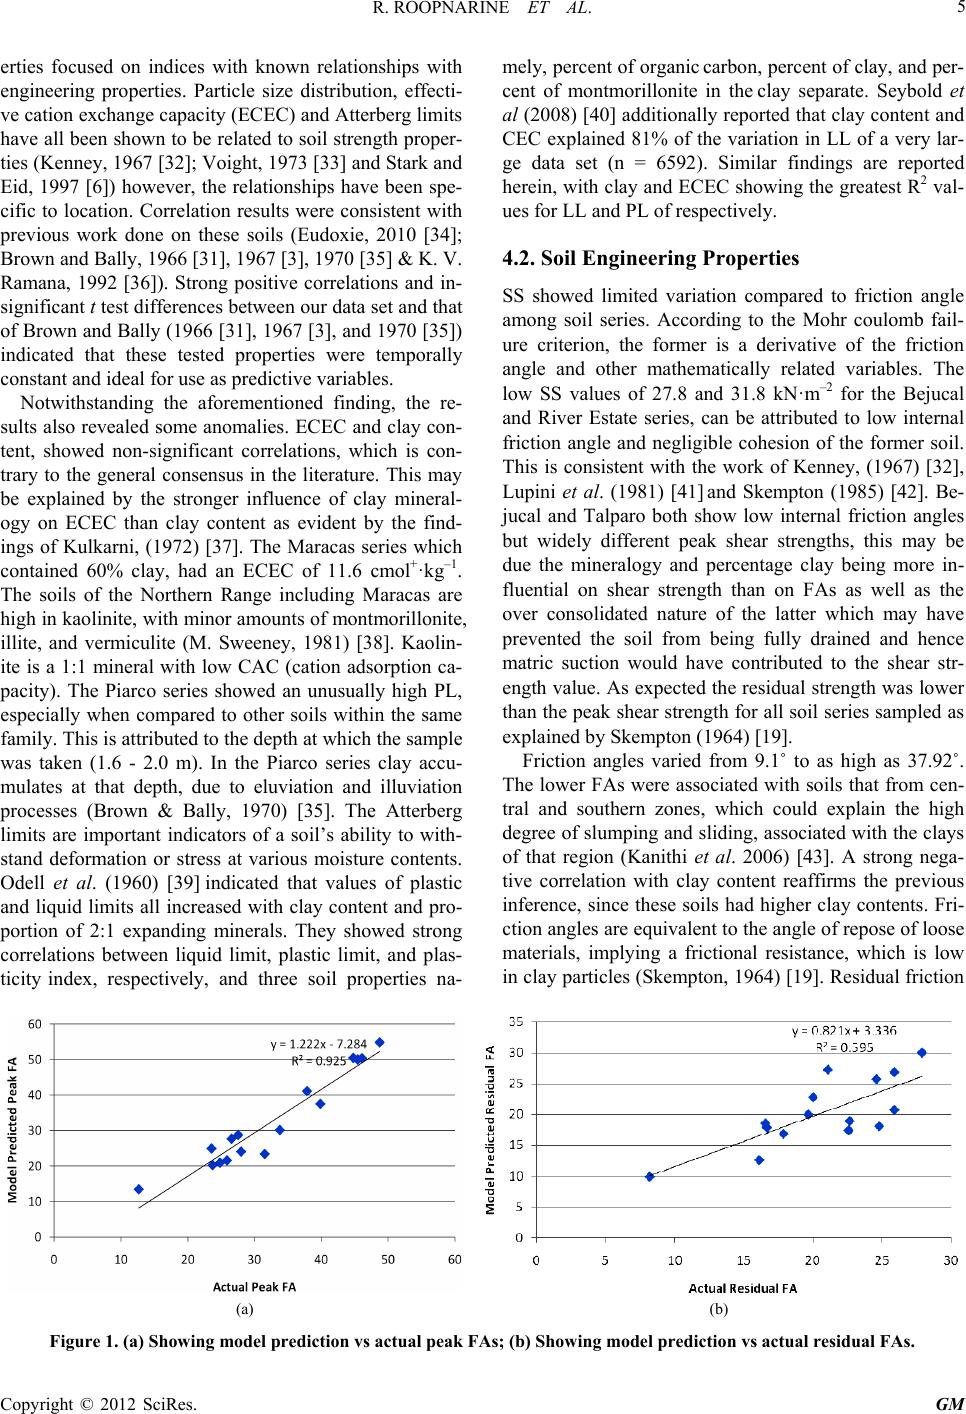 R. ROOPNARINE ET AL. 5 erties focused on indices with known relationships with engineering properties. Particle size distribution, effecti- ve cation exchange capacity (ECEC) and Atterberg limits have all been shown to be related to soil strength proper- ties (Kenney, 1967 [32]; Voight, 1973 [33] and Stark and Eid, 1997 [6]) however, the relationships have been spe- cific to location. Correlation results were consistent with previous work done on these soils (Eudoxie, 2010 [34]; Brown and Bally, 1966 [31], 1967 [3], 1970 [35 ] & K. V. Ramana, 1992 [36]). Strong positive correlations and in- significant t test differences between our data set and that of Brown and Bally (1966 [31], 1967 [3], and 1970 [35]) indicated that these tested properties were temporally constant and ideal for use as predictive variables. Notwithstanding the aforementioned finding, the re- sults also revealed some anomalies. ECEC and clay con- tent, showed non-significant correlations, which is con- trary to the general consensus in the literature. This may be explained by the stronger influence of clay mineral- ogy on ECEC than clay content as evident by the find- ings of Kulkarni, (1972) [37]. The Maracas series which contained 60% clay, had an ECEC of 11.6 cmol+·kg–1. The soils of the Northern Range including Maracas are high in kaolinite, with minor amounts of montmorillonite, illite, and vermiculite (M. Sweeney, 1981) [38]. Kaolin- ite is a 1:1 mineral with low CAC (cation adsorption ca- pacity). The Piarco series showed an unusually high PL, especially when compared to other soils within the same family. This is attributed to the depth at which the sample was taken (1.6 - 2.0 m). In the Piarco series clay accu- mulates at that depth, due to eluviation and illuviation processes (Brown & Bally, 1970) [35]. The Atterberg limits are important indicators of a soil’s ability to with- stand deformation or stress at various moisture contents. Odell et al. (1960) [39] indicated that values of plastic and liquid limits all increased with clay content and pro- portion of 2:1 expanding minerals. They showed strong correlations between liquid limit, plastic limit, and plas- ticity index, respectively, and three soil properties na- mely, percent of organic carbon, percent of clay, and per- cent of montmorillonite in the clay separate. Seybold et al (2008) [40] additionally reported that clay content and CEC explained 81% of the variation in LL of a very lar- ge data set (n = 6592). Similar findings are reported herein, with clay and ECEC showing the greatest R2 val- ues for LL and PL of respectively. 4.2. Soil Engineering Properties SS showed limited variation compared to friction angle among soil series. According to the Mohr coulomb fail- ure criterion, the former is a derivative of the friction angle and other mathematically related variables. The low SS values of 27.8 and 31.8 kN·m–2 for the Bejucal and River Estate series, can be attributed to low internal friction angle and negligible cohesion of the former soil. This is consistent with the work of Kenney, (1967) [32], Lupini et al. (1981) [41] and Skempton (1985) [42]. Be- jucal and Talparo both show low internal friction angles but widely different peak shear strengths, this may be due the mineralogy and percentage clay being more in- fluential on shear strength than on FAs as well as the over consolidated nature of the latter which may have prevented the soil from being fully drained and hence matric suction would have contributed to the shear str- ength value. As expected the residual strength was lower than the peak sh ear strength for all soil series sampled as explained by Skempton (1964 ) [1 9]. Friction angles varied from 9.1˚ to as high as 37.92˚. The lower FAs were associated with soils that from cen- tral and southern zones, which could explain the high degree of slumping and sliding, associated with the clays of that region (Kanithi et al. 2006) [43]. A strong nega- tive correlation with clay content reaffirms the previous inference, since these soils had higher clay contents. Fri- ction angles are equivalent to the angle of repose of loose materials, implying a frictional resistance, which is low in clay particles (Skempton, 1964) [19]. Residual friction (a) (b) Figure 1. (a) Showing mode l prediction vs actual peak FAs; (b) Showing mode l prediction vs actual residual FAs. Copyright © 2012 SciRes. GM 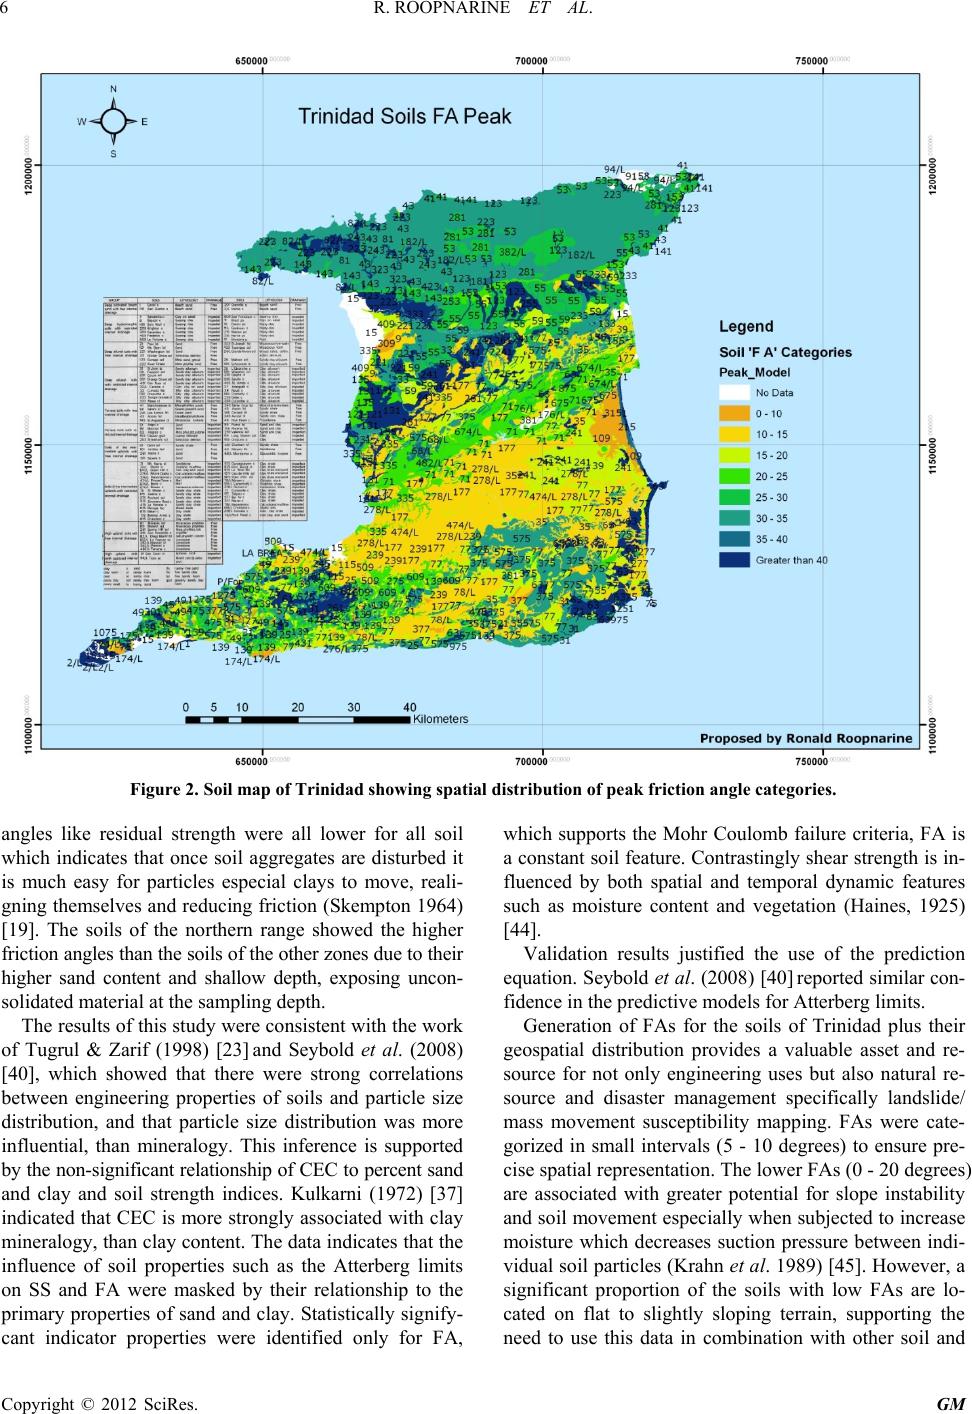 R. ROOPNARINE ET AL. 6 Figure 2. Soil map of Trinidad showing spatial distribution of peak friction angle categories. angles like residual strength were all lower for all soil which indicates that once soil aggregates are disturbed it is much easy for particles especial clays to move, reali- gning themselves and reducing friction (Skempton 1964) [19]. The soils of the northern range showed the higher friction angles than the soils of the other zones due to their higher sand content and shallow depth, exposing uncon- solidated material at the sampling depth. The results of this study were consistent with the wo rk of Tugrul & Zarif (1998) [23] and Seybold et al. (2008) [40], which showed that there were strong correlations between engineering properties of soils and particle size distribution, and that particle size distribution was more influential, than mineralogy. This inference is supported by the non-significant relationship of CEC to percent sand and clay and soil strength indices. Kulkarni (1972) [37] indicated that CEC is more strongly associated with clay mineralogy, than clay content. The data indicates that the influence of soil properties such as the Atterberg limits on SS and FA were masked by their relationship to the primary properties of sand and clay. Statistically sig nify- cant indicator properties were identified only for FA, which supports the Mohr Coulomb failure criteria, FA is a constant soil feature. Contrastingly shear strength is in- fluenced by both spatial and temporal dynamic features such as moisture content and vegetation (Haines, 1925) [44]. Validation results justified the use of the prediction equation. Seybold et al. (2008) [40] reported similar con- fidence in the predictive models for Atterberg limits. Generation of FAs for the soils of Trinidad plus their geospatial distribution provides a valuable asset and re- source for not only engineering uses but also natural re- source and disaster management specifically landslide/ mass movement susceptibility mapping. FAs were cate- gorized in small intervals (5 - 10 degrees) to ensure pre- cise spatial representation. The lower FAs (0 - 20 degrees) are associated with greater potential for slope instability and soil movement especially when subjected to increase moisture which decreases suction pressure between indi- vidual soil particles (Krahn et al. 1989) [45]. How ever, a significant proportion of the soils with low FAs are lo- cated on flat to slightly sloping terrain, supporting the need to use this data in combination with other soil and Copyright © 2012 SciRes. GM 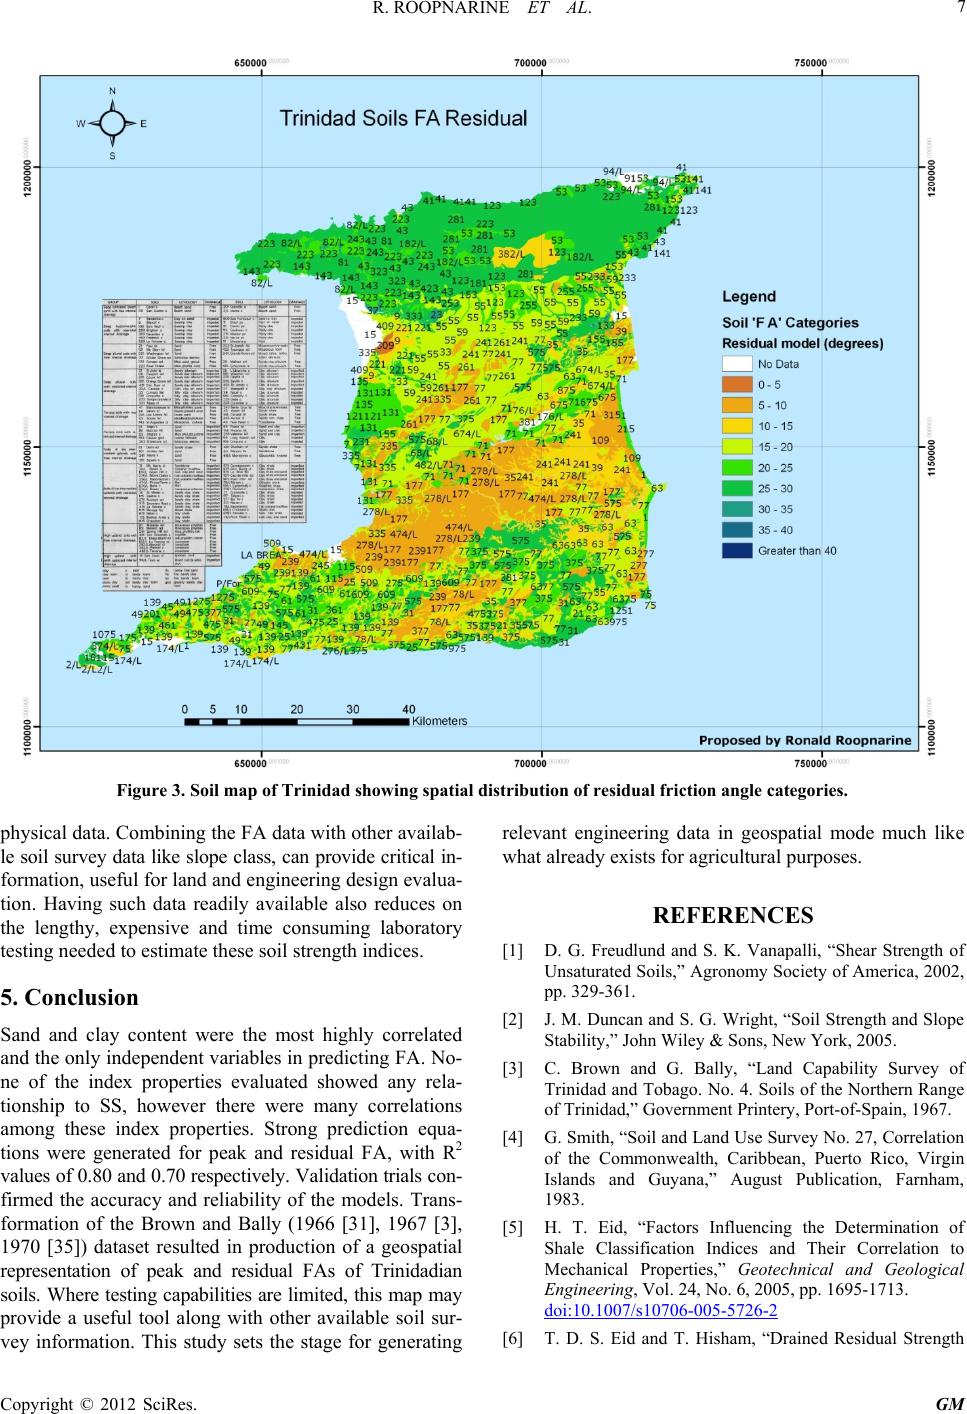 R. ROOPNARINE ET AL. 7 Figure 3. Soil map of Trinidad showing spatial distribution of residual friction angle categories. physical data. Combinin g the FA data with o ther availab- le soil survey data like slope class, can provide critical in- formation, useful for land and engineering design evalua- tion. Having such data readily available also reduces on the lengthy, expensive and time consuming laboratory testing needed to estimate these soil strength indices. 5. Conclusion Sand and clay content were the most highly correlated and the only independen t variables in predicting FA. No- ne of the index properties evaluated showed any rela- tionship to SS, however there were many correlations among these index properties. Strong prediction equa- tions were generated for peak and residual FA, with R2 values of 0.80 and 0.70 respectively. Validation trials con- firmed the accuracy and reliability of the models. Trans- formation of the Brown and Bally (1966 [31], 1967 [3], 1970 [35]) dataset resulted in production of a geospatial representation of peak and residual FAs of Trinidadian soils. Where testing capabilities are limited, this map may provide a useful tool along with other available soil sur- vey information. This study sets the stage for generating relevant engineering data in geospatial mode much like what already exists for agricultural purposes. REFERENCES [1] D. G. Freudlund and S. K. Vanapalli, “Shear Strength of Unsaturated Soils,” Agronomy Society of America, 2002, pp. 329-361. [2] J. M. Duncan and S. G. Wright, “Soil Strength and Slope Stability,” John Wiley & Sons, New York, 2005. [3] C. Brown and G. Bally, “Land Capability Survey of Trinidad and Tobago. No. 4. Soils of the Northern Range of Trinidad,” Government Printery, Port-of-Spain, 1967. [4] G. Smith, “Soil and Land Use Survey No. 27, Correlation of the Commonwealth, Caribbean, Puerto Rico, Virgin Islands and Guyana,” August Publication, Farnham, 1983. [5] H. T. Eid, “Factors Influencing the Determination of Shale Classification Indices and Their Correlation to Mechanical Properties,” Geotechnical and Geological Engineering, Vol. 24, No. 6, 2005, pp. 1695-1713. doi:10.1007/s10706-005-5726-2 [6] T. D. S. Eid and T. Hisham, “Drained Residual Strength Copyright © 2012 SciRes. GM  R. ROOPNARINE ET AL. 8 of Cohesive Soils,” Journal of Geotechnical Engizeering, Vol. 121, No. 9, 1997, pp. 335-343. [7] S. K. Vanapalli, D. G. Fredlund, D. E. Pufahl and A. W. Clifton, “Model for the Prediction of Shear Strength with Respect to Soil Suction,” Canadian Geotechnical Journal, Vol. 33, No. 3, 1996, pp. 379-392. doi:10.1139/t96-060 [8] D.G. Freudlund, S. K. Vanapalli and D. E. Pufahl, “The Relationship between the Soil-Water Characteristic Curve and the Shear Strength of a Compacted Glacial Till,” Geotechnical Testing Journal, Vol. 19, No. 3, 1996, pp. 259-268. doi:10.1520/GTJ10351J [9] A. Oberg and G. Salfours, “Determination of Shear Strength Parameters of Unsatura ted Silts and Sa nds Base d on the Water Retention Curve,” Geotechnical Testing Journal, Vol. 20, No. 1, 1997, pp. 40-48. doi:10.1520/GTJ11419J [10] N. Khalili and M. H. Khabbaz, “A Unique Relationship for x for the Determination of the Shear Strength of Un- saturated Soils,” Geotechnique, Vol. 48, No. 5, 1997, pp. 681-687. doi:10.1680/geot.1998.48.5.681 [11] C. G. Bao, B. Gong and L. Zan, “Properties of Unsatu- rated Soils and Slope Stability of Expansive Soils,” 2nd International Conference on Unsaturated Soils, Beijing, 27-30 August 1998. [12] M. Abramento and C. S. Carvalho, “Geotechnical Pa- rameters for the Study of Natural Slope Instabilization at Serra do Mar-Brazilian Southeast,” Proceeding of the 12th International Conference on Soil Mechanics and Foundation Engineering, Rio de Janeiro, Vol. 3, 1990, pp. 1599-1602. [13] T. M. P. De Campos and C. W. Carillo, “Direct Shear Testing on Unsaturated soils from Rio de Janerio,” Pro- ceeding of the 1st International conference on an unsatu- rated soil, Paris, 6-8 September 1995, pp. 31-38. [14] V. Escario and J. F. T. Jucá, “Strength and Deformation of Partially Saturated Soils,” Proceedings of the 12th In- ternational Conference on Soil Mechanics and Founda- tion Engineering, Rio de Janeiro, Vol. 2, 1989, pp. 43-46. [15] Z. Lu, “The Relationship of Shear Strength to Swelling Pressure for Unsaturated Soils,” Chinese journal of geo- technical engineering, Vol. 14, No. 3, 1992, pp. 1-8. [16] Z. Shen and S. Yu, “The Problems in the Present Studies on Mechanics of Unsaturated Soils,” Proceedings of the Symposium on Geotechnical Aspects of Regional Soils, Atomic Energy Press, Beijing, 1996. [17] Y. Xu, “Mechanical Properties of Unsaturated Expansive Soils and Its Application to Engineering,” Ph.D Thesis, Hohai University, Nanjing, 1997. [18] C. A. Coulomb, “Essai sur une Application des Regles des Maximis et Minimis a Quelquels Problemesde Statique Relatifs, a la Architecture,” Mem. Acad. Roy. Div. Sav, Vol. 7, 1776, pp. 343-387. [19] A. W. Skempton, “4th Rankine Lecture: Long-Term Sta- bility of Clay Slopes,” Géotechnique, Vol. 14, No. 2, 1964, pp. 77-101. doi:10.1680/geot.1964.14.2.77 [20] A. Kaya and K. P. Kwong, “Evaluation of Common Prac- tice Empirical Procedures for Residual Friction Angle of Soils: Hawaiian Amorphous Materials Rich Colluvial Soil Case Study,” Engineering Geology, Vol. 92, No. 1-2, 2007. doi:10.1016/j.enggeo.2007.03.002 [21] W. G. Harris, L. W. Zelazny, J. C. Parker, J. C. Baker, R. S. Weber and J. H. Elder, “Engineering Properties of Soils as Related to Mineralogical and Particle-Size Vari- ables,” Soil Science Society of America Journal, Vol. 48, 1984, pp. 978-982. doi:10.2136/sssaj1984.03615995004800050005x [22] G. Tsiambaos, “Correlation of Mineralogy and Index Properties with Residual Strength of Iraklion Marls,” En- gineering Geology, Vol. 30, No. 3-4, 1991, pp. 357-369. doi:10.1016/0013-7952(91)90068-V [23] A. Tugrul and I. H. Zarif, “The Influence of Mineralogi- cal Textural and Chemical Characteristics on the Durabil- ity of Selected Sandstone in Istanbul, Turkey,” Bulletin of Engineering Geology and the Environment, Vol. 57, No. 2, 1998, pp. 185-190. doi:10.1007/s100640050034 [24] H. Suter, “The Gene ral and Economic Ge ology of T ri n i da d , BWI,” Colonial Geology and Mineral Resources: The Quarterly, HMSO, 1960. [25] D. Schwertfeger and W. Hendershot, “Determination of Effective Cation Exchange Capacity and Exchange Acidity by a One-Step BaCl2 Method,” Soil Science So- ciety of America, Vol. 73, No. 2, 2009, pp. 737-743. doi:10.2136/sssaj2008.0009 [26] G. W. Thomas, “Soil pH and Soil Acidity,” In: R. S. L. Sparks and D. L. Swift, Methods of Soil Analysis. Part 3—Chemical Methods, Soil Science Society of America, 1996, pp. 475-490. [27] G. Gee and D. Orr, “Particle-Size Analysis,” Method of Soil Physical Analysis, Soil Science Society of America, 2002, pp. 278-281. [28] R. McBride, “Methods of Soil Analysis: Physical,” Soil Science Society of America, 2000. [29] R. N. C. Brady and R. Weil, “The Nature and Properties of Soils,” 13th Edition, Prentice-Hall, London, 2002. [30] S. K. Vanapalli, “A Simple Technique for Determining the Shear Strength of Fine-Grained Unsaturated Soils us- ing the Conventional Direct Shear Apparatus,” 2nd Cana- dian Specialty Conference on Computer Applications in Geotechnique, Winnipeg, 28-30 April 2002, pp. 245-253. [31] C. Brown and G. Bally, “Land Capability Survey of Trinidad and Tobago. No. 3. Soils of the Northern Range of Trinidad,” Trinidad Government Printery, Port-of- Spain, 1966. [32] T. C. Kenney, “Influence of Mineralogical Composition on the Residual Strength of Natural Soils,” Shear Str- ength of Natural Soils and Rock, Oslo Geotech, Oslo, Vol. 1, 1967, pp. 123-129. [33] B. Voight, “Correlation between Atterberg Plasticity Limits and Residual Strength of Natural Soils,” Geote- chnique, Vol. 23, 1973, pp. 265-267. doi:10.1680/geot.1973.23.2.265 [34] G. Eudoxie, “Nitrogen Enigma in Tropical Soils,” VDM Verlag Dr. Muller Aketiengesellschaft & Co. KG, Berlin, 2010. Copyright © 2012 SciRes. GM  R. ROOPNARINE ET AL. Copyright © 2012 SciRes. GM 9 [35] C. Brown and G. Bally, “Land Capabilites Survey of Trinidad and Tobago. No. 5. Port-of-Spain,” Government Printery, Port-of-Spain, 1970. [36] K. V. Ramana, “Humid Tropical Expansive Soils of Trinidad: Their Geotechnical Properties and Areal Dis- tribution,” Engineering Geology, Vol. 34, 1992, pp. 27-44. doi:10.1016/0013-7952(93)90041-A [37] K. Kulkarni and N. K. Savant, “Effect of Soil Compac- tion on Root-Cation Exchange Capacity of Crop Plants,” Plant and Soil, Vol. 48, No. 2, 1972, pp. 269-278. doi:10.1007/BF02187239 [38] M. Sweeney, “A Mineralogical Study of Some West In- dian Soil-Clays,” Thermochimica Acta, Vol. 48, No. 3, 1981, pp. 323-331. doi:10.1016/0040-6031(81)80253-5 [39] R. T. Odell, T. H. Thornburn and L. J. Mckenzie, “Rela- tionships of Atterberg Limits to Some Other Properties of Illinois Soils,” Soil Science Society of America Proceed- ings, Vol. 24, No. 4, 1960, pp. 297-300. doi:10.2136/sssaj1960.03615995002400040025x [40] C. A. Seybold, A. E. Moustafa and J. E. Robert, “Linear Regression Models to Estimate Soil Liquid Limit and Plasticity Index From Basic Soil Properties,” S oil Scie nce, Vol. 173, No. 1, 2008, pp. 25-34. doi:10.1097/ss.0b013e318159a5e1 [41] A. E. Lupini and P. R. Vaughan, “The Drained Residual Strength of Cohesive Soils,” Geotechnique, Vol. 31, No. 2, 1981, pp. 181-213. doi:10.1680/geot.1981.31.2.181 [42] A. W. Skempton, “Residual Strength of Clays in Land- slides, Folded Strata and the Laboratory,” Geotechnique, Vol. 35, No. 1, 1985, pp. 3-18. doi:10.1680/geot.1985.35.1.3 [43] V. Khanithi and C. Khanhai, “Breaking Frontiers and Barriers in Engineering,” 4th LACCEI International Latin American and Caribbean Conference for Engineering and Technology (LACCET’2006), Puerto Rico, 21-23 June 2006. [44] W. Haines, “Studies in the Physical Properties of Soils: I. Mechanical Properties Concerned in Cultivation,” The Journal of Agricultural Science, Vol. 15, No. 2, 1925, pp. 178-200. doi:10.1017/S0021859600005669 [45] J. Krahn, D. G. Fredlund and M. J. Klassen, “Effect of Soil Suction on Slope Stability at Notch Hill,” Canadian Geotechnical Journal, Vol. 26, No. 2, 1989, pp. 269-278. doi:10.1139/t89-036
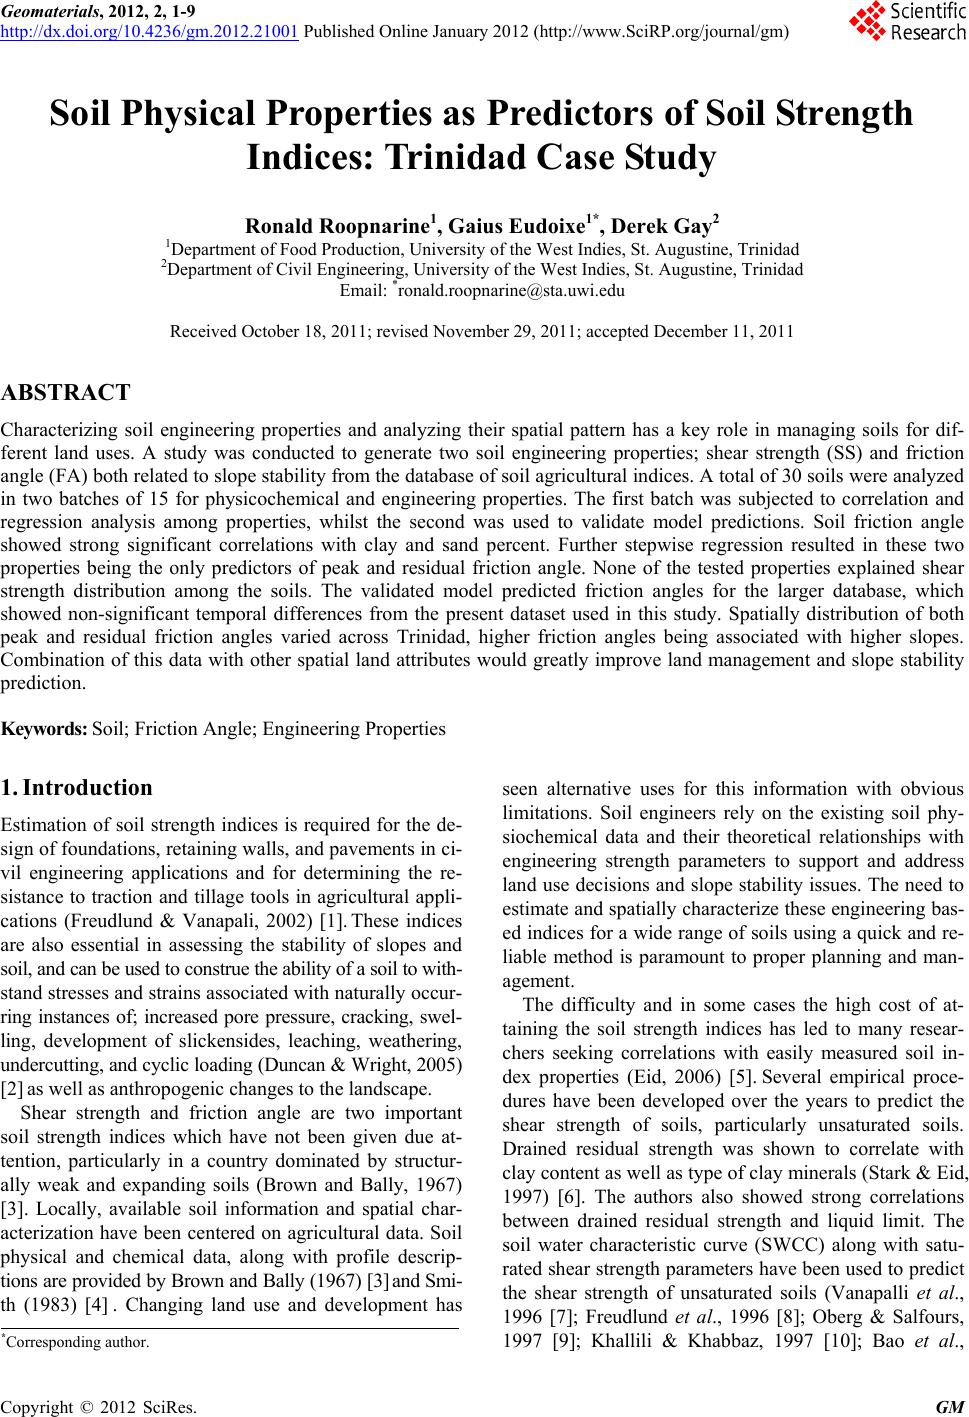
|