 Open Journal of Forestry 2012. Vol.2, No.1, 1-8 Published Online January 2012 in SciRes (http://www.SciRP.org/journal/ojf) http://dx.doi.org/10.4236/ojf.2012.21001 Copyright © 2012 SciRes. 1 Carbon Stock Changes in Soil and Aboveground Biomass from House Lot Development in King County, Washington, USA Stephen Por der 1, Deborah Lipson2, Robert Harrison3 1Ecology and Evolutionary Biology, Brown University, Providence, USA 2Center for Environmental Stud ies , Brown University, Providence, US A 3College of Forest Resources, University of Washington, Seattle, USA Email: stephen_porder@brown.edu Received November 28th, 2011; revised December 28th, 2011; acc epted January 6th, 2012 Fossil fuel burning and deforestation have driven dramatic increases in atmospheric CO2 since the indus- trial revolution. However, forests in the northern temperate region sequester a substantial (~0.6 Pg·yr–1) amount of carbon (C), largely through the regrowth of secondary forests that were originally cleared for timber over one hundred years ago. In the United States, however, some regions are approaching a maxi- mum regrowth as forests are cleared again, this time for suburban and exurban development. Here we ex- plore the effects of such development on C stocks in King County, WA, an area with high forest cover but rapid suburban expansion. We measured soil and biomass C on 18 paired-house/forest lots, and found house lots stored ~80 Mg·C·ha–1 less soil C, and between 130 and 280 Mg·C·ha–1 less above-ground bio- mass C than adjacent forest lots. Combining soil C losses with estimates of C emissions from forest products yields average C emissions of 130 - 280 Mg·C·ha–1, with the majority of losses occurring at the time of lot conversion. As a comparison, suburban dwellers drive ~30% more than city residents, but this increase in annual emissions from increased driving is 1% - 2.5% of the losses of C associated with con- verting forests to house lots. If forestland conversion in the Seattle area continues apace, in the coming decades C emissions each year from that land-use conversion will equal ~4% of King County’s 2008 C emissions. Keywords: Land-Use Change; Carbon; Urban Soils; Emissions; Urban Growth; Development Introduction Land-use change and the burning of fossil fuels have dra- matically increased atmospheric carbon dioxide (CO2) concen- trations since the industrial revolution, to a level not seen dur- ing the past 650 thousand years (IPCC 2007). Carbon (C) se- questration in regrowing forests, particularly in the northern temperate forest of North America and Europe, has partially offset these emissions (Pacala et al., 2001; Schimel et al., 2001; Houghton, 2007). However, as reforestation in some areas reaches a peak, and suburban and exurban development begins to re- verse forest regrowth (Wienert 2006; Dwyer et al., 2000), rates of C sequestration may slow. In the United States, most current deforestation for suburban development occurs in forests that were previously cleared, either for agriculture or silviculture. Since urba n and exurban landscapes account for 1.5 million·km2, or about 25% of the conterminous US, and have grown at an average rate of 24,600 km2·yr–1 for the past fifty years (Brown et al., 2005), the fate of C in secondary forested landscapes undergoing conversion to housing bears closer examination. Despite its potential importance, the effects of suburban de- velopment on soil and biomass C has only recently been as- sessed in several regions of the US (Pouyat et al., 2002). In two northeastern temperate cities, Boston and Syracuse, urban soils contained ~60% less C than was stored belowground pre-evel- opment, while in Chicago and Oakland soil C was slightly higher (4% - 6%) in urban soils (Pouyat et al., 2006). In more arid regions, including Phoenix (Oleson et al., 2006) and the Colorado Front Range (Ka ye et al., 2 005; Go lubiews ki, 2006 ; Qian & Follett, 2002), C was higher in residential soils than native grass or desert soils. Similar results from Larimer County, CO suggest that surface soils in urban lawns can contain as much as 65% more C than shortgrass steppe soils (Kaye et al., 2005), which is not surprising give n low organic C in semi-arid systems and the increased growth on lawns in response to water and fertilizer. In general, urban area s in arid regions have higher soil C than surrounding ecosystems and urban areas in wet, forested regions have lo wer soil C (Pataki et al., 2006). Whether changes in soil carbon content translates to emissions to the atmosphere is less well understo od. For example, in Kin g County, WA, large developments (>4 houses) typically remove all topsoil and ship it to a topsoil dump, whereas single house developments typi- cally remove soil from a 60 cm foundation footprint and spread it around the rest of the lot. The emission C from these soils to the atmosphere may be quite different. Similarly, quantifying development-driven C fluxes to the at- mosphere for above ground biomass (AGB) depends on more than documenting differences in C stocks pre and post devel- opment, since the fate of forest products must be considered when calculating atmospheric C emissions from that land use change. The fate of woody biomass can vary (lumber, paper, mulch, fuel, non-harvest residue), and with it the C released to the atmosphere. Estimates of C losses to the atmosphere from post-harvest biomass range between 30% - 77% over 90 years (Harmon et al., 1996; Heath et al., 1996; Perez-Garcia et al., 2006). Sc al i ng u p q ua n ti fi ed pl ot- l ev el C a ff ec ts is a l so di ff ic ul t  S. PORDER ET AL. given the spatial patchiness and complexity of urban landscape mosaics (Kaye et al., 2006). The goal of this study was to explore the effects of forest to house lot conversion on soil and biomass C stocks in King County, Washington, US, an area with high forest cover but rapid sub- urban expansion. Like many local governments in the US, King County is try ing to assess the so urces of its gree nhouse gas emis- sions, and has set the aggressive emission reduction target of bringing annual emissions 80% below 2007 levels by 2050 (http://your.ki ngcounty.gov/exec/news/2007/pdf/ClimatePlan.pdf). However, while the county recognizes that deforestation in- creases emissions and has taken some action to curb urban en- croachment into forests, the county does not currently include potential soil and biomass C losses associated with development in its estimates of emissions. Thus we explored these C losses from development represented a substantial fraction of regional emissions given potential projected growth scenarios. Methods Site Description Our 18 study sites were all in or around the City of Issaquah, Washington, US which covers an area of about 22 km2 in east- central King County to the east of Seattle and Lake Washington, in the foothills of the Northern Cascades. The climate is temper- ate, with an annual precipitation of 150 cm (Brown, 2008). The region is in the western he mlock zone, and supports a humid co- niferous forest (Franklin & Dyrness, 1973). The area is largely forested, with a mixture of private forestland and state forest; most of the forest was logged in the late 1800s and early 1900s, and thus is ~100 year old secondary growth (Robbins, 1985). The population of King County grew from 1.3 million to 1.7 million between 1980 and 2000 and is expected to grow to 2.2 million by 2030 (http://www.wsdot.wa.gov/planning/wtp/data- library/population/PopGrowthCounty.htm). An estimated 18,000 ha of King County forestland were converted to urban and sub- urban u se s betwe en 19 79 and 19 89 ( MacLean & B ol singer, 1997) and 36,400 ha were converted between 1988 and 2004 (Erick- son & Rogers, 2008). Similarly, some projections suggest that 21% of population growth in King County between 2000 and 2040 (362,000 people) will occur in unincorporated areas, many of which are for ested (Pu get Sound R egional C ouncil, 2008) . King County estimates that development of individual lots for single family residences constituted ~50% of all residential building permits for unincorporated areas (where much of the construction on forestland occurs) between 1998-2008 (King County Department of Development and Environmental Ser- vices, pers. Comm.). Across development types, fossil-fuel inten- sive lawnmowers, pesticides and fertilizers are sometimes used for lawn maintenance, and while this certainly would affect a lifecycle C analysis of development, we limit our analysis here to soil and bio mass C loss. We fo cused our study on single ho me developments, because it was not possible to assess the fate of excavated topsoil that was transported off site (as is often done in larger housing developments in the region). The sites we sampled spanned urban (>386 people·km–2), suburban (115 - 385 people·km–2), and exurban (19 - 114 peo- ple·km–2) areas, though the majority were in suburban settings (http://www.census.gov/population/censusdata/urdef.txt). We se- lected only sites whose lots had been cleared for the develop- ment of <5 homes (15 of 18 were cleared as single house lots), which makes it p robable that soil was not re moved from the pr o- pe rty during construction. Mo st of the houses wer e in hilly areas, because we restri cted our analysis to forest-to-ho me conversions , and much of the flat land in the region had been previously cleared for agriculture. The house lots ranged in elevation from 23 m - 330 m a.m.s.l. Th e underlying soi ls were Incepti sols and Entisols (Alderwood, Everett, Beausite, & Neilton soil series; Soil Survey Staff, 2008), which are typical of the glacial till- rich soils of the region. The house lots ranged from 1 - 88 years since development (mea n 28 year s). Lot size (i nclu ding un cleare d for est areas) ra nge d from 590 m2 - 28,000 m2, while the total area cleared ranged from 400 m2 - 5300 m2, and the house footprint from 130 m2 - 340 m2. The majority of the cleared area at each site was lawn, but the cleared area also included gardens, planted trees and shrubs, and lone trees left standing during the clearing process. Gardens accounted for ~6% of cleared area on the average house lot. We drew house lot soil C samples from the lawn, and at two sites we also dre w samples fro m gardens for comparis on. We as- sumed that the intact forest left in place on the property did not lose any C during development. Soil Carbon Determination At each house lot we took three soil samples from the lawn (at 1, 5, and 10 m perpendicular from the house) and one sample from an adjacent forest site within 200 m of the lawn. There was no difference in soil C between lawns and gardens (Appendix 1), so these were combined in further analyses. We used a hammer core to a depth of 25 cm to determine bulk density (Grossman & Reinsch, 2002). Bulk density is notoriously difficult to mea- sure in rocky soils (Vincent & Chadwick, 1994), and it was not possible to get home owner permission for the preferred method of excavating large areas quantitatively. Our use of a hammer co re certainly introduces erro r to our bulk den sity measurements , but that error is equally distributed between our two land use types. In the hole created by the hammer corer we used a twist auger to collect three samples to a total depth of 75 cm (25 cm - 42 cm, 42 cm - 59 cm, and 59 cm - 75 cm). Because of the high rock and gravel content of the soil we were unable to sample to 75 cm at every location, but we collected at least one core per house, and one per forest, to a depth of 42 cm and to a depth of 59 cm for all but four houses and four forests. Since there were no dif- ferences in either bulk density or soil C in house lot soils as a function of distance from the house (Appendix 1), we averaged our house lot samples and considered a paired house lot/forest for each site. We assumed, based on ten interviews with contractors, that 60 cm of soil was excavated from the house foundation and spread ar ound the site (and therefore included in the soil C values for the lawn). Since the mean house size was only 20% of the mean cl eared lot size (Appendix 1 ), this assumption is unlikely to sub- stantially influence our results. We conservatively assumed no soil C loss from beneath the driveway. All samples were air-dried at room temperature for a minimum of 48 hours and sieved through a 2 mm screen. We determined bulk density of the <2 mm fraction for the 0 cm - 25 cm core, and assumed bulk density did not change below 25 cm. This as- sumption underestimates soil losses from house lots, since sur- face soils were significantly less dense in forests than in house lo ts (0.77 vs 1.0 g· cm–3, respectively , p = .003; Appendix 1), and this difference likely gets smaller with depth. A subsample of each sample was ground in an agate mortar and pestle, dried at 65˚C for at least 48 hours, and analyzed for C concentration on 2 Copyright © 2012 SciRes.  S. PORDER ET AL. a Carlo Erba NC2100 model C/N analyzer. A second subsam- ple was dried at 105˚C and all stocks are reported per 105˚C oven-dried mass. Samples were run in duplicate, and 10% were run in triplicate. Ninety-five percent of the standards run as un- knowns were within 5% of their accepted value. All reported values are mea ns ± 1 S.E. unless othe rwise noted. Statistical com- parisons between forest and house lots were done in Matlab (Ver- sion 7.4, Mathworks, Inc.) via a paired t-test or ANOVA after test- ing that the data did not violate the assumptions of normality. Carbon in Biomass We did not measure biomass in forest lots adjacent to house lots, but instead calculated changes in AGB by comparing AGB on each house site with the range of forest AGB values reported for the Pacific Northwest (140 - 290 Mg·C·ha–1; Adams et al., 2005; Binkley et al., 1992; Hutyra et al., 2011), though more recent estimates are somewhat lower. We chose to use a bio- mass range, rather than to measure forest biomass directly for two reasons: 1) allometric equations developed for tree species in the region are problematic (Harrison et al., 2009); and 2) biomass lost at the time of clearing would not be the same as biomass in adjacent forests today, particularly for older home sites. Rather than include a non-random error in our assessment we chose to assess a reasonable range of biomasses that could give us an idea of the importance of soil relative to biomass C losses. Estimates of how much AGB C ends up as atmospheric C post-harvest also vary considerably, and we chose a range that encompasses the majority of the literature for these estimates. Heath et al. (1996) argued that 30% of biomass C from cleared forests in the United States is emitted as CO2 over 90 years by decomposition of wood products, and another 35% is emitted from biomass burning for energy. Because the latter likely re- places fossil fuels that would have been used anyway we do not consider this an additional loss of C associated with develop- ment per se, and use 30% over 90 years as a lower bound of AGB loss. For an upper bound, we use an estimate of 77% loss (Harmon et al., 1996). Thus we assume that 40 - 222 Mg·C·ha–1, less the amount of biomass still on the cleared portion of the house lot, are lost to the atmosphere in the 90 years after house development. We use 90 years as a time frame because it is ap- propriate for this study (the oldest house is ~90 years) and be- cause both Heath et al. (1996) and Harmon et al. (1996) give ag gregate emissions estimates based on C fate in forest pro ducts over this time period, since the collection period of the harvest data from the Forest Service was 1900-1990. Biomass on each house lot was calculated by measuring di- ameter at breast height (DBH) for all trees on the site and using a generic allometric equat ion to determine biomass (Jenkins et al. , 2004): 01 Above Ground Biom assExpBBlndbh (1) where B0 = –2.4800 and B1 = 2.4835; these parameters are mean values for mixed hardwoods (most house lots contained a broad mix of native softwoods and non-native planted hardwoods). While these parameters are meant specifically for trees growing in a canopied forest, using other c ommon esti mate s for B0 and B1 in this type of system resulted in changes of <5 Mg·C·ha–1. While some studies have shown that using allometric equations appro- priate for trees in a canopied forest can overestimate biomass of urban trees by ~20% (Nowak, 20 04), to our kn owledge this i ssue has not been explored in the Pacific Northwest, and other author s have argued that standard allometry may either over or under- estimate actual urban biomass (McHale et al., 2009). Regard- less, there was so little biomass (mean 8 Mg·C·ha–1) in house lots relative to forests (or soils) that the choice of allometric equation has very little influence on our results. We assumed AGB was 50% C (Schlesinger, 1997), and omitted both grass and shrubs under 1 m tall, since they account for <2% of total biomass in urban and subur ban settings (Golubiewski, 2006; Jo & McPherson, 1995). Finally, we conservatively assumed no belowground biomass loss because there was insufficient data to make a more nuanced estimate. Results Soil Carbon The mean surface (0 cm - 25 cm) soil C concentration was significantly higher in forests (6.4% ± .78%) than on house lots (3.8% ± .29%; p = .00005; Figure 1). Similarly, the 25 cm - 75 cm soils were significantly more C rich in forests than lawns (3.6% ± .65% versus 1.9% ± .20%; p = .006). The mean bulk densities for the forest and house lots also differed significantly at .77 ± .24 and 1.0 ± .05 g·cm–3, respectively (p = .003, n = 18). These data indicate that forest soils stored ~80 Mg more C ha-1 than house lot soils (240 ± 25 vs 160 ± 11 Mg·C·ha–1, respec- tively, p = .002). There was no significant difference in C con- centration between the three depths for the 25 cm - 75 cm sam- ples (p = .71) nor in bulk density or the means of the C conc en- tration among the three distances from the house (p = .55 and .18 respectively). Finally, there was no correlation between house age, or lot size, and soil C concentration (p = .4 and .2, respectively). Carbon in Biomass The aboveground C in biomass on the house lots ranged from 0 Mg - 44 Mg, with a mean of 8.0 ± 3.0 Mg·C·ha–1 (Figure 2). Na- tive trees, left behind on clearing, made up ~40% of the this bio- mass. There wa s n o co rr ela ti on betwee n age a n d bi omass o n hou se sites (r2 = .05, p = .38). Forest AGB C estimates drawn from the literature sugges t that there is 140 - 290 Mg ·C·h a –1 in AGB (A dams et al., 2005; Binkley et al., 1992; Hutyra et al., 2011). Assuming between 30% and 77% C emitted from this AGB over 90 years (Heath et al., 1996; Harmon et al., 1996) after conversion from forest to house lot, between 40 - 220 Mg·C·ha–1 are likely lost to the atmosphere over this time. If loss rates are invariant over 90 years, this sugg ests em issio ns of .4 0 - 2.4 Mg ·C·h a–1·yr–1. Figure 1. Percent carbon in house lot soils and forest soils. The error bars repre- sent 1 SE. p-values are from comparisons of forest and house soils at a given depth. Copyright © 2012 SciRes. 3  S. PORDER ET AL. Figure 2. Mean carbon stores in soil and aboveground biomass in house and fo- rest lots. The error bars for the house lots and the forest soil represent 1 SE. The error bar on forest AGB represent the range found in the lite- rature for this region. Discussion Soil Carbon and Biomass Loss Given the trajectory of suburban encroachment onto forests or reforested land, our results are important for those calculat- ing greenhouse gas budgets in the Pacific Northwest. Our data suggest that a pulse of C is released from the soils of a house lot during development that does not re-accumulate over time. Furthermore, the soil C loss associated with lot development is large (mean 80 Mg·ha–1), roughly 30% - 60% of the aboveground C loss. This finding is consistent with those of Pouyat et al. (2006) in cities with climates similar to that of this study, but contrasts with those of Golubiewski (2006), Kaye (2005) and Qian and Follett (2002), which found relatively higher C in urban soils in drier and/or warmer climates. Similarly, the lack of correlation between age of development and soil C contrasts with the re- sults of those studies. We hypothesize that in wetter environ- ments, such as the one in our study, development stimulates a pulse of decomposition that tapers off as the new land use is in place. In contrast , poor arid soils accumulate C over time as wa- ter and nutrients are continually provided. These results support the review by Pataki et al. (2006) and Pouyat et al. (2009), both of which suggest that affect of development on soil C varies by ecosystem. Given the low biomass on house lots, the vast ma- jority (>90%) of C in house lots is stored in soils (Figure 2). Similar C distributions have been observed in other urban areas (Jo & McPherson, 1995). Assumptions While understanding the C footprint of development is critical for planning how best to reduce emissions, there is considerable uncertainty in determining losses that bear closer examination here. Perhaps most importantly, we assume that soil C losses from the site result in C emissions to the atmosphere in the form of CO2 or that C originally in forest soils was decomposed and respired upon conversion to house lots. However, some fraction of house lot soil C that we measure as missing may actually have been transported off of the site via erosion of topsoil. The fate of such C i s unclear, and likely depends on processing in river s and estuaries (Berhe et al., 2007). This may lead us to overestimate emissions from soil C. We also assume that bulk density was the same from 25 cm to 75 cm as it was from 0 cm - 25 cm at each site, which propa- gates the higher bulk density in house lots to depth. If compac- tion did not affect the lower house lot horizons, and bulk den- sity in the lower soil is similar between pairs of sites, we will overestimate the amount of C in house lots by ~10%. In addition, the fate of AGB removed from the house lot greatly influences the magnitude of C lost. There is a dearth of data on the fate of C in harvested wood products, particularly on how long wood products used in const ruction take to decompose, and how that varies with wood type, specific use, and region. In ad- dition, the time scale of these losses is poorly constrained. We took 90 y ears of losses as our ben chmark, based on the available literature and the age of the homes in our study area. However, if these losses occur more rapidly, or if losses decrease expo- nentially with time, we may be considerably underestimating losses from house lot clearing. Lost Carbon Seq ue stration Pote nt ial Many of the forestlands into which Seattle is expanding were last logged in the late 1800s and early 1900s, meaning that most of these stands are currently around 100 years old (Robbins, 1985). S ta n ds of No rt h we st e ve rg re e n s, su c h a s Douglas-fir and Western Hemlock, take up to 250 years to mature after being logged, and some conifers can live up to 700 years (Spies & Franklin, 1996). Smithwick et al. (2002) found that on average an additional 338 Mg·C·ha–1 would be stored in the biomass and soils of coastal Washington and Oregon forests if second growth stands were allowed to return to their maximum C hold- ing capacity, and that the upper bound C potential for just the biomass of these old growth forest is 380 Mg·C·ha–1. For C losses, and loss rates, we have used a range of between 140 Mg·C·ha–1 and 290 Mg·C·ha–1 to estimate preclearing bio- mass (Adams et al., 2005; Binkley et al., 1992; Hutrya et al., 2011). However, the development of housing on regrowing fo- restland also represents a lost C uptake in the future. Assuming that the forests reach their full C holding potential after an addi- tional 150 years (given an average stand age of ~100 years; Smithwick et al., 2002; Franklin et al., 1986), the lost seques- tration potential (LSP) is the difference between the biomass at the time of removal and the assumed biomass of a fully grown forest. Lost sequestration potential at our sites ranges from 92 - 245 Mg·C·ha–1 developed, or .6 - 1.6 Mg·C·ha–1·yr–1 for the next 150 years. From the perspective of King County’s emissions, this LSP represents a C sink that is lost by development that otherwise would have helped King County to reach its net C emissions reduction goals. Instead of this forested land acting as a C sink as the forest matures, when it is developed it acts as a C source as the biomass and soil C is emitted. Carbon Emissions in Context Although there are considerable uncertainties in the estimate, the C loss due to development is substantial, even when LSP or fossil fuel intensive inputs such as fertilizer and pesticides are le ft out of the equation. Assumin g lower bound fo rest C and loss ra tes, 120 ± 31 Mg·C· ha–1 is li berated from soils and AGB within 90 years of conversion, while upper bound estimates suggest a 300 ± 31 Mg·C·ha–1 loss (Figure 2). This loss is comparable to other major C costs of suburban development (Figure 3). For example, for every house that is built on a forest lot rather than 4 Copyright © 2012 SciRes. 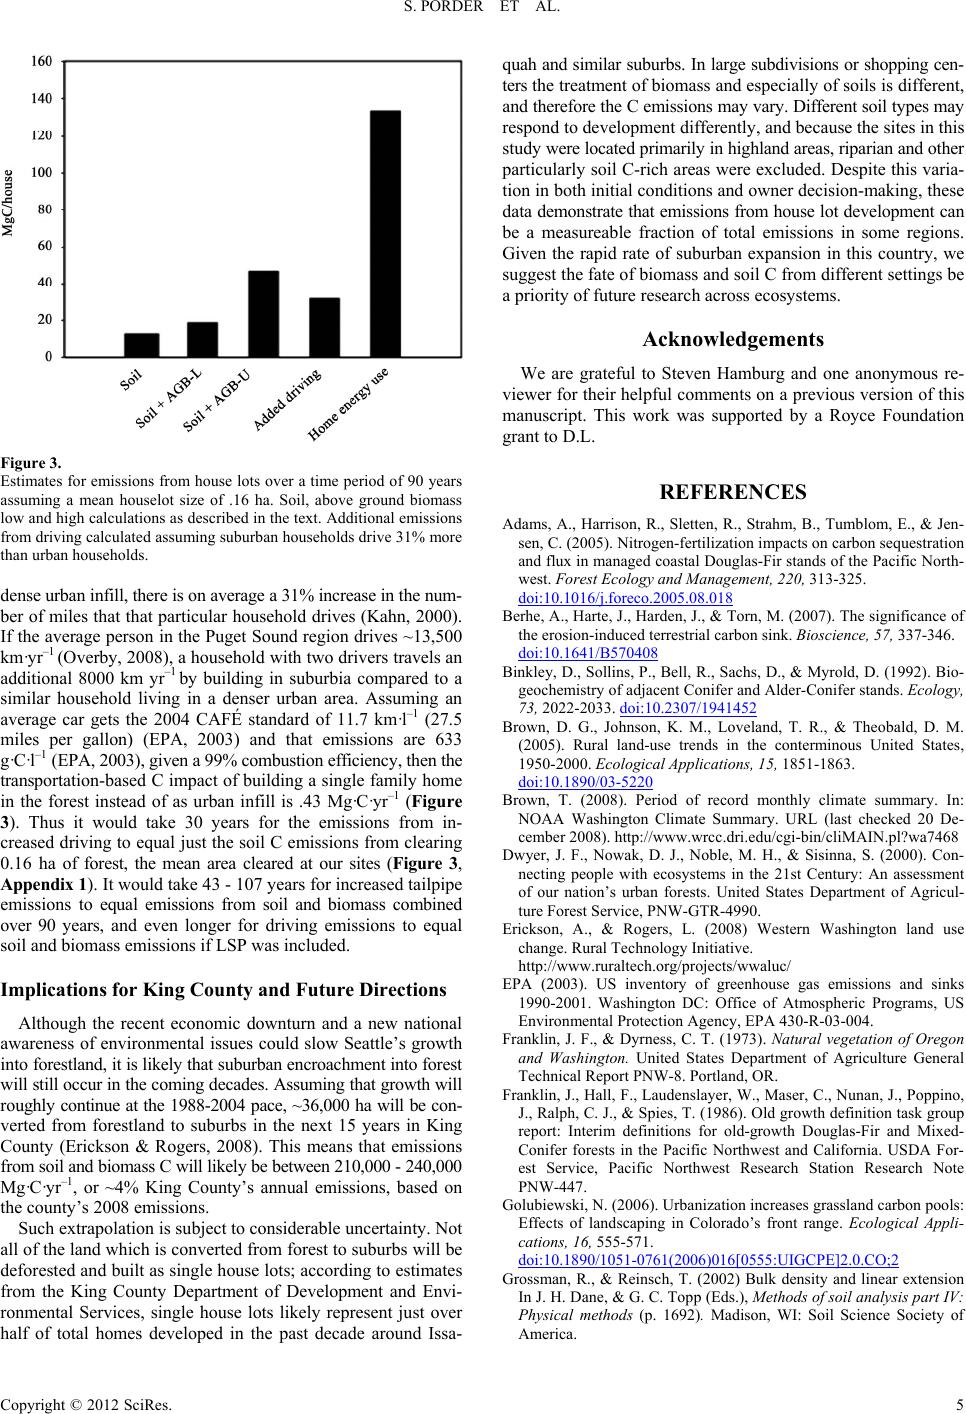 S. PORDER ET AL. Figure 3. Estimates for emissions from house lots over a time period of 90 years assuming a mean houselot size of .16 ha. Soil, above ground biomass low and high calculations as described in the text. Additional emissions from driving calculated assuming suburban households drive 31% more than urban households. dense urban infill, there is on average a 31% increase in the num- ber of miles that that particular household drives (Kahn, 2000). If the average person in the Puget Sound region drives ~13,500 km·yr–1 (Overby, 2008), a household with two drivers travels an additional 8000 km yr–1 by building in suburbia compared to a similar household living in a denser urban area. Assuming an average car gets the 2004 CAFÉ standard of 11.7 km·l–1 (27.5 miles per gallon) (EPA, 2003) and that emissions are 633 g·C·l–1 (EPA, 2003), given a 99% combustion efficiency, then the transportation-based C impact of building a single family home in the forest instead of as urban infill is .43 Mg·C·yr–1 (Figure 3). Thus it would take 30 years for the emissions from in- creased driving to equal just the soil C emissions from clearing 0.16 ha of forest, the mean area cleared at our sites (Figure 3, Appendix 1 ). It would take 43 - 107 years for increased tailpipe emissions to equal emissions from soil and biomass combined over 90 years, and even longer for driving emissions to equal soil and biomass emissions if LSP was incl uded. Implications for King County and Future Directions Although the recent economic downturn and a new national awareness of environmental issues could slow Seattle’s growth into forestlan d, it is likely that suburban encroac hment into fore st will still occur in the coming decades. Assuming that growth will ro ughly continue at the 1988- 2004 pace, ~36,000 ha will be con- verted from forestland to suburbs in the next 15 years in King County (Erickson & Rogers, 2008). This means that emissions from soil and biomass C will likely be between 210,000 - 240,000 Mg·C·yr–1 , or ~4% King County’s annual emissions, based on the county’s 2008 emissions. Such extrapolation is subject to considerable uncertainty. Not all of the land which is converted from forest to suburbs will be deforested and built as single house lots; according to estimates from the King County Department of Development and Envi- ronmental Services, single house lots likely represent just over half of total homes developed in the past decade around Issa- quah and similar suburb s. In large subdivisions or shopping cen - ters the treatment of biomass and especially of soils is different, and therefore the C emissions may vary . Different soil types may respond to development differently, and because the sites in this study were located primarily in highland area s, riparian and ot her particularly soil C-rich areas were excluded. Despite this varia- tion in both initial conditions and owner decision-making, these data demonstrate that emissions from house lot development can be a measureable fraction of total emissions in some regions. Given the rapid rate of suburban expansion in this country, we suggest the fate of biomass and soil C from different settings be a priority of future research across ecosystems. Acknowledgements We are grateful to Steven Hamburg and one anonymous re- viewer for their helpful comments on a previous version of this manuscript. This work was supported by a Royce Foundation grant to D.L. REFERENCES Adams, A., Harriso n, R., Sletten, R., Strahm, B., Tumblo m, E., & Jen- sen, C. (2005). Nitrogen-fertilization impacts on carbon sequestration and flux in managed coastal Douglas-Fir stands of the Pacific North- west. Forest Ecology and Management, 220, 313-325. doi:10.1016/j.foreco.2005.08.018 Berhe, A., Harte, J., Harden, J., & Torn, M. (2007). The significance of the erosion-induced terrestrial carbon sink. Bioscience, 57, 337-346. doi:10.1641/B570408 Binkley, D., Sollins, P., Bell, R., Sachs, D., & Myrold, D. (1992). Bio- geochemistry of adjacent Conifer and Alder-Conifer stands. Ecology, 73, 2022-2033. doi:10.2307/1941452 Brown, D. G., Johnson, K. M., Loveland, T. R., & Theobald, D. M. (2005). Rural land-use trends in the conterminous United States, 1950-2000. Ecological Applications, 15, 1851-1863. doi:10.1890/03-5220 Brown, T. (2008). Period of record monthly climate summary. In: NOAA Washington Climate Summary. URL (last checked 20 De- cember 2008). http://www.wrcc.dri.edu/cgi-bin/cliMAIN.pl?wa7468 Dwyer, J. F., Nowak, D. J., Noble, M. H., & Sisinna, S. (2000). Con- necting people with ecosystems in the 21st Century: An assessment of our nation’s urban forests. United States Department of Agricul- ture Forest Service, PNW-GTR-4990. Erickson, A., & Rogers, L. (2008) Western Washington land use change. Rural Technology Initiative. http://www.ruraltech.org/projects/wwaluc/ EPA (2003). US inventory of greenhouse gas emissions and sinks 1990-2001. Washington DC: Office of Atmospheric Programs, US Environmental Protection Agency, EPA 430-R-03-004. Franklin, J. F., & Dyrness, C. T. (1973). Natural vegetation of Oregon and Washington. United States Department of Agriculture General Technical Report PNW-8. Portland, OR. Franklin, J., Hall, F., Laudenslayer, W., Maser, C., Nunan, J., Poppino, J., Ralph, C. J., & Spies, T. (1986). Old growth definition task group report: Interim definitions for old-growth Douglas-Fir and Mixed- Conifer forests in the Pacific Northwest and California. USDA For- est Service, Pacific Northwest Research Station Research Note PNW-447. Golubiewski, N. (2006). Urbanization increases grassland carbon pools: Effects of landscaping in Colorado’s front range. Ecological Appli- cations, 16, 555-571. doi:10.1890/1051-0761(2006)016[0555:UIGCPE]2.0.CO;2 Grossman, R., & Reinsch, T. (2002) Bulk density and linear extension In J. H. Dane, & G. C. Topp (Eds.), Methods of soil analysis part IV: Physical methods (p. 1692). Madison, WI: Soil Science Society of America. Copyright © 2012 SciRes. 5  S. PORDER ET AL. 6 Copyright © 2012 SciRes. Harmon, M., Harmon, J., Ferrell, W., & Brooks, D. (1996). Modeling carbon stores in Oregon and Washington forest products: 1900-1992. Climatic Change, 33. Harrison, R., et al. (2009). Biomass and stand characteristics of highly productive mixed Douglas Fir and Western Hemlock Plantation in Coastal Washington. Western Journal of Applied Forestry, 24, 180-286. doi:10.1146/annurev.earth.35.031306.140057 Heath, L., Birdsey, R., Clark, R., & Plantinga, J. (1996) Carbon pools and flux in US forest products. Forest ecosystems, forest manage- ment and global carbon cycle (pp. 271-278). New York: Springer- Verlag. Houghton, R. (2007). Balancing the global carbon budget. Annual Review of Earth and Planetary Sciences, 35, 313-347. Hutyra, L. R., Yoon, B., & Albert, M. (2011). Terrestrial carbon stocks across a gradient of urbanization: A study of the Seattle, WA region. Global Change Biology, 17, 783-797. doi:10.1111/j.1365-2486.2010.02238.x IPCC (2007). Climate Change 2007: The physical science basis. Con- tribution of Working Group I to the Fourth Assessment Report of the Intergovernmental Panel on Climate Change. Cambridge: Cam- bridge University Press. Jenkins, J., Chojnacky, D., Heath, L., & Birdsey, R. (2004). Compre- hensive database of diameter-based biomass regressions for North American tree species. United States Department of Agriculture General Technical Report NE-319. Jo, H., & McPherson, E. (1995). Carbon storage and flux in urban residential green space. Journal of Environmental Management, 45, 109-133. doi:10.1006/jema.1995.0062 Kahn, M. (2000). The environmental impact of suburbanization. Jour- nal of Policy Analysis and Management, 17, 569-586. doi:10.1002/1520-6688(200023)19:4<569::AID-PAM3>3.0.CO;2-P Kaye, J. P., McCulley, R. L., & Burke, I. C. (2005). Carbon fluxes, nitrogen cycling, and soil microbial communities in adjacent urban, native and agricultural ecosystems. Global Change Biology, 11, 575-587. doi:10.1111/j.1365-2486.2005.00921.x Kaye, J. P., Groffman, P., Grimm, N. B., Baker, L., & Pouyat, R. (2006). A distinct urban biogeochemistry? Trends in Ecology and Evolution, 21, 192-199. doi:10.1016/j.tree.2005.12.006 MacLean, C., & Bolsinger, C. L. (1997). Urban expansion in the for- ests of the Puget Sound Region. Resource Bulletin PNW-RB-225. Portland: USDA Forest Service. McHale, M., Burke, I., Lefsky, M., Peper, P., & McPherson, E. (2009). Urban forest biomass estimates: Is it important to use allometric rela- tionships developed specifically for urban trees? Urban Ecosystems, 12, 95-113. doi:10.1007/s11252-009-0081-3 Nowak, D. J. (1994). Atmospheric carbon dioxide reduction by Chi- cago’s urban forest. In: E. G. McPherson, D. J. Nowak, & R. A. Rowntree (Eds.), Chicago’s urban forest ecosystem: Results of the Chicago Urban Forest Climate Project. General Technical Report NE-186. US Department of Agriculture, Forest Service: 83-94. Oleson, J., Hope, D., Gries, C., & Kaye, J. P. (2006). A Baysian ap- proach to estimating regression coefficients for soil properties in land-use patches with varying degrees of spatial variation. Environ- metrics, 17, 517-525. doi:10.1002/env.789 Overby, K. (2008). Puget sound trends: Trends in vehicle mi l es traveled. URL (last checked 31 January 2009). www.psrc.org/publications/pubs/trends/t2sep08.pdf. Perez-Garcia, J., Lippke, B., Comnick, J., & Manriquez, C. (2006). An assesment of carbon pools, storage and wood products market sub- stitution using life-cycle analysis results. Wood Fiber Science, 37, 140-148. Pacala, S., et al. (2001). Consistent land- and atmosphere-based US carbon sink estimates. Science, 292, 2316-2320. doi:10.1126/science.1057320 Pataki, D., Alig, R., Fung, A., Goliubski, E., Kennedy, C., McPherson, E., Nowak, K., Pouyat, R., & Pomero Lankao, P. (2006). Urban eco- systems and the North American carbon cycle. Global Change Biol- ogy, 12, 2092-2102. doi:10.1111/j.1365-2486.2006.01242.x Pouyat, R., Groffman, P., Yesilonis, I., & Hernandez, L. (2002). Soil carbon pools and fluxes in urban ecosystems. Environmental Pollu- tion, 116, 107-1 18. doi:10.1016/S0269-7491(01)00263-9 Pouyat, R., Yesilonis, I., & Nowak, D. (2006). Carbon storage by urban soils in the United States. Journal of Environmental Quality, 35, 1566-1575. doi:10.2134/jeq2005.0215 Pouyat, R., Yesilonis, I., & Golubiewski, N. (2009). A comparison of soil organic carbon stocks between residential turf grass and native soil. Urban Ecosystems, 12, 45-62. doi:10.1007/s11252-008-0059-6 Puget Sound Regional Council (2008). Vision 2040. In: Puget Sound Regional Council Documents. URL (last checked 18 September 2008). http://psrc.org/projects/vision/pubs/vision2040/index.htm Qian, Y., & Follet, R. F. (2002). Assessing soil carbon sequestration in turfgrass systems using long-term soil testing data. Agronomy, 94, 930-935. doi:10.2134/agronj2002.0930 Robbins, W. (1985). The social context of forestry: The Pacific North- west in the 20th Century. The Western History Quarterly, 16, 413-427. doi:10.2307/968606 Schimel, D. S., House, J. I., Hibbard, K. A., Bousquet, P., Ciais, P., Peylin, P., Braswell, B. H., Apps, M. J., Baker, D., Bondeau, A., Canadell, J., Churkina, G., Cramer, W., Denning, A. S., Field, C. B., Friedlingstein, P., Goodale, C., Heimann, M., Houghton, R. A., Melillo, J. M., Moore III, B., Murdiyarso, D., Noble, I., Pacala, S. W., Prentice, I. C., Raupach, M. R., Rayner, P. J., Scholes, R. J., Steffen, W. K., & Wirth, C. (2001). Recent patterns and mechanisms of car- bon exchange by terre st ri al ec osys te ms. Nature, 414, 169-172. doi:10.1038/35102500 Schlesinger, W. (1997). Biogeochemistry: An analysis of global change (2nd ed.). San Diego, CA: Academic Press. Smithwick, E., Harmon, M., Remillard, S., Acker, S., & Franklin, J. (2002) Potential upper bounds of carbon stores in forests of the Pa- cific Northwest. Journal of Appli ed Ecology, 12, 1303-1317. doi:10.1890/1051-0761(2002)012[1303:PUBOCS]2.0.CO;2 Soil Survey Staff (2008). Soil survey of King County, Washington. In: Natural Resources Conservation Service, United States Department of Agriculture Soil Sur vey. URL (last checked 10 December 2008). http://soildatamart.nrcs.usda.gov/Survey.aspx?State=WA Spies, T. A., & Franklin, J. F. (1996). The diversity and maintenance of old-growth forests. In R. C. Szaro, & D. W. Johnson (Eds.), Biodi- versity in managed landscapes: Theory and practice (pp. 296-314). Oxford, New York. Vincent, K., & Chadwick, O. (1994). Synthesizing bulk density for soils with abundant rock fragments. Soil Science Society of America Journal, 58, 455-4 64. doi:10.2136/sssaj1994.03615995005800020030x Wienert, A. (2006). From forestland to house lot: Carbon stock changes and greenhouse gas emissions from exurban land develop- ment in central New Hampshire. Masters Thesis, Providence: Brown University.  S. PORDER ET AL. Appendix 1. Soil Carbon, Bulk Density, Above Ground Biomass (AGB) and Selected Site Attribute Measurements. HOUSE Site Distance from house m BD g·cm–3 wt%·C 0 - 25 cm wt%·C 25 - 75 cmLawn Soil C 0 - 7 5 cm Mg·ha–1 Cleared Area ha*House Area ha Total Soil C Mg·ha–1 AGB-C Mg·ha–1 1 1 1.0 1.4 1.2 100 1 5 .88 3.3 1.7 150 1 10 .70 2.7 1.0 83 Site 1 mean .87 2.5 1.3 110 .053 .028 83 6 2 1 1.4 1.9 .79 120 2 5 1.1 .87 .74 63 2 10 1.1 4.2 1.4 180 Site 2 mean 1.7 2.3 1.0 190 .082 .013 170 20 3 1 1.0 2.1 2.6 190 3 5 1.2 2.9 3 10 .71 1.7 1.4 78 Site 3 mean 1.5 2.2 2.0 230 .042 .025 150 .5 4 1 .90 3.0 2.8 190 4 5 .93 3.3 4 10 1.0 3.0 2.6 210 Site 4 mean 1.0 3.1 2.7 200 .20 .070 160 .09 5 1 1.0 2.7 .84 110 5 5 1.0 2.9 1.0 120 Site 5 mean 1.0 2.8 1.5 140 .061 .018 120 10 6 1 1.3 2.9 6 5 1.0 2.8 .34 86 6 10 .83 2.8 .37 73 Site 6 mean 1.0 2.8 .36 91 .021 .022 59 30 7 1 1.0 6.1 1.4 230 7 5 1.0 5.6 1.3 220 7 10 1.0 7.2 2.2 300 Site 7 mean 1.0 6.3 1.7 250 .018 .018 170 .3 8 1 .77 3.5 .63 92 8 5 1.4 4.6 8 10 .84 5.4 1.3 170 Site 8 mean 1.0 4.5 1.0 160 .035 .022 121 40 9 1 1.3 3.9 9 5 1.3 9 10 1.0 3.4 1.4 160 Site 9 mean 1.2 3.7 1.4 190 .20 .053 170 8** 10 1 1.0 5.0 3.1 290 10 5 1.3 5.4 10 10 .89 4.5 Site 10 mean 1.1 5.0 3.1 300 .070 .018 240 8** 11 1 .92 3.8 11 5 1.0 3.2 1.6 150 11 10 .95 5.6 6.4 440 Site 11 mean .95 4.2 4.0 290 .073 .021 240 5 12 1 .67 6.8 3.5 230 12 5 .58 7.6 2.1 170 12 10 .67 4.8 2.3 160 Site 12 mean .64 6.4 2.6 190 .021 .015 140 .1 13 1 .92 2.8 1.8 140 13 5 .80 4.5 Copyright © 2012 SciRes. 7  S. PORDER ET AL. Continued 13 10 1.0 4.4 Site 13 mean .90 3.9 1.8 170 .20 .019 150 .1 14 1 1.1 3.8 2.4 240 14 5 1.0 3.2 14 10 1.3 4.2 Site 14 mean 1.1 3.7 2.4 250 .10 .016 220 1 15 1 1.0 2.6 2.0 170 15 5 .93 3.0 3.3 230 15 10 .67 2.9 1.3 91 Site 15 mean .88 2.8 2.2 160 .037 .029 110 4 16 1 1.0 2.8 1.5 140 16 5 1.1 3.1 16 10 1.0 4.2 1.4 170 Site 16 mean 1.0 3.4 1.5 160 .34 .034 150 10 17 1 1.0 4.3 1.8 400 17 5 1.4 3.8 17 10 .87 4.0 1.0 130 Site 17 mean 1.1 4.1 1.4 190 .34 .030 180 1 18 1 1.0 3.6 .79 130 18 5 1.1 4.2 18 10 1.0 3.6 2.1 2.0*102 Site 18 mean 1.0 3.8 1.4 170 .48 .021 170 .8 MEAN 1.0 3.8 1.9 190 .13 .026 160 8 S.E. .050 .29 .20 13 .03 .003 11 3.0 *Cleared area values do not include the house footprint; they show total cleared area less the house footprint. Total cleared area = cleared area + house footprint. **No data-value a ssumed to be the mean of the dataset. FOREST Site Bulk density g·cm–3 wt% C 0 - 25 cm wt% C 25 - 75 cm Total Soil C Mg·ha–1 1 .63 3.8 2.5 140 2 .48 8.8 2.8 170 3 1.0 2.0 .86 98 4 .70 5.4 1.4 140 5 1.0 3.0 2.5 2.0*102 6 .46 5.3 3.5 140 7 .77 4.5 7.9 390 8 .67 11 3.0 290 9 .53 11 5.5 290 10 .39 12 2.5 160 11 .47 11 12.4 420 12 1.0 9.6 3.7 420 13 .93 5.1 2.3 230 14 1.1 1.5 .94 92 15 .86 5.6 2.6 230 16 1.1 3.7 3.8 320 17 .91 8.5 3.2 340 18 .91 5.0 2.7 240 MEAN .77 6.4 3.6 240 Standard Error .24 .78 .65 25 8 Copyright © 2012 SciRes.
|