 Open Journal of Marine Science, 2012, 2, 1-7 http://dx.doi.org/10.4236/ojms.2012.21001 Published Online January 2012 (http://www.SciRP.org/journal/ojms) Size Structure and Biomass of the Panama Grunt (Pomadasys panamensis) from Bycatch in the Southeastern Gulf of California José Alberto Rodríguez-Preciado1, Juan Madrid-Vera2, Ricardo Meraz-Sánchez1 1Posgrado en Ciencias del Mar y Limnología, Universidad Nacional Autónoma de México, Mazatlán, México 2Instituto Nacional de Pesca, Centro Regional de Investigación Pesquera (CRIP) Mazatlán, Mazatlán, México Email: {arodriguez, merazs}@ola.icmyl.una m.mx, juanchomvera@yahoo.com.mx Received July 29, 2011; revised October 22, 2011; accepted October 28, 2011 ABSTRACT A population analysis was made using data of the grunt Pomada sys panam en sis. The information is from the catch from 260 hauls in estuarin e waters, open-ocean waters, and off the coast of Sinaloa and nor thern Nayarit, Mexico, in the sou- theastern Gulf of California. The area of influence is about 120,000 km2 and includes about a third of the drag area of the largest shrimp fleet of the American Pacific. The average length in the population was 210 mm. The maximum length was 430 mm and the minimum was 50 mm. The analysis for the frequency distributions of the lengths and the multinomial solution produced representative modal groups for 160 mm, 190 mm, and 230 mm. The simulation of the biomass density gave an estimate close to 90 t, with 650,000 organisms before starting the fishing season in the region. The density was 0.19 kg·ha–1. The colonization was 0.42% or 42%. The model was validated using the Aikaikae crite- rion (AIC). The results provide an overview of the initial biomass densities and population structure of the species caught as bycatch, demonstrating the importance of this species abundance in the shrimp fishery, and generating a sou- rce of monetary income to the crew of the fishing fleet. The persistence of the species to fishing provides an example to study the mechanisms of survival. Keywords: Colonization; Multinomial Solution; Model; Pomadasys panamensis; Aikaikae 1. Introduction The species of the family Haemulidae are important as a part of the commercial catch from the fisheries of the Mexican Pacific and tropical and subtropical American Pacific. They are known as grunt [1-3]. In gen eral, the e- valuation of the catch contribution and their biomass has been studied. Using the magnitude the catch can reach as a relevant indicator makes it possible to estimate their abundance and population structure. These elements are resource management information. Moreover, it is funda- mental knowledge of a species subject to high impact by trawling and discarding, but which still maintains high levels of abundance. The bycatch under study is composed of about 300 spe- cies belonging to 10 major groups of organisms, such as annelids, sipunculids, porifera, crustaceans, mollusks, cni- darians, echinoderms, fish, algae, and reptiles. In the lite- rature, the total number of species may amount to 1000 [4-9]. The magnitude of the catch in the region of the mouth of the Gulf of California reaches 100,000 t, with the discard of 70% and a ratio of the landed species of 1.4 kg per 1 kg of shrimp [10,11]. The magnitude of ca- tch in the Gulf of California off the Pacific coast of Me- xico, and particularly the coasts of Sinaloa and Nayarit, is becoming more economically important, reflected in th e landings of the order of 10,000 t per seaso n [11], where P. panamensis is up to 5%, and the Haemulidae family about 10%. The shrimp fishery catches fish with commercial im- portance (with a higher monetary value), including rays, sting rays, sardine, anchovy, snapper, grouper, and floun- der (Rajidae, Engraulidae, Clupeidae, Serranidae, Lutja- nidae, and Pleuronectidae) and species of commercial gra- de (lesser value), like sunfish and grunts of the Scianidae and Haemulidae family. Some are discarded and others are kept. The species of this study belong to the second family, which is best represented in terms of abundance along the Mexican Pacific coast [9,12]. Pomadasys panamensis lives in the coastal zone, regula- rly associated with sandy-muddy and rocky bottoms. They live in the area of the contin ental shelf, in estuarine areas, at depths of up to 55 m but can reach 105 m [1,13]. The ba- ckground characteristics of the environment that prevails in the study area are a favorable habitat for this species. C opyright © 2012 SciRes. OJMS 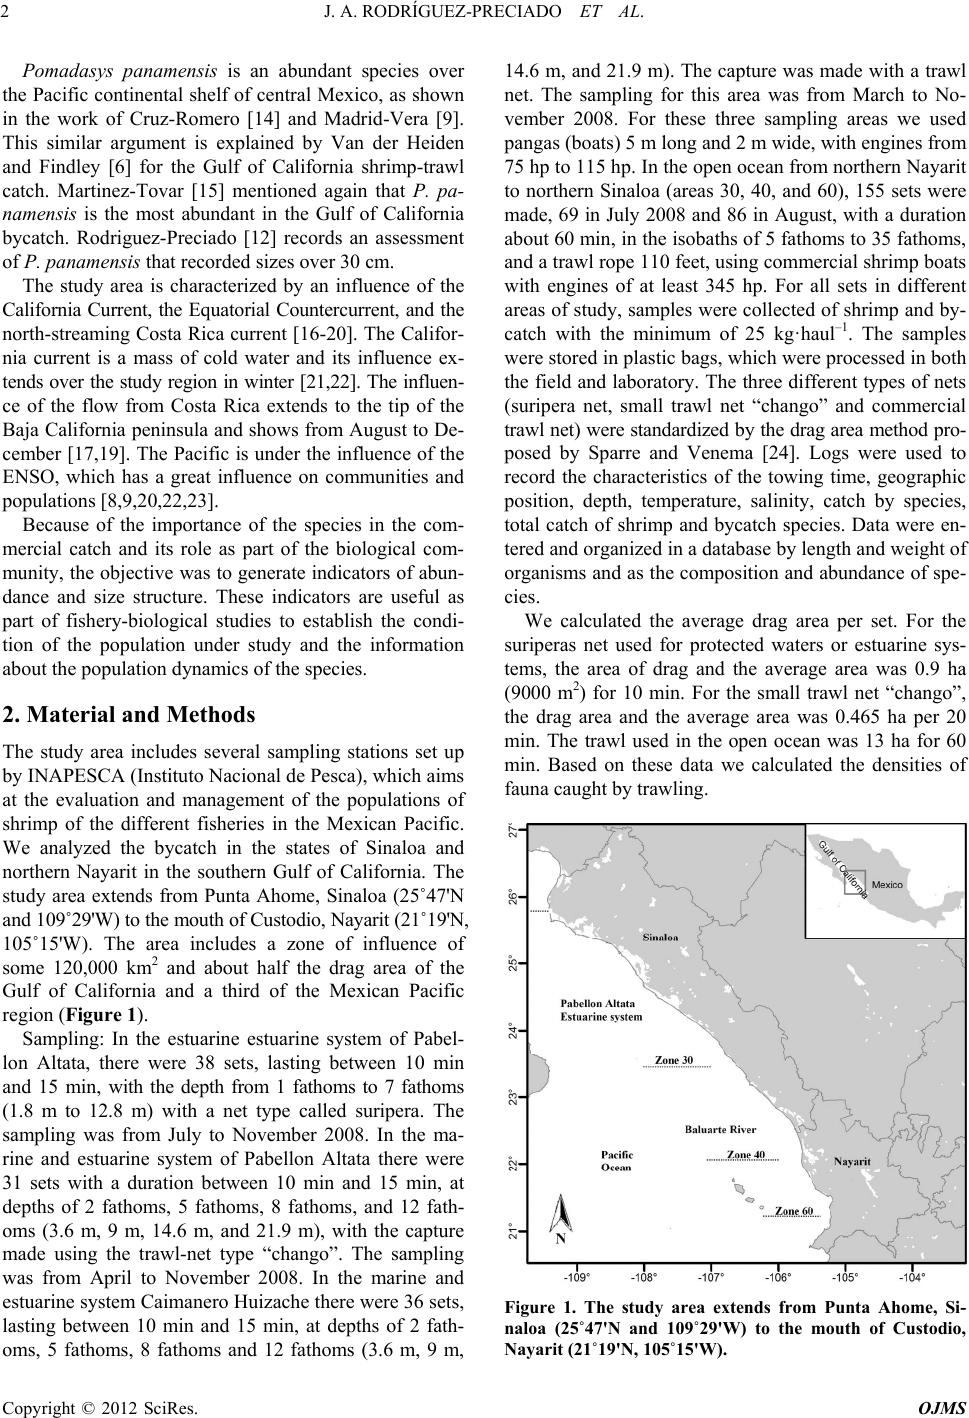 J. A. RODRÍGUEZ-PRECIADO ET AL. 2 Pomadasys panamensis is an abundant species over the Pacific continental shelf of central Mexico, as shown in the work of Cruz-Romero [14] and Madrid-Vera [9]. This similar argument is explained by Van der Heiden and Findley [6] for the Gulf of California shrimp-trawl catch. Martinez-Tovar [15] mentioned again that P. pa- namensis is the most abundant in the Gulf of California bycatch. Rodriguez-Preciado [12] records an assessment of P. panamensis that recorded sizes over 30 cm. The study area is characterized by an influence of the California Current, the Equatorial Countercurrent, and the north-streaming Costa Rica current [16-20]. The Califor- nia current is a mass of cold water and its influence ex- tends over the study region in winter [21,22]. The influen- ce of the flow from Costa Rica extends to the tip of the Baja California peninsula and shows from August to De- cember [17,19]. The Pacific is under the influence of the ENSO, which has a great influence on communities and populations [8,9 ,20,22,23]. Because of the importance of the species in the com- mercial catch and its role as part of the biological com- munity, the objective was to generate indicators of abun- dance and size structure. These indicators are useful as part of fishery-biological studies to establish the condi- tion of the population under study and the information about the populatio n dynamics of the species. 2. Material and Methods The study area includes several sampling stations set up by INAPESCA (Instituto Nacional de Pesca), which aims at the evaluation and management of the populations of shrimp of the different fisheries in the Mexican Pacific. We analyzed the bycatch in the states of Sinaloa and northern Nayarit in the southern Gulf of California. The study area extends from Punta Ahome, Sinaloa (25˚47'N and 109˚29'W) to the mouth of Custodio, Nayarit (21˚19'N, 105˚15'W). The area includes a zone of influence of some 120,000 km2 and about half the drag area of the Gulf of California and a third of the Mexican Pacific region (Figure 1). Sampling: In the estuarine estuarine system of Pabel- lon Altata, there were 38 sets, lasting between 10 min and 15 min, with the depth from 1 fathoms to 7 fathoms (1.8 m to 12.8 m) with a net type called suripera. The sampling was from July to November 2008. In the ma- rine and estuarine system of Pabellon Altata there were 31 sets with a duration between 10 min and 15 min, at depths of 2 fathoms, 5 fathoms, 8 fathoms, and 12 fath- oms (3.6 m, 9 m, 14.6 m, and 21.9 m), with the capture made using the trawl-net type “chango”. The sampling was from April to November 2008. In the marine and estuarine system Caimanero Huizache there were 36 sets, lasting between 10 min and 15 min, at depths of 2 fath- oms, 5 fathoms, 8 fathoms and 12 fathoms (3.6 m, 9 m, 14.6 m, and 21.9 m). The capture was made with a trawl net. The sampling for this area was from March to No- vember 2008. For these three sampling areas we used pangas (boats) 5 m long and 2 m wide, with engines from 75 hp to 115 hp. In the open ocean from northern Nayarit to northern Sinaloa (areas 30, 40, and 60), 155 sets were made, 69 in July 2008 and 86 in August, with a duration about 60 min, in the isobath s of 5 fathoms to 35 fathoms, and a trawl rope 110 feet, using commercial shrimp boats with engines of at least 345 hp. For all sets in different areas of study, samples were collected of shrimp and by- catch with the minimum of 25 kg·haul–1. The samples were stored in plastic bags, which were processed in both the field and laboratory. The three different types of nets (suripera net, small trawl net “chango” and commercial trawl net) were standardized by the drag area method pro- posed by Sparre and Venema [24]. Logs were used to record the characteristics of the towing time, geographic position, depth, temperature, salinity, catch by species, total catch of shrimp and bycatch species. Data were en- tered and organized in a database by length and weight of organisms and as the composition and abundance of spe- cies. We calculated the average drag area per set. For the suriperas net used for protected waters or estuarine sys- tems, the area of drag and the average area was 0.9 ha (9000 m2) for 10 min. For the small trawl net “chango”, the drag area and the average area was 0.465 ha per 20 min. The trawl used in the open ocean was 13 ha for 60 min. Based on these data we calculated the densities of fauna caught by traw ling. Figure 1. The study area extends from Punta Ahome, Si- naloa (25˚47'N and 109˚29'W) to the mouth of Custodio, Nayarit (21˚19'N, 105˚15'W). Copyright © 2012 SciRes. OJMS 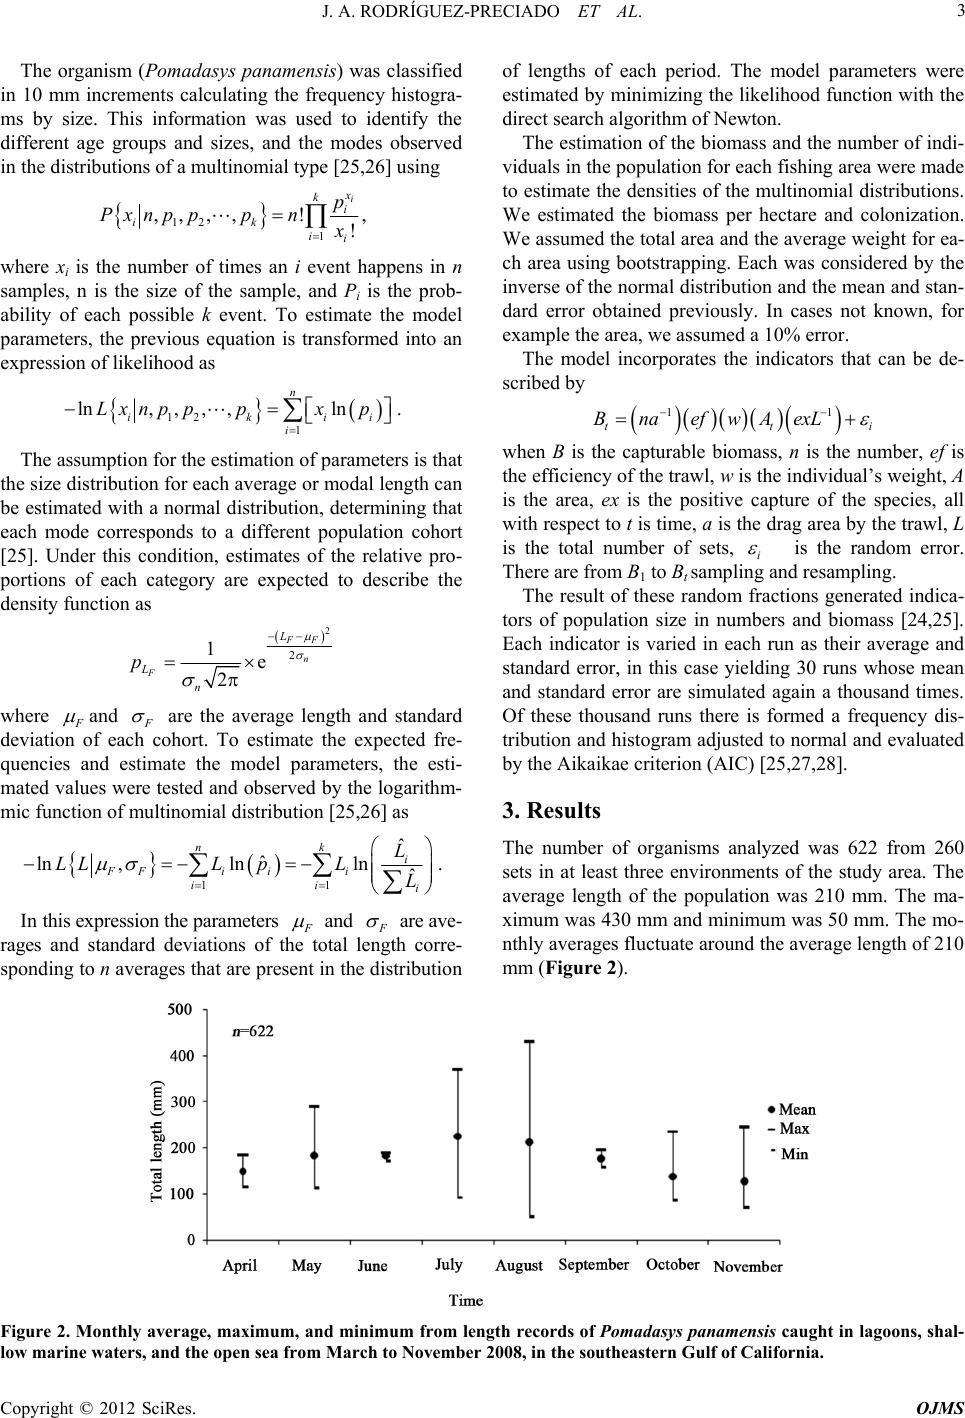 J. A. RODRÍGUEZ-PRECIADO ET AL. Copyright © 2012 SciRes. OJMS 3 The organism (Pomadasys panamensis) was classified in 10 mm increments calculating the frequency histogra- ms by size. This information was used to identify the different age groups and sizes, and the modes observed in the distributions of a multinomial type [25,26] using of lengths of each period. The model parameters were estimated by minimizin g the likelihood function with the direct search algorithm of Newton. The estimation of the biomass and the number of indi- viduals in the population for each fishing area were made to estimate the densities of the multinomial distributions. We estimated the biomass per hectare and colonization. We ass umed th e tota l area an d the aver age we ight fo r ea- ch area using bootstrapping. Each was considered by the inverse of the normal distribution and the mean and stan- dard error obtained previously. In cases not known, for example the area, we assumed a 10% error. 12 1 ,,,,! ! i ki ik ii p Pxnp ppn , where xi is the number of times an i event happens in n samples, n is the size of the sample, and Pi is the prob- ability of each possible k event. To estimate the model parameters, the previous equation is transformed into an expression of likelihood as The model incorporates the indicators that can be de- scribed by 12 1 ln, ,, ,ln n iki i Lxnp ppxp 11 tt BnaefwAexL i . i when B is the capturable biomass, n is the number, ef is the efficiency of the trawl, w is the individual’s weight, A is the area, ex is the positive capture of the species, all with respect to t is time, a is the drag area by the trawl, L is the total number of sets, i is the random error. There are from B1 to Bt sampling and resampling. The assumption for the estimation of parameters is that the size distribution for each average or modal length can be estimated with a normal distribution, determining that each mode corresponds to a different population cohort [25]. Under this condition, estimates of the relative pro- portions of each category are expected to describe the density function as The result of these random fractions generated indica- tors of population size in numbers and biomass [24,25]. Each indicator is varied in each run as their average and standard error, in this case yielding 30 runs whose mean and standard error are simulated again a thousand times. Of these thousand runs there is formed a frequency dis- tribution and histogram adjusted to normal and evaluated by the Aikaikae criterion (AIC) [25,27,28]. 2 2 1e 2 FF n F L L n p where and are the average length and standard deviation of each cohort. To estimate the expected fre- quencies and estimate the model parameters, the esti- mated values were tested and observed by th e logarithm- mic function of multinomial distribution [25,26] as 3. Results 11 ˆ ˆ ln,lnln ˆ nk i FFi ii ii i L LLL pLL . The number of organisms analyzed was 622 from 260 sets in at least three environments of the study area. The average length of the population was 210 mm. The ma- ximu m w as 43 0 mm a nd mini mum w as 50 mm. Th e mo- nthly aver ages fluctu ate around th e aver age len gth of 210 mm (Figure 2). In this expression the parameters and are ave- rages and standard deviations of the total length corre- sponding to n averages that are present in the distribution Figure 2. Monthly average, maximum, and minimum from length records of Pomadasys panamensis caught in lagoons, shal- low marine waters, and the open sea from March to November 2008, in the southeastern Gulf of California. 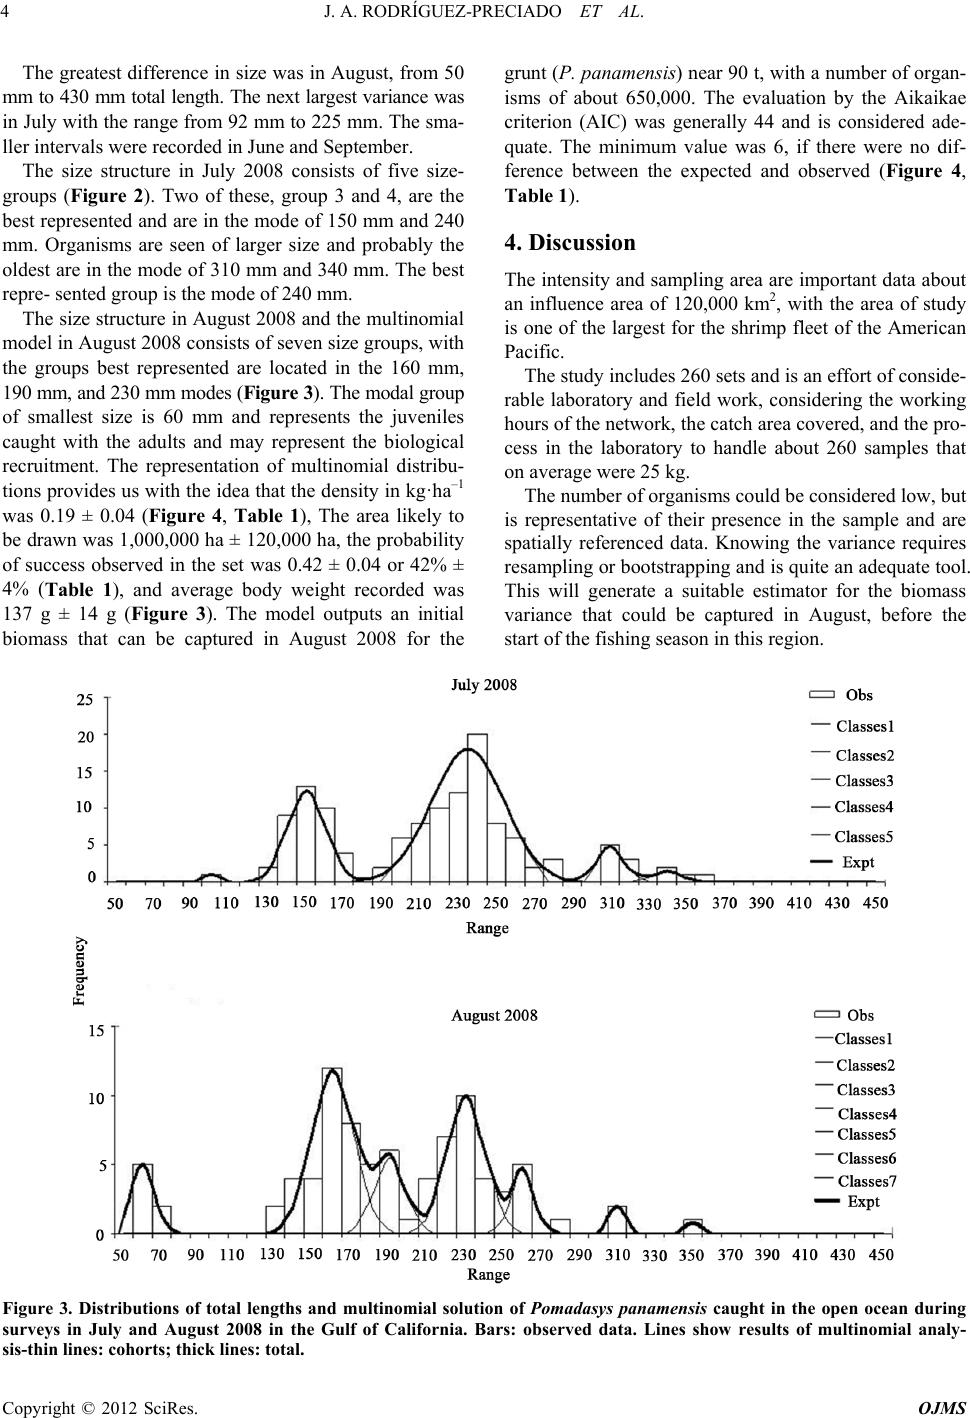 J. A. RODRÍGUEZ-PRECIADO ET AL. 4 The greatest difference in size was in August, fro m 50 mm to 430 mm total length. The next largest variance was in July with the range from 92 mm to 225 mm. The sma- ller intervals were recorded in June and September. The size structure in July 2008 consists of five size- groups (Figure 2). Two of these, group 3 and 4, are the best represen ted and are in the mode of 150 mm and 240 mm. Organisms are seen of larger size and probably the oldest are in the mode of 310 mm and 340 mm. The best repre- sented group is the mode of 240 mm. The size structure in August 2008 and the multin omial model in August 2008 consists of seven size groups, with the groups best represented are located in the 160 mm, 190 mm, and 230 mm modes (Figure 3). The modal group of smallest size is 60 mm and represents the juveniles caught with the adults and may represent the biological recruitment. The representation of multinomial distribu- tions provides us with the id ea that the density in kg·ha–1 was 0.19 ± 0.04 (Figure 4, Table 1), The area likely to be drawn was 1,000,000 ha ± 120,000 ha , the probability of success observed in the set was 0.42 ± 0.04 or 42% ± 4% (Table 1), and average body weight recorded was 137 g ± 14 g (Figure 3). The model outputs an initial biomass that can be captured in August 2008 for the grunt (P. panamensis) near 90 t, with a number of organ- isms of about 650,000. The evaluation by the Aikaikae criterion (AIC) was generally 44 and is considered ade- quate. The minimum value was 6, if there were no dif- ference between the expected and observed (Figure 4, Table 1). 4. Discussion The intensity and sampling area are impor tant data about an influence area of 120,000 km2, with the area of study is one of the largest for the shrimp fleet of the American Pacific. The study includes 260 sets and is an effort of conside- rable laboratory and field work, considering the working hours of the network, the catch area covered, and the pro- cess in the laboratory to handle about 260 samples that on average were 25 kg. The number of organisms could be considered low, but is representative of their presence in the sample and are spatially referenced data. Knowing the variance requires resampling or bootstrapping and is quite an adequate tool. This will generate a suitable estimator for the biomass variance that could be captured in August, before the start of the fishing season in this region. Figure 3. Distributions of total lengths and multinomial solution of Pomadasys panamensis caught in the open ocean during surveys in July and August 2008 in the Gulf of California. Bars: observed data. Lines show results of multinomial analy- sis-thin lines: cohorts; thick lines: total. Copyright © 2012 SciRes. OJMS  J. A. RODRÍGUEZ-PRECIADO ET AL. 5 Figure 4. Parameter distributions for 1000 random runs of the biomass, colonization, the area, and the individual weights, and the indicators produced from biomass and number of Pomadasys panamensis in August 2008. The normal setting is scaled and evaluated by the Aikaikae c riterion (AIC). Table 1. Output values of the model, containing the distri- butions for 1000 random runs of the biomass, colonization, the area, and the individual weights and indicators produ- ced from biomass and number of Pomadasys panamensis in August 2008. The normal setting is scaled and evaluated by the Aikaikae criterion (AIC), standard deviation (SD). Parameter Mean SD (Standard Deviation)AIC Density (kg·ha–1) 0.19 0.04 34 Colonization 0.42 0.04 45 Area (ha) 1,140,200 121,100 32 Biomass (t) 90 25 30 Number 654,500 31,100 29 Weight (g) 137 14.7 29 The port cities, such as Mazatlan (in the center of the study area), had landing levels of fauna reaching 10,000 t. Much of the fauna captured is used by fishermen, consti- tuting a significant fraction of the generated income of the region. A simple fraction of 150 kg per fisherman, per 500 boats with 6 crews produced nearly 500 t. This may seem a simple exercise, but it represents 500,000 servings of fish of various species. A fraction of 5% could be represented by the species studied. However, about 100,000 t are discarded and are not exploited. A simple example of businesses to process this additional fraction, two additional sailors per boat generated one thousand jobs in the port of Mazatlan and has increased their landings, quality, smell, and price. Among the spe- cies needed to be rescued are at least 51 fish including the grunt (includes Pomadasys panamensis), croaker, sea bass, yellowfin snook, jacks, rays, and 4 species of crus- taceans such as crabs and crayfish. An example of the use of the bycatch is in the study by Castelo-Báez and Balsinde-Ruano [29] along the coast of Costa Rica. Of the sets made they collected 278 kg of b ycatch, of which 80% was discarded. The most representative families in the catch were Carangidae, Scianidae, Ophicthidae, Para- lichthyidae, Soleidae, Lutjanidae, Haemulidae, and Clu- peidae. They had as a first step the classification of spe- cies according to the organoleptic attributes (physical, chemical, sensory) and, depending on the classification, was its use for hum an consumption (steak or pulp) . Copyright © 2012 SciRes. OJMS  J. A. RODRÍGUEZ-PRECIADO ET AL. 6 Moreover, Font-Chávez and García-Rodríguez [30] off Costa Rica processed the information from 64 sets made in the sampling cruises that were made by the Depart- ment of Research and Development INCOPESCA for 2001, in which close to 6400 kg of bycatch was caught, with about 4400 kg returned to the sea for a 32% use. They also noted the depths below 25 m were more pro- ductive. They estimated that process could take a level be twe en 12 50 t/year and 1880 t/year under the actual con- ditions of exploitation. They wrote that the most abun- dant species in the catch that are discarded are those be- longing to the families Gerreidae, Haemulidae, Synodon- tidae, Scianidae, Bothidae, Serranidae, Muraenesocidae, Sphyraenidae, Lutjanidae, and Clupeidae. Other authors [31-34] have reported results of using the flesh of fish from the material in the preparation of surimi-based products like shrimp, crab, shr imp me at, sau- sage, and other frozen products. The prospect of a proper and sustainable management of fauna and fisheries needs the generation of indicators of biomass and size, as those generated in this work. This would allow a better understanding of the abundance and structure of the populations and would demonstrate the potential magnitude of landings to help make clear the current management of these resources. 5. Conclusions Exploration, evaluation, and management of marine and estuarine species captured as bycatch in the shrimp fishe- ry during 2008, such as Pomadasys panamensis, allowe d an analysis of their size distribution and density of bio- mass in catch from March to November 2008 in the coas- tal waters of northern Sinaloa and Nayarit, Mexico, in the southeastern Gulf of California. Pomadasys panamensis is likely to contribute signifi- cantly to the abund ance of the bycatch. In the end of Au- gust there was an average 90 t of initial biomass, with an initial 650,000 organisms, and with an average weight of 137 g. The population con tinues to grow and recruit until the start of fishing season, and the survivors then con- tinue to grow. We have seen that P. panamensis resists the pressure of the shrimp fleet fishing off the Mexican Pacific coast, and of the local artisanal fishery. It is important to conti- nue and deepen the studies of this species and those sho- wing the same pattern of survival to try to understand the mechanism of success of this species. 6. Acknowledgements To the National Fisheries Bureau (Instituto Nacional de Pesca) for the providing the samples and information necessary for this research. To CONACYT for the sup- port given during the doctoral studies. To Vicente Mo- reno Borrego, for his support in the catch of organisms in the samples taken. Thanks to Dr. Ellis Glazier for editing this English-language tex t. REFERENCES [1] W. Fischer, F. Krupp, W. Schneider, C. Sommer, K. E. Carpenter and V. Niem, “Guía FAO para la Identificación de Especies para los Fines de la Pesca. Pacífico Centro- Oriental,” FAO, Roma, 1995. [2] F. Amezcua-Linares, “Peces Demersales de la Plataforma Continental del Pacífico Central de México,” Universidad Nacional Autónoma de México, Me xic o, 1996. [3] J. Madrid-Vera, E. Girbau and H. Aguirre-Villaseñor, “Assessment of the Temporal Changes in the Fauna of the Trawl Catch from the Mouth of Rio Baluarte in the Southeastern Gulf of California, Mexico,” Marine Ecol- ogy Progress Series, Vol. 403, 2010, pp. 145-153. doi:10.3354/meps08434 [4] F. Amezcua-Linares, “Recursos Potenciales de peces Capturados con Redes Camaroneras en la costa del Pa- cífico de México,” In: A. Yáñez-Arancibia, Ed., Recursos Pesqueros Potenciales de Méxic o: La pesca Acompañante del Camarón, México, 1985, pp. 39-94. [5] M. E. Hendrickx, “Diversidad de los Macroinvertebrados Bentónicos Acompañantes del Camarón en el área del Golfo de California y su Importancia como Recursos Potenciales,” In: M. Yáñez-Arancibia, Ed., Recursos Pes- queros Potenciales de México: La pesca Acompañante del Camarón, Programa Universitario de Alimentos, UNAM-ICMyL, Mexico, 1985, pp. 39-94. [6] A. M. Van der Heiden and L. T. Findley, “Lista de los Peces Marinos del sur de Sinaloa, México,” Anales del Instituto de Ciencias del Mar y Limnología, Vol. 15, 1988, pp. 209-224. [7] J. De la Cruz-Agüero, F. Galván, L. Abitia, J. Rodríguez and F. J. Gutiérrez, “Systematic List of Marine Fishes from Bahía Magdalena, Baja California Sur, Mexico,” Ciencias Marinas, Vol. 20, No. 1, 1994, pp. 17-31. [8] J. Madrid-Vera, P. Sanchez and A. Ruiz, “Diversity and Abundance of a Tropical Fishery on the Pacific Shelf of Michoacán, México,” Estuarine Coast Shelf Science, Vol. 45, No. 4, 1997, pp. 485-495. [9] J. Madrid-Vera and P. Sanchez, “Patterns in Marine Fish Communities as Shown by Artisanal Fisheries Data on the Shelf off Nexpa River, Michoacán, México,” Fisher- ies Research, Vol. 33, No. 3, 1998, pp. 149-158. [10] M. E. Hendrickx, A. Van der Heiden and A. Toledano, “Results of the SIPCO Cruises (Southern Sinaloa, Mexico) aboard the B/O El Puma: Abundance and Distribution of Commercially Exploitable Mollusks,” Revista de Biolo- gía Tropical, Vol. 32, 1985, pp. 69-75. [11] J. Madrid-Vera, F. Amezcua and E. Morales, “An As- sessment Approach to Estimate Biomass of Fish Com- munities from Bycatch Data in a Tropical Shrimp-Trawl Fishery,” Fisheries Research, Vol. 83, No. 1, 2007, pp. 81-89. doi:10.1016/j.fishres.2006.08.026 [12] J. A. Rodríguez-Preciado, “Hábitos Alimenticios de Po- Copyright © 2012 SciRes. OJMS  J. A. RODRÍGUEZ-PRECIADO ET AL. Copyright © 2012 SciRes. OJMS 7 madasys panamensis (Steindachner, 1875) y Haemulopsis leuciscus (Günther, 1864) (PISCES: HAEMULIDAE) en la Costa de Sinaloa, México,” Tesis de Grado UNAM, Mazatlán, 2008 [13] F. Amezcua-Linares, “Peces Demersales del Pacífico de México,” Instituto de Ciencias del Mar y Limnología, Mé x i c o, 2 008. [14] M. Cruz-Romero, B. E. Espino and B. A. García, “Análi- sis Descriptivo de la Captura Ribereña en el estado de Co- lima,” Informe Técnico, INP, Manzanillo, 1989. [15] I. Martínez-Tovar, “Flatfish Species of the State of Si- naloa, South East Gulf of California and Their Distribu- tion in Relation to the Physical Environment,” Boletín Informativo del Mar, 2005. [16] K. Wyrtki, “Oceanography of the Eastern Equatorial Pa- cific Ocean,” Oceanography and Marine Biology Annual Review, Vol. 4, 1966, pp. 33-68. [17] R. T. Baumgartner and N. Christensen, “Coupling of the Gulf of California to Large-Scale Interannual Climatic Variability,” Journal of Marine Research, Vol. 43, No. 4, 1985, pp. 825-848. doi:10.1357/002224085788453967 [18] L. Xie and W. W. Hsieh, “The Global Distribution of Wind-Induced Upwelling,” Fisheries Oceanography, Vol. 4, No. 1, 1995, pp. 52-67. doi:10.1111/j.1365-2419.1995.tb00060.x [19] A. Badan, “La Corriente Costera de Costa Rica en el Pa- cífico Mexicano,” In: F. M. Lavin, Ed., Contribuciones a la Oceanografía Física en México, Unión Geofísica Mex- icana, Mexico, 1997, pp. 99-113. [20] NOAA, “Tropics: Climate Diagnostic Bulletin,” National Oceanic and Atmospheric Administration, 2007. http://www.cpc.ncep.noaa.gov/products/analysis_monitor ing/bulletin_1206 [21] C. P. Fiedler, “Seasonal Climatologies and Variability of Eastern Tropical Pacific Surface Waters,” Technical Re- port, National Oceanic and Atmospheric Administration, 1992. [22] C. P. Fieldler, D. W. Chavez and S. B. Behringer, “Physical and Biological Effects of Los Niños in the Eastern Tropical Pacific, 1986-1989,” Deep-Sea Research, Vol. 39, No. 2, 1992, pp. 199-219. [23] C. L. Hubbs, “Changes in the Fish Fauna of the Western North America Correlated with Changes in Ocean Tem- perature,” Journal of Marine Research, Vol. 7, No. 3, 1948, pp. 459-482. [24] P. Sparre and C. Venema, “Introducción a la Evaluación de Recursos Pesqueros Tropicales, Parte 1,” Manual FAO, Roma, 1995 [25] M. Haddon, “Modelling and Quantitative Methods in Fisheries,” Chapman and Hall/CRC, New York, 2001. [26] A. Gelman, J. B. Carlin, H. S. Stern and D. B. Rubin, “Bayesian Data Analysis,” Chapman and Hall/CRC, Boca Raton, 2004. [27] A. E. Punt and R. Hilborn, “Biomass Dynamic Models,” FAO Computerized Information Series (Fisherires), User’s Manual, Vol. 10, 1996, pp. 1-62. [28] R. Hilborn and M. Mangel, “The Ecological Detective. Confronting Models with Data. Monographs in Popula- tion Biology,” Princeton Academic, Princeton, 1997. [29] R. Castelo-Báez and M. Balsinde-Ruano, “Aprovecha- miento de la fauna de Acompañamiento (FAC) del Ca- marón en Costa Rica Mediante el Desarrollo de Productos Conformados,” FAO, Costa Rica, 2009. www.fao.org/fishery/countrysector/FI-CP_CR/7/es [30] L. Font-Chávez and E. García-Rodríguez, “Diagnóstico y Evaluación de las Posibilidades de Aprovechamiento de la fauna de Acompañamiento de la Pesquería de Camarón en Costa Rica: Reduction of Environmental Impact from Tropical Shrimp Trawling, through the Introduction of By-Catch Reduction Technologies and Change of Man- agement,” FAO, Costa Rica, 2010. fttp://ftp.fao.org/FI/DOCUMENT/rebyc/costarica/APRO VECHAMIENTO_CRI.pdf [31] R. H. Young and J. M. Romero, “Variability in the Yield and Composition of By-Catch Recovered from Gulf of California Shrimping Vessels,” Tropical Science, Vol. 20, 1979, pp. 85-87. [32] T. Min, T. Fujiwara, N. Mui-Chng and T. Ching-Ean, “Procesamiento de la pesca Acompañante en Bloques Congelados de carne Triturada (surimi) y en Productos Gelatinosos: Consulta Técnica sobre la Utilización de la Pesca Acompañante del Camarón Pesca Acompañante del Camarón,” Ottawa, 1983. [33] A. M. Cabello, L. Marcano, B. Figuera, Y. Márquez and O. Vallenilla, “Considerations about By-Catch in Vene- zuela,” Proceedings of FAO/DFID Expert Consultation on by Catch Utilization in Tropical Fisheries, Beijing, 21-23 September 1998. [34] A. M. Cabello, Z. Martínez, L. Villegas, B. E. Figuera, L. A. Marcano, A. Gómez and O. Vallenilla, “Fauna Acom- pañante del Camarón como Materia Prima para la Elabo- ración de Productos Pesqueros,” Zootecnia Tropical, Vol. 23, No. 3, 2005, pp. 217-230.
|