Journal of Modern Physics
Vol.3 No.9A(2012), Article ID:23099,11 pages DOI:10.4236/jmp.2012.329160
Gravity Field Variations Associated with the Buried Geological Structures: San Marcos Fault (NE Mexico) Case Study
Faculty of Earth Sciences, Autonomous University of Nuevo Leon (UANL), Linares, Mexico
Email: vyutsis@hotmail.com
Received June 27, 2012; revised July 28, 2012; accepted August 4, 2012
Keywords: Earth Gravity; Newton Potential; Geophysical Prospecting; Density Models; Free Air Anomaly; Gravity Field Variations
ABSTRACT
Gravity data are sensitive to local vertical offsets across high-angle faults, where rocks with different densities are juxtaposed. Yet high densities in some Mesozoic sedimentary rocks just above the basement may smear out the subtle gravity signatures of basement faults. At this study the gravity data processing tends to avoid ill-described “black-box” techniques. The study area is situated in the Palomas site, Cuatrociénegas region, Coahuila, NE Mexico. The San Marcos Fault is at least 300 km long and has WNW-ESE trend from the central part of Nuevo León State through Coahuila, and finally to the eastern part of Chihuahua State. Gravimetric data shows that the lowest values of free air and Bouguer anomalies are in the southern part of the area, and the highest values are in the western and central part of the area. Between these parts exists a zone of high horizontal gravity gradient. Configuration of linear elements of gravity field (gradient zones) delimited the San Marcos Fault in the San Marcos valley below thickness of recent sedimentary cover. Two density models were carried out, which showed that the Cretaceous rocks are in discordant contact with the Paleozoic rocks that can be related to the San Marcos Fault. The density was determinate using to Nettleton’s method, which results highlight the presence of the San Marcos Fault. Density models showed that the Quaternary sediments are in direct contact with the San Marcos Fault.
1. Introduction
Steep, straight faults are commonly expressed as subtle potential-field lineaments, which can be gradient zones, alignments of separate local anomalies of various types and shapes, aligned breaks or discontinuities in the anomaly pattern, and so on [1-4]. Many large magnetic and gravity anomalies represent the ductile, ancient, healed basement structures, obscuring the desirable subtle features [1-8].
Subtlety of the desirable lineaments necessitates detailed data processing, using a wide range of anomalyenhancement techniques and display parameters. The final choice of processing steps depends on which aspects of the anomalies one aims to enhance, as well as on experimentation with various techniques [1,3,5,9,10].
Not a panacea, data processing is a necessary evil. Because the signal and noise anomaly characteristics commonly overlap, complete separation between them may be impossible. Noise artifacts may actually be introduced [3].
Unexpected consequences and processing side-effects are normal. As well, it may be hard to know in advance which of the many anomalies are desirable.
The processed and enhanced anomalies should ideally be easy to relate back to the original anomaly shapes. We kept the data processing to a minimum, avoided ill-described “black-box” techniques, and relied on mathematically simple and intuitive procedures [3,5-11].
The San Marcos Fault (SMF), was defined by Charleston [12,13], and is outcropping in Central Coahuila in northeast Mexico correspond to one of the three major zones of west-northwest trending lineaments interpreted as basement faults that controlled the tectono-sedimentary evolution since the Triassic-Jurassic in the region [14,15] (Figures 1 and 2), the others structural lineaments are: The La Babia fault (LBF) [12,13], located in Northern Coahuila; and the Mojave-Sonora Megashear (MSM) [14-16]. From these basement faults, only the SMF has a
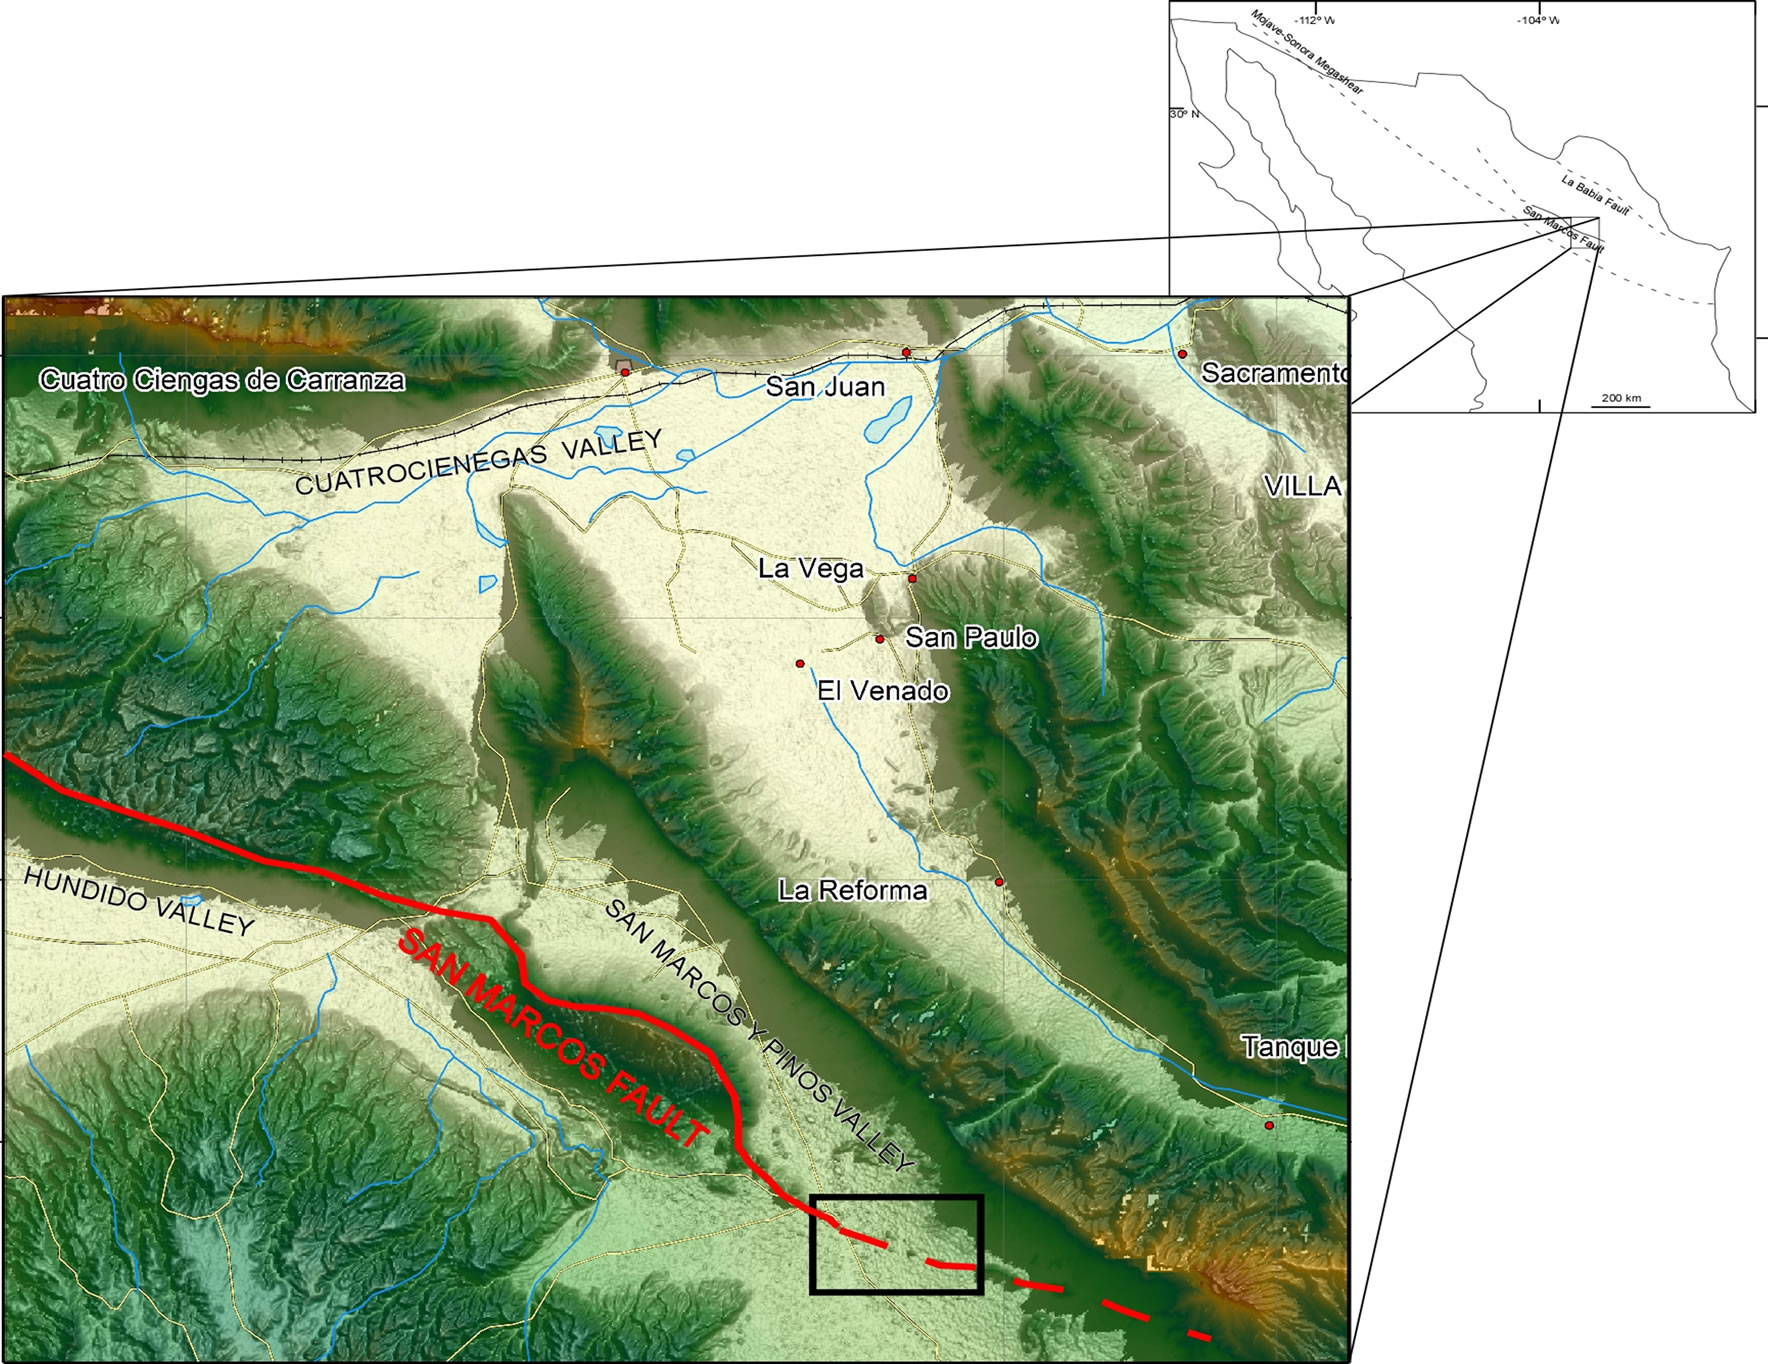
Figure 1. Position of San Marcos Fault in northern Mexico. Modified after McKee et al., 1984 and 1990; Padilla y Sanchez, 1986; Aranda-Gómez et al., 2005. Inset: Location of San Marcos Valley, Pinos Valley and the Palomas study area.
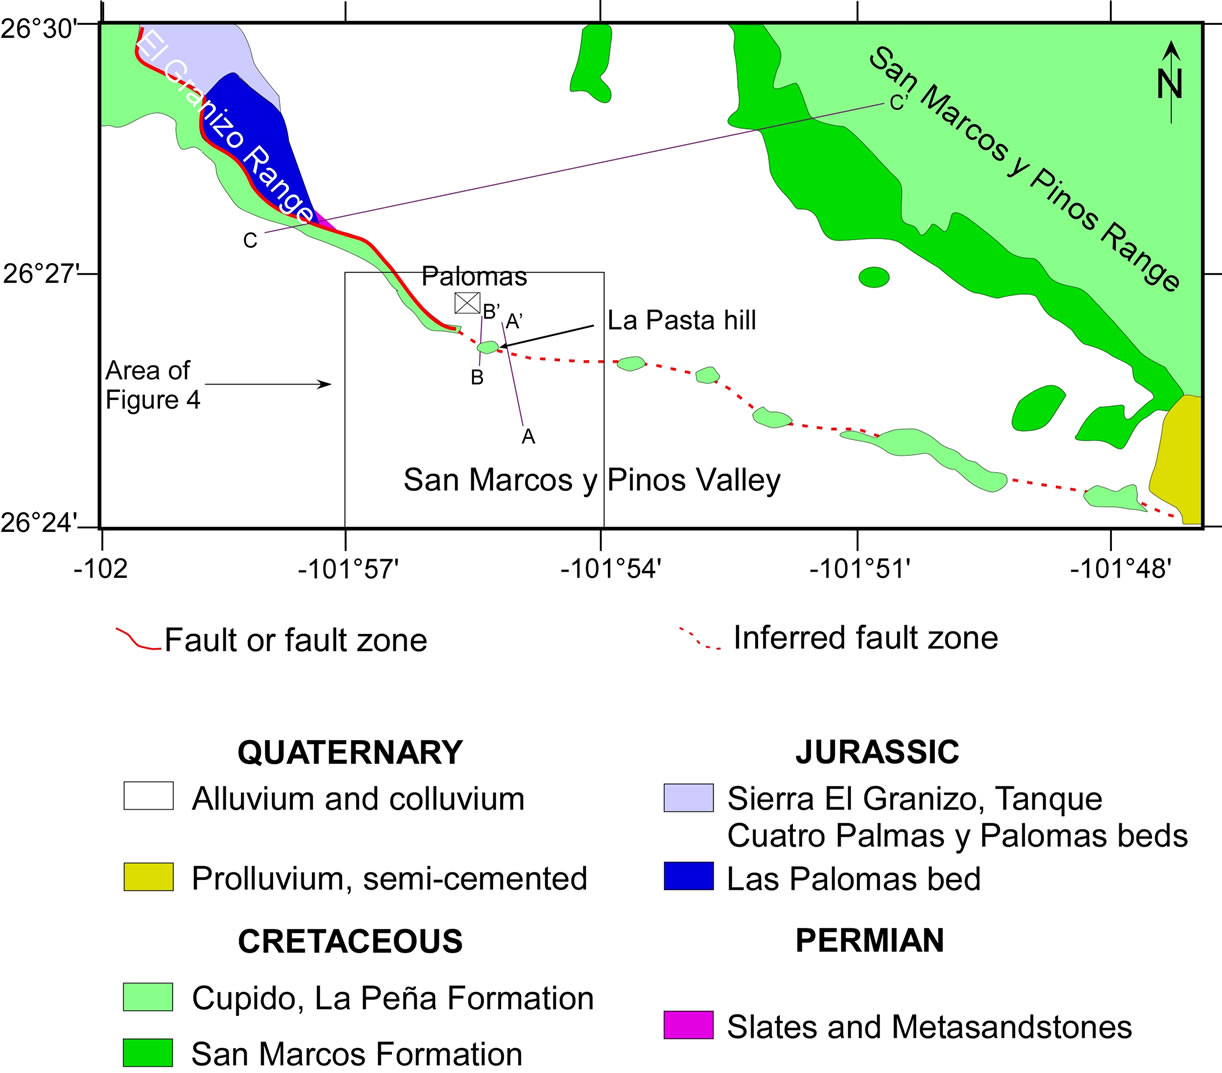
Figure 2. Geological map of the study area. A-A’ and B-B’ are the 2D density models; C-C’ is the geological cross section by McKee et al., 1990.
trace well defined from stratigraphic and structural evidence, which can be followed since Potrero La Gavia, through San Marcos Valley (SMV), to Potrero Colorado and to the Sierra Mojada [17-21]. These authors mentioned that SMF is distinguished by: contrasting structural styles between the Coahuila block and the Coahuila folded belt; the existence of a pre-Tithonian and Neocomian major sedimentary clastic wedge related to its activity and deposited in the hanging wall of the fault; and the existence of fault contacts between Permian, Jurassic, and Cretaceous rocks in the SMV and Potrero Colorado areas (Figure 2). In areas where the SMF is buried, such as the Camargo volcanic field has been inferred from structural features in the surface [22-24].
The SMF, LBF and the MSM play an important role to understand the tectonic and stratigraphic evolution of northeast Mexico. Several authors [14-16,23,25,26] propose that these fault systems (SMF and LBF) were reactivated at different times. McKee et al. (1984) found evidence of movement of the San Marcos fault during the Jurassic, Early Cretaceous, and Tertiary. Additionally, Aranda-Gómez et al. (2005) suggest that SMF have been reactivated during the Late Pliocene-Quaternary by normal faulting in the border of Chihuahua-Coahuila states. In central Coahuila not has been documented Quaternary activity, due to the works published have been focused mainly in the study of pre and syn-laramide reactivation of the fault. As mentioned before, the study of the SMF is related only with geologic information, geophysics data not are available concerning to characterization of this basement fault. One goal of interest about the possible reactivation of the SMF at Plio-Quaternary time is the seismic risk associated with potential earthquakes related to this fault. Northeast Mexico is characterized by low seismicity and a lack of strong ground motion records [27-30].
Large intraplate earthquakes in the relatively stable interior regions of continents are rare in comparison with those that originate in plate boundary regions. However, these occasional events can be extremely devastating, because cities located in continental interior regions are often built without seismic design criteria. Crone et al. (2003) mention that major intraplate earthquakes can cause widespread damage because the attenuation of seismic energy from large earthquakes is relatively low in plate interiors. Galván-Ramírez and Montalvo-Arrieta (2008) made a compilation of the historical seismicity in northeast Mexico; they found that some of the epicenters locations are overlaped or near to the traces of the major regional faults trending west-northwest postulated in northeast Mexico: LBF, SMF, and MMS. Figure 3 shows the historic seismicity for northeast Mexico. These authors hypothesize that seismic activity reported for this region, which lies near or on the trace of these faults,
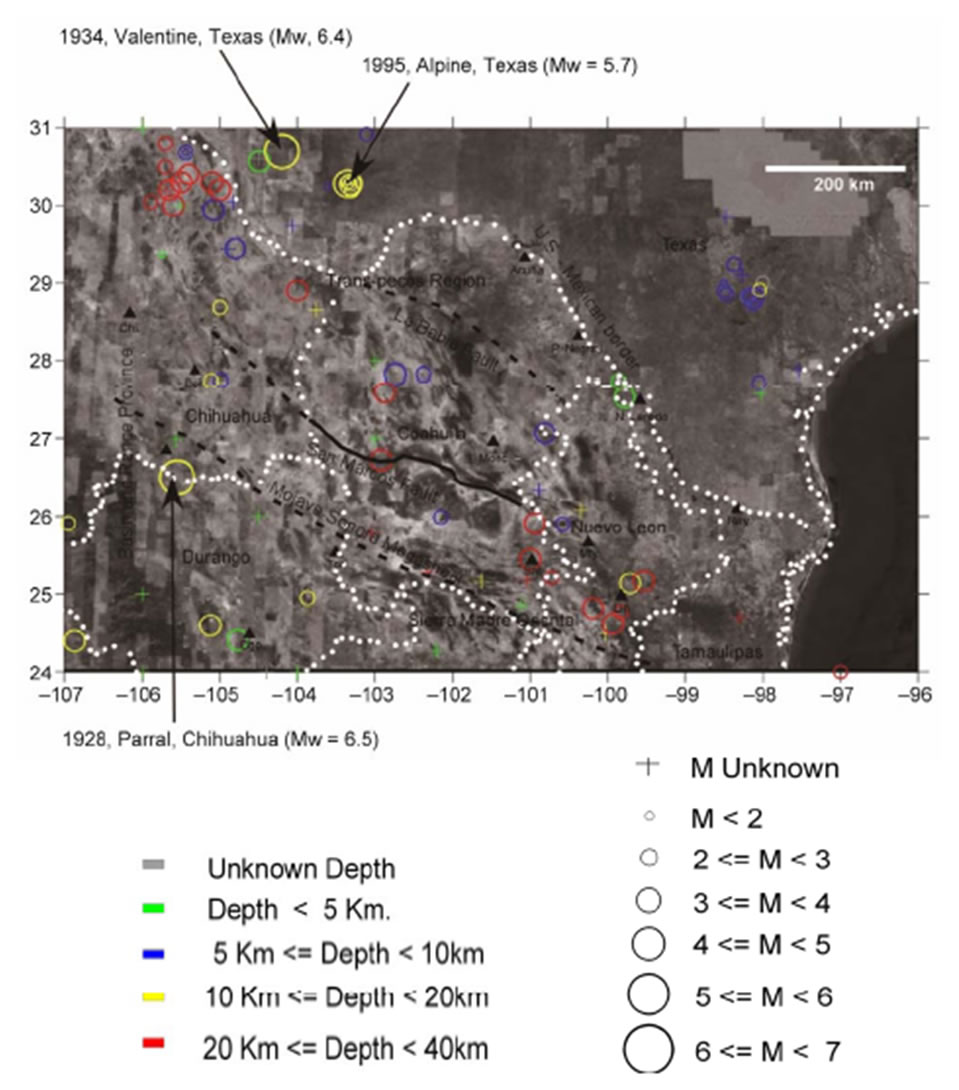
Figure 3. Historic seismicity of northeastern Mexico and southern Texas (1847-2005). The open circles represent the epicentral location of the earthquakes studied. The solid and dash lines depict the three general north-northwest trending lineaments and faults that have been identified or postulated in northeast Mexico, the La Babia fault, the San Marcos fault, and the Mojave-Sonora megashear (MSM). Triangles show largest cities (Acuña; Chi: Chihuahua; Del: Delicias; Parral; Tor: Torreón; Mon: Monclova; Sal: Saltillo; Mty: Monterrey; Lin: Linares; N. Laredo: Nuevo Laredo; P. Neg: Piedras Negras; Rey: Reynosa) (Modified after Galván-Ramírez and Montalvo-Arrieta, 2008).
could be related to reactivation of these major faults. However, to probe this hypothesis is necessary to install a seismic network to confirm or refute the presence of seismicity associated with these fault systems. Additionally, these authors mentioned that a possible critical scenario would represent a rupture (MW = 6.5) in the south segment of the San Marcos fault in Central Coahuila. The importance of this scenario is the settlement of three of the most populated centers in northeast Mexico (Monterrey, Saltillo and Monclova with a total population of more than six million) located in a radius less than 150 km from the fault source.
Some evidence of recent seismicity could be obtained from visual observation of deformation of latest sediments covering fault zone. One way to identify buried faults systems in sedimentary valleys is by means of gravity data. The goal of this study is identifies the SMF zone in the SMV in central Coahuila from gravity data and have the first stage to identify if there is evidence of displacements in Quaternary sediments. To develop thiswe obtain for first time precision gravity data for five north-south trending lines across the Palomas area (Figure 4) in SMV.
2. Geologic Framework
The Palomas area is located to the NW of San Marcos y Pinos valley and to the SE of Sierra El Granizo, between 26˚24'N and 26˚26'N, and 101˚50'W and 101˚57'W (Figures 2 and 4). In this area there are some isolate hills composed by limestone of Upper Tamaulipas Formation that can be associated to displacement of the SMF, we recollected gravity data distributed in five profiles, and two of them cross the La Pasta hill (Figure 4).
SMV is located in central Coahuila and represents an area where there is excellent evidence of the SMF [14,19, 31].
The SMV are compose by pre-Jurassic outcrops composed by small lenses of granite rocks at NW of the valley and slates and metasandstones in fault contact with both Cretaceous and Jurassic rocks at northwest of the Las Palomas area. The Jurassic sediments composed by conglomeratic sandstone of Las Palomas beds and sandstone of the Sierra El Granizo beds are exposed along the foothills of the Sierra El Granizo and in the valley where a gradational contact with overlying Neocomian San Marcos Formation is exposed. Tanque Cuatro Palmasbeds consist of nearly 100 m of fine-grained marine sedimentary rocks without conglomeratic units [14]. The Cretaceous sediments are defined by the San Marcos Formation composed by continental alluvial deposits represented by conglomeratic units of pebbles or cobbles of volcanic rocks with subordinate quartz, and plutonic fragments, overlying in a discordant contact is limestone of the Cupido Formation, the sedimentary sequence are complete by shale and marble of the La Peña Formation, follow by limestone of Tamaulipas Superior Formation, overlying by limestone, shale and banded chert of Cuesta del Cura Formation and interbeded shales with marble and gysum veins of Indidura Formation, the marine sequence is overlie discordantly by Quaternary deposits [14, 19,31].
3. Geophysical Data Collection and Reduction
More than 150 gravity reading points grouped in 5 lines were carried out nearly perpendicular to the main trace of the SMF. Gravity stations spacing was from 15 - 20 up to 40 - 50 meters. Gravity meter Autograv CG-5 with 0.001 milligal (mGal) of reading resolution was used (1 Gal = 1 cm/s2). Gravity reference station was established in the Central Place of Cuatrocienegas city.
The error of measurements (RMS error) did not exceed 5 microgal (μGal). Corrections were applied in real
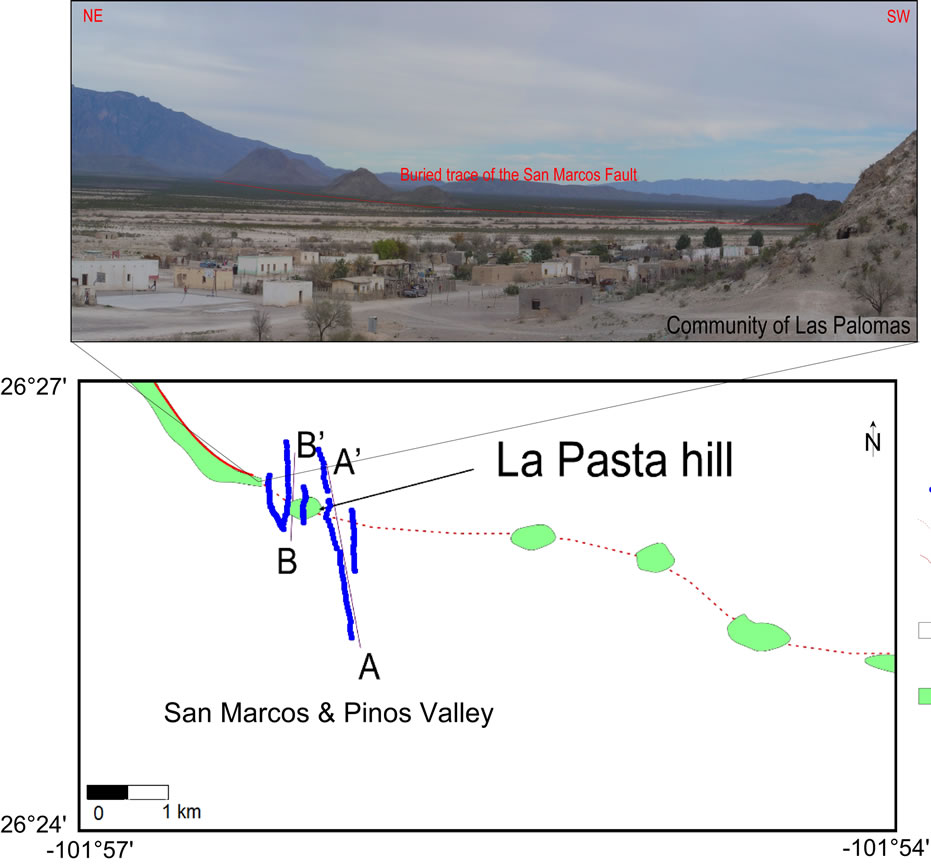
Figure 4. Panoramic view of the Palomas area. Geologic map and the distribution of gravity points over the study area. Modified after Arvizu Gutiérrez (2006).
time for tilt errors, for long term drift, for the temperature of the sensor, and for earth tides. The seismic filter was applied too. The location of gravity stations was determined by a GPS Magellan Platinum with a horizontal accuracy of 5 - 7 m.
Elevation of the gravity reading points was measured with a Total Station Nikon DTM-551 with precision of ±2 mm. The standard corrections, e.g. instrumental drift, latitude, elevation using new standards to reducing gravity data were applied to obtained measurements [32]. As a result of field data correction and processing free air and Bouguer gravity anomalies were obtained. Data interpretation procedures include Fourier transformation, wavelength filters, upward and downward continuation, vertical and horizontal derivates, etc. [1,5,9,11,33,34]. A series of maps (Figures 5(a)-(d)) and graphs (Figures 6 and 7) show gravity anomalies interpretation technique. 2D geological-geophysical models were elaborated (Figures 8 and 9).
A sea level datum NAD 83 and the standard density 2.3 g/cm3 were used for the elevation correction. The terrain correction was calculated using the method by Hammer and was applied to each gravity station to obtain the complete Bouguer anomaly.
Gamma ray measurements were carried out additionally to gravity study. Gamma ray reading points were the same as gravity stations. GRS-500 Differential Gamma Ray Spectrometer/Scintillometer was used to measure the gamma radiation emitted by various daughter isotopes in the uranium decay series. Sample rate was selected as 10.0 seconds, and energy window was choosing detecting total count above 0.08 MeV. Observed count rates were corrected due to dead time (4 microseconds).
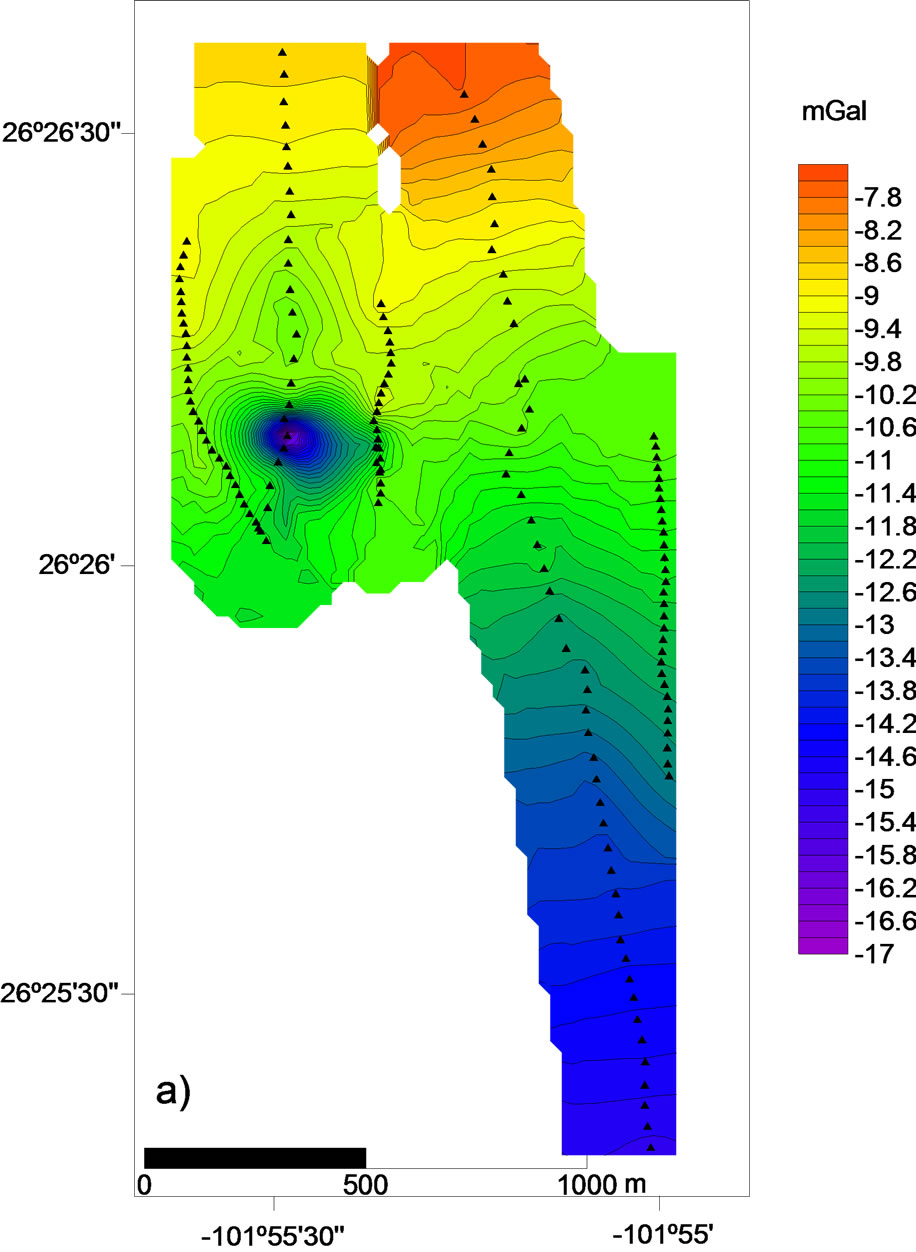
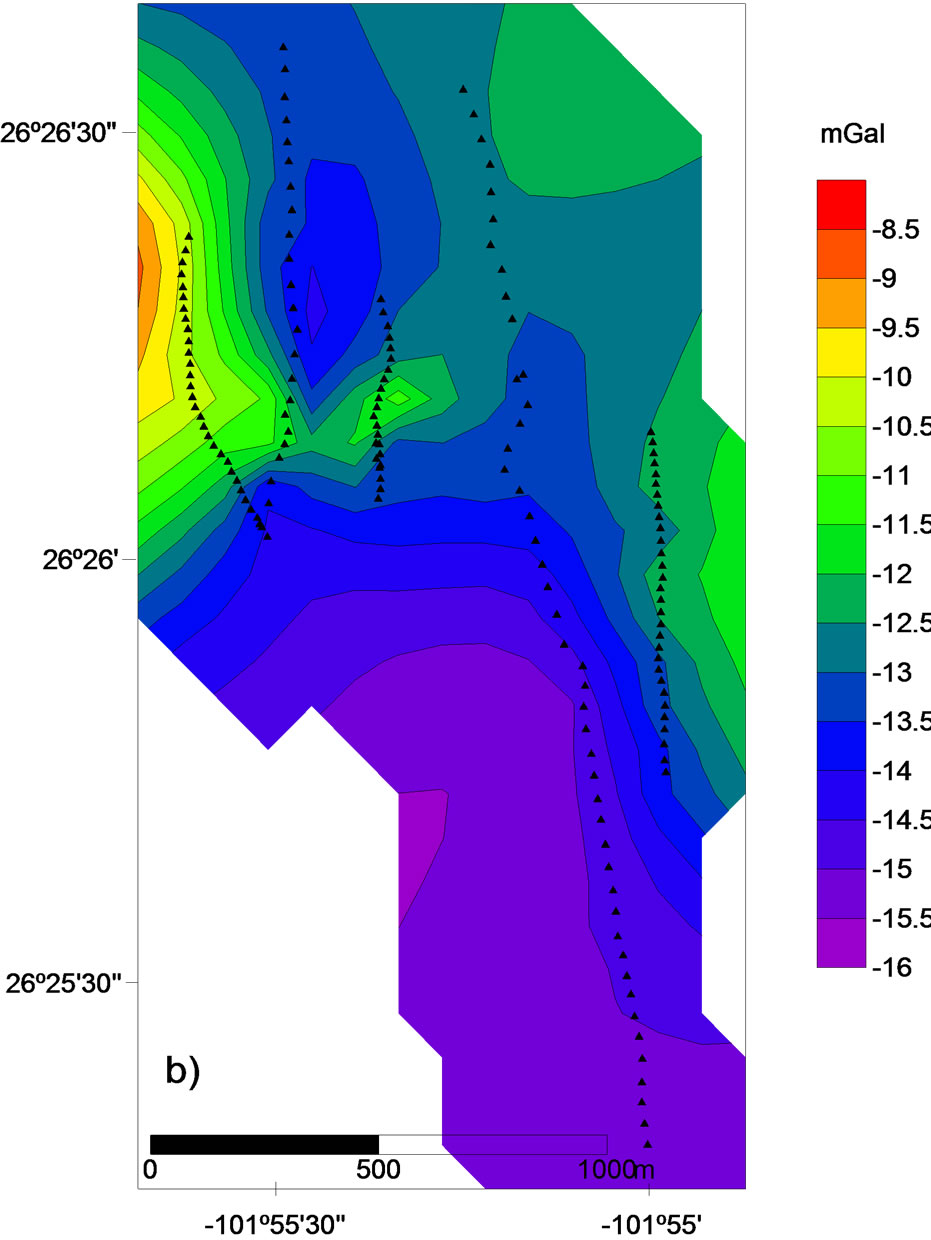
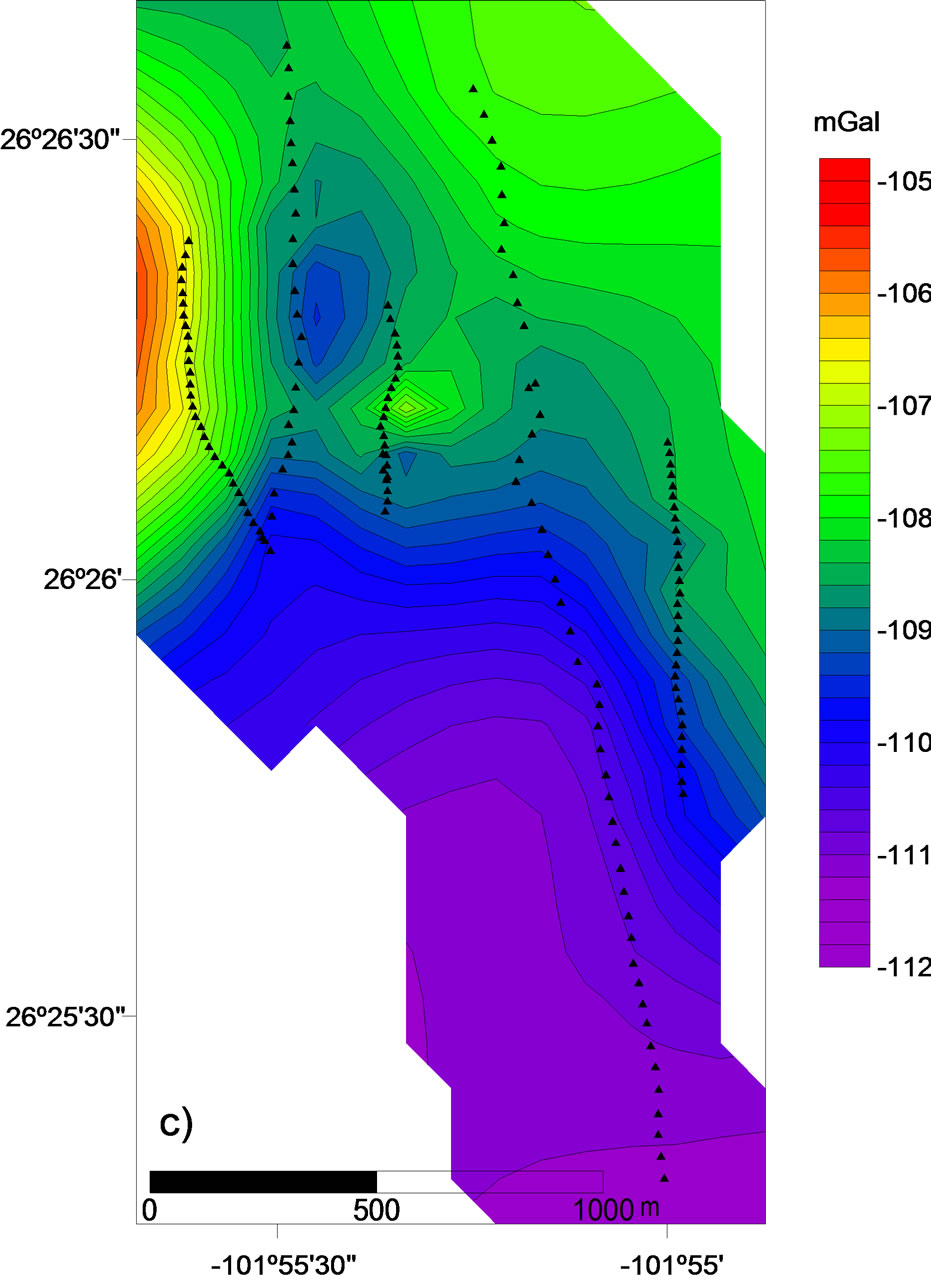
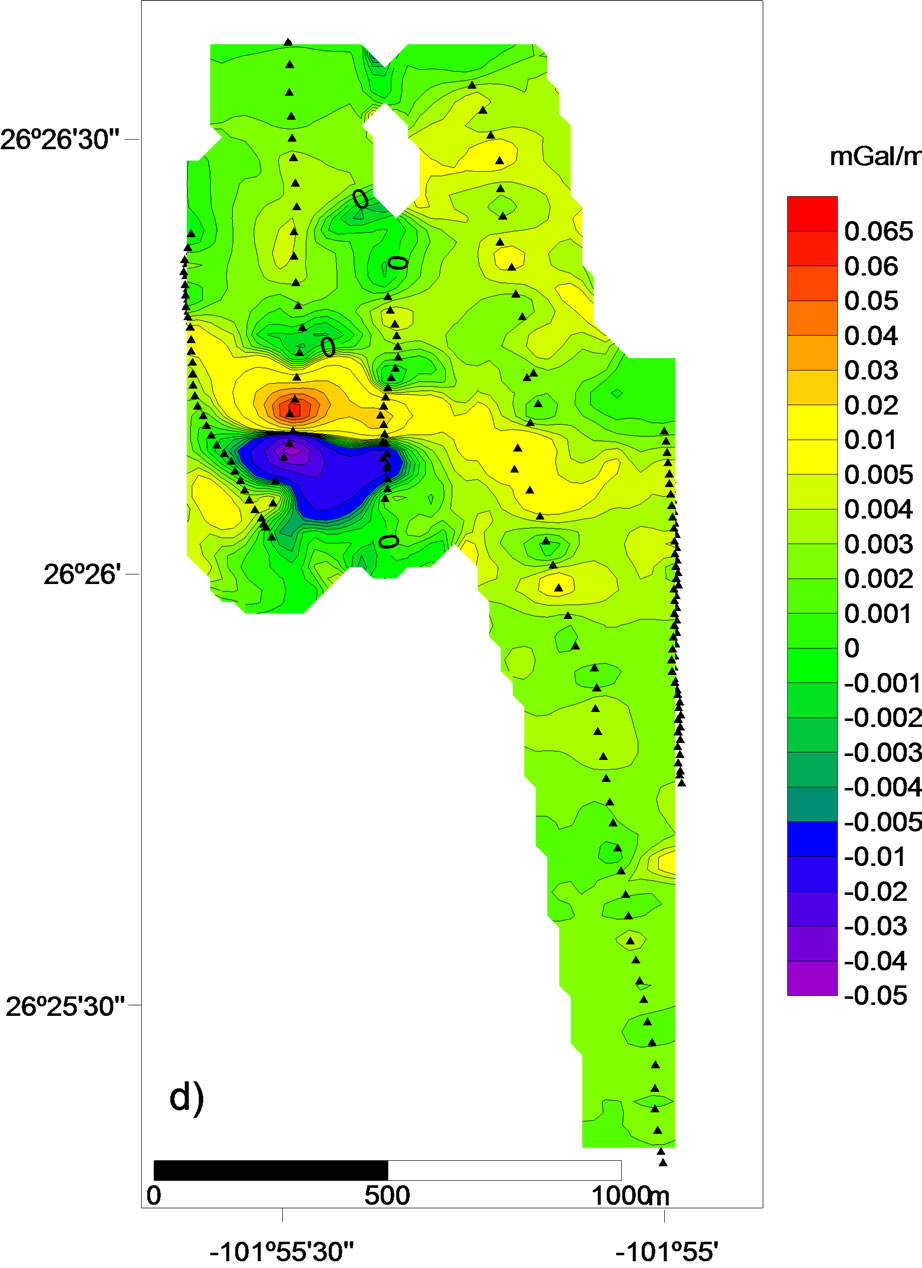
Figure 5. Gravity maps of study area: (a) Observed gravity; (b) Free air anomaly; (c) Bouguer gravity anomaly; (d) Horizontal gradient of gravity.
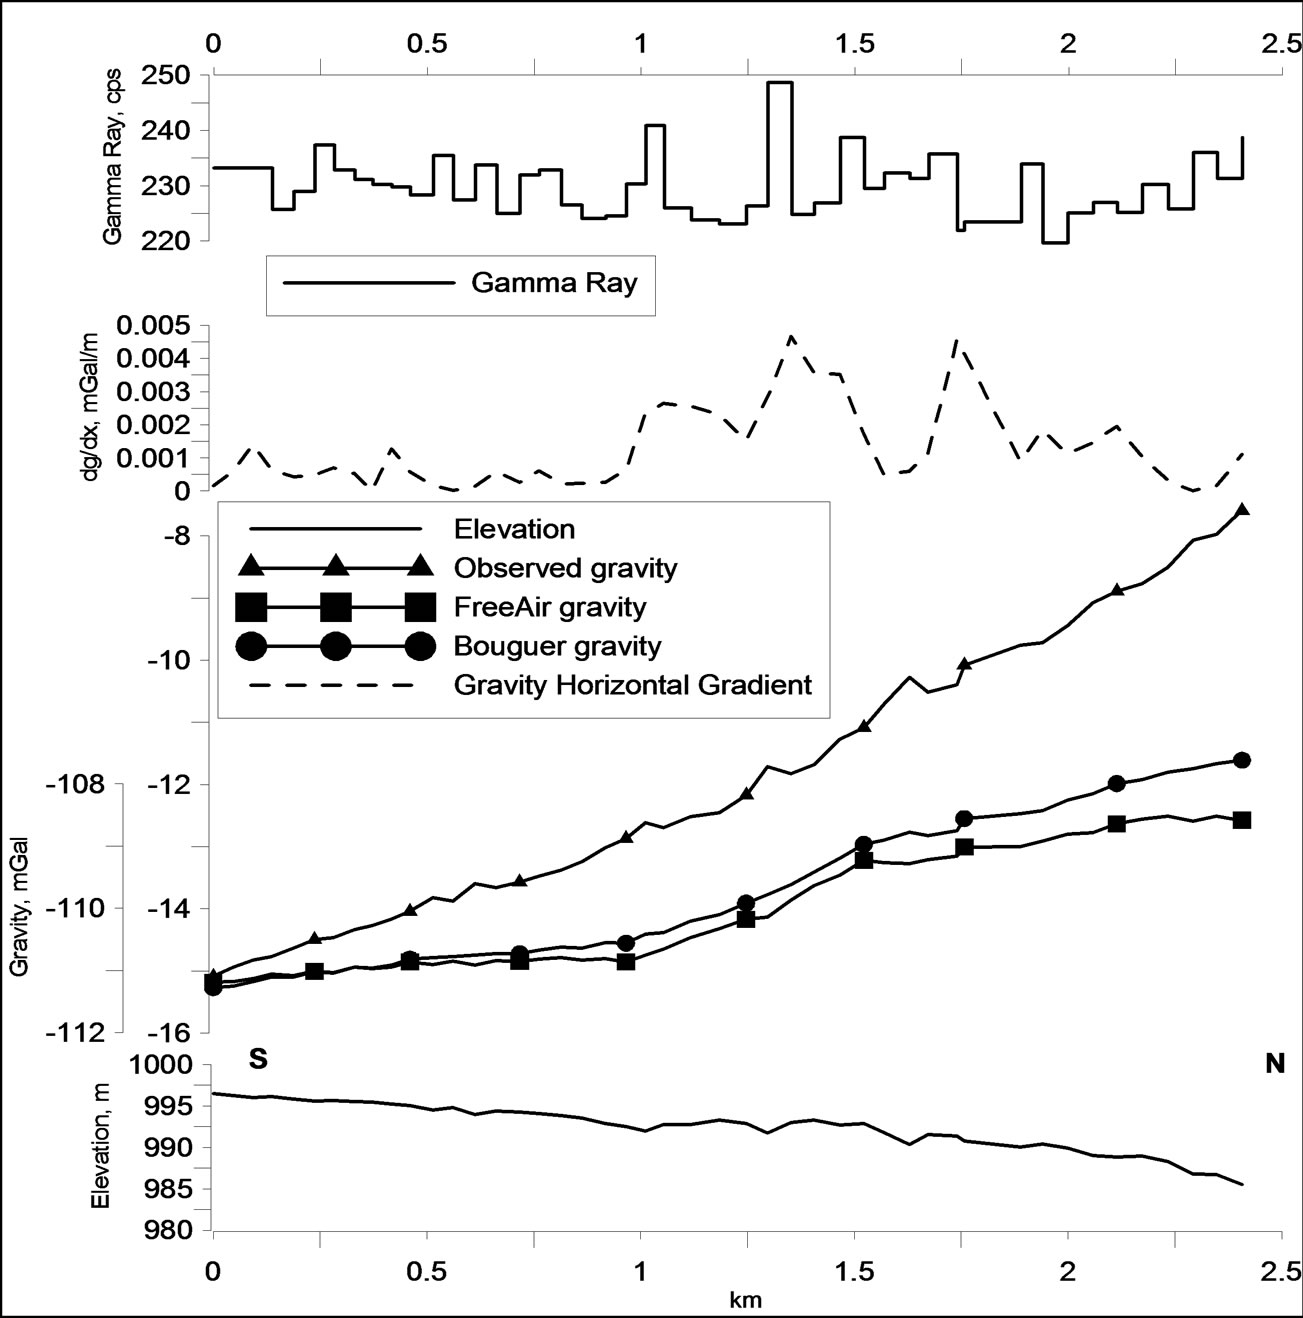
Figure 6. Geophysical curves along the profile 4. These graphs show strong coincidence between observed gravity, free air and Bouguer anomalies, horizontal gravity gradient, and also gamma ray measurements.
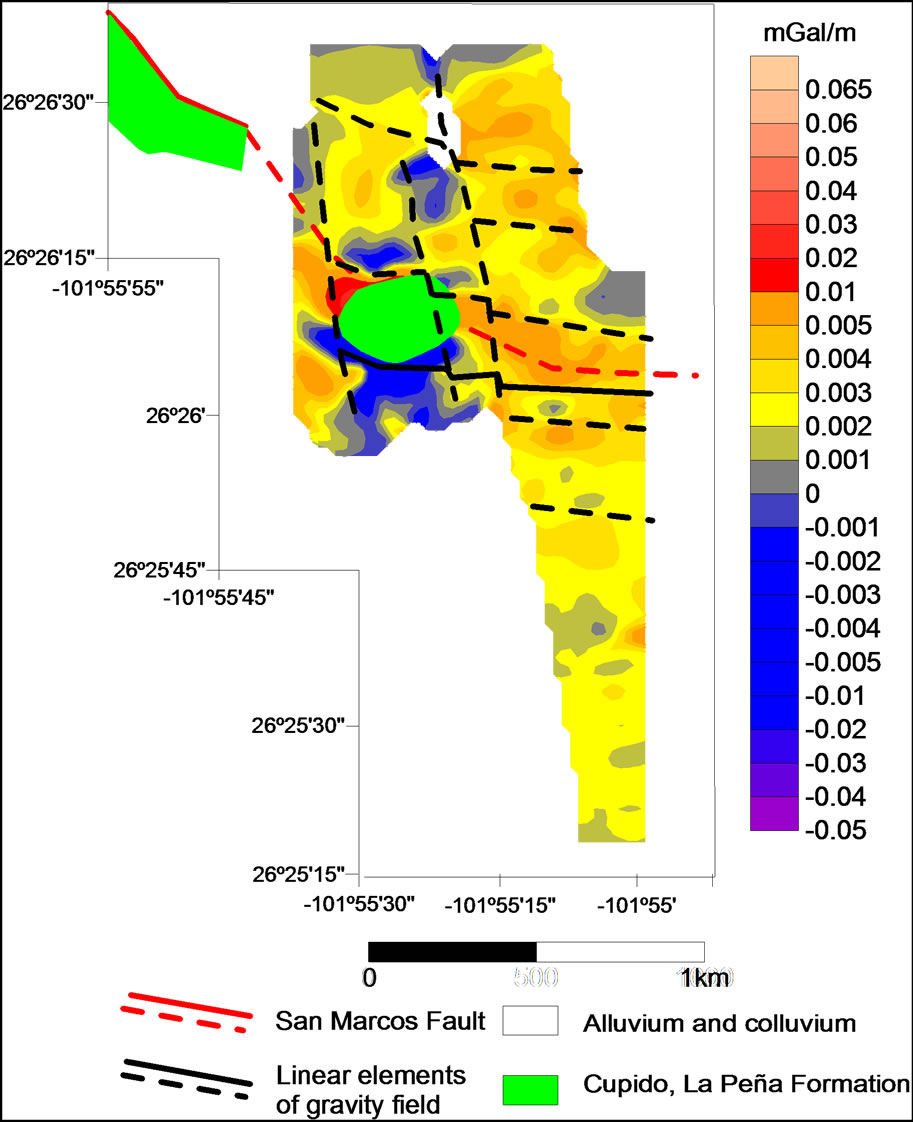
Figure 7. Delimitation of the San Marcos Fault in San Marcos Valley on the gravity data analysis.
4. Gravity and Gamma Ray Data Analysis
The observed gravity map (Figure 5(a)) shows an isolated gravity high in the NE part of study area. Southeast of this high, an extensive gravity low is observed. The amplitude of gravity field between these extreme parts reaches 24 milligals (mGal). A high horizontal gradient zone (up to 0.01 mGal/m) is shown here (Figure 5(d)).
The free air gravity map (Figure 5(b)) shows an anomaly that divide two big blocks. The southern block present the lowest values that varying between –15.5 to –14.5 mGal. The northern block shows high gravity values. Anomalies of –9.0 - 12.5 mGal are observed here. The Bouguer anomaly (Figure 5(c)) shows the same behavior that the free air gravity, where can see two main areas. The complete Bouguer gravity (Figure 5(c)) values in the southern part of the study area are in the range of –109 up to –112 mGal and show several weak local anomalies with an amplitude of ±0.2 mGal. Gravity high with a range of –105 up to –108 mGal is shown in the northern part of area. There is a relatively gravity low (up to –110 mGal) between two extreme parts of this positive zone. A strong gravity gradient zone marks a structural boundary between these blocks. It seems that this strong anomaly is related to the main trend of the fault zone in
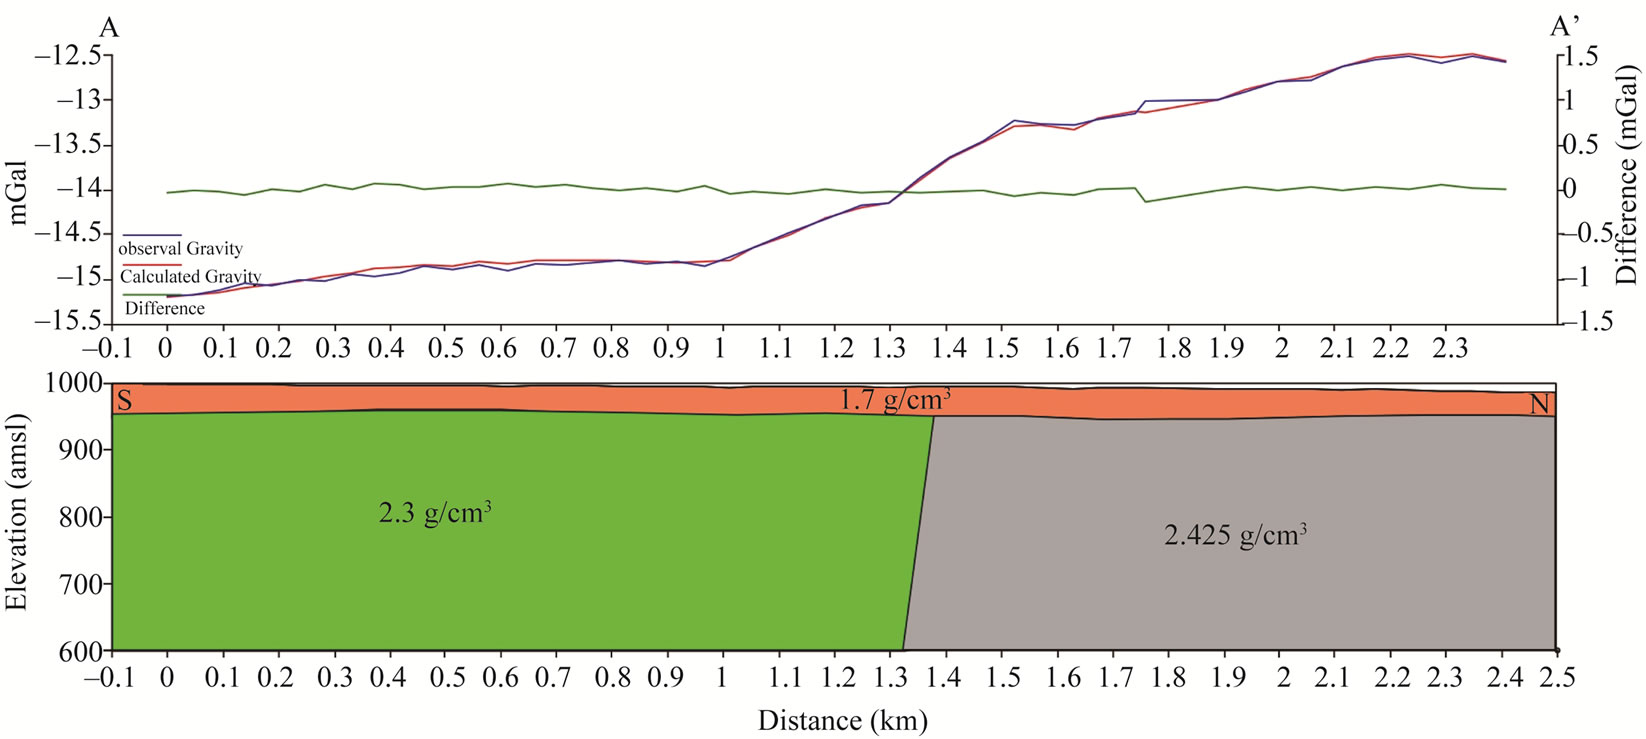
Figure 8. Results of gravity surveys for the profile A-A’ (location shown in Figure 4) show residual Bouguer gravity anomaly and best-fit inverse density model at Palomas site, a normal buried fault is inferred.
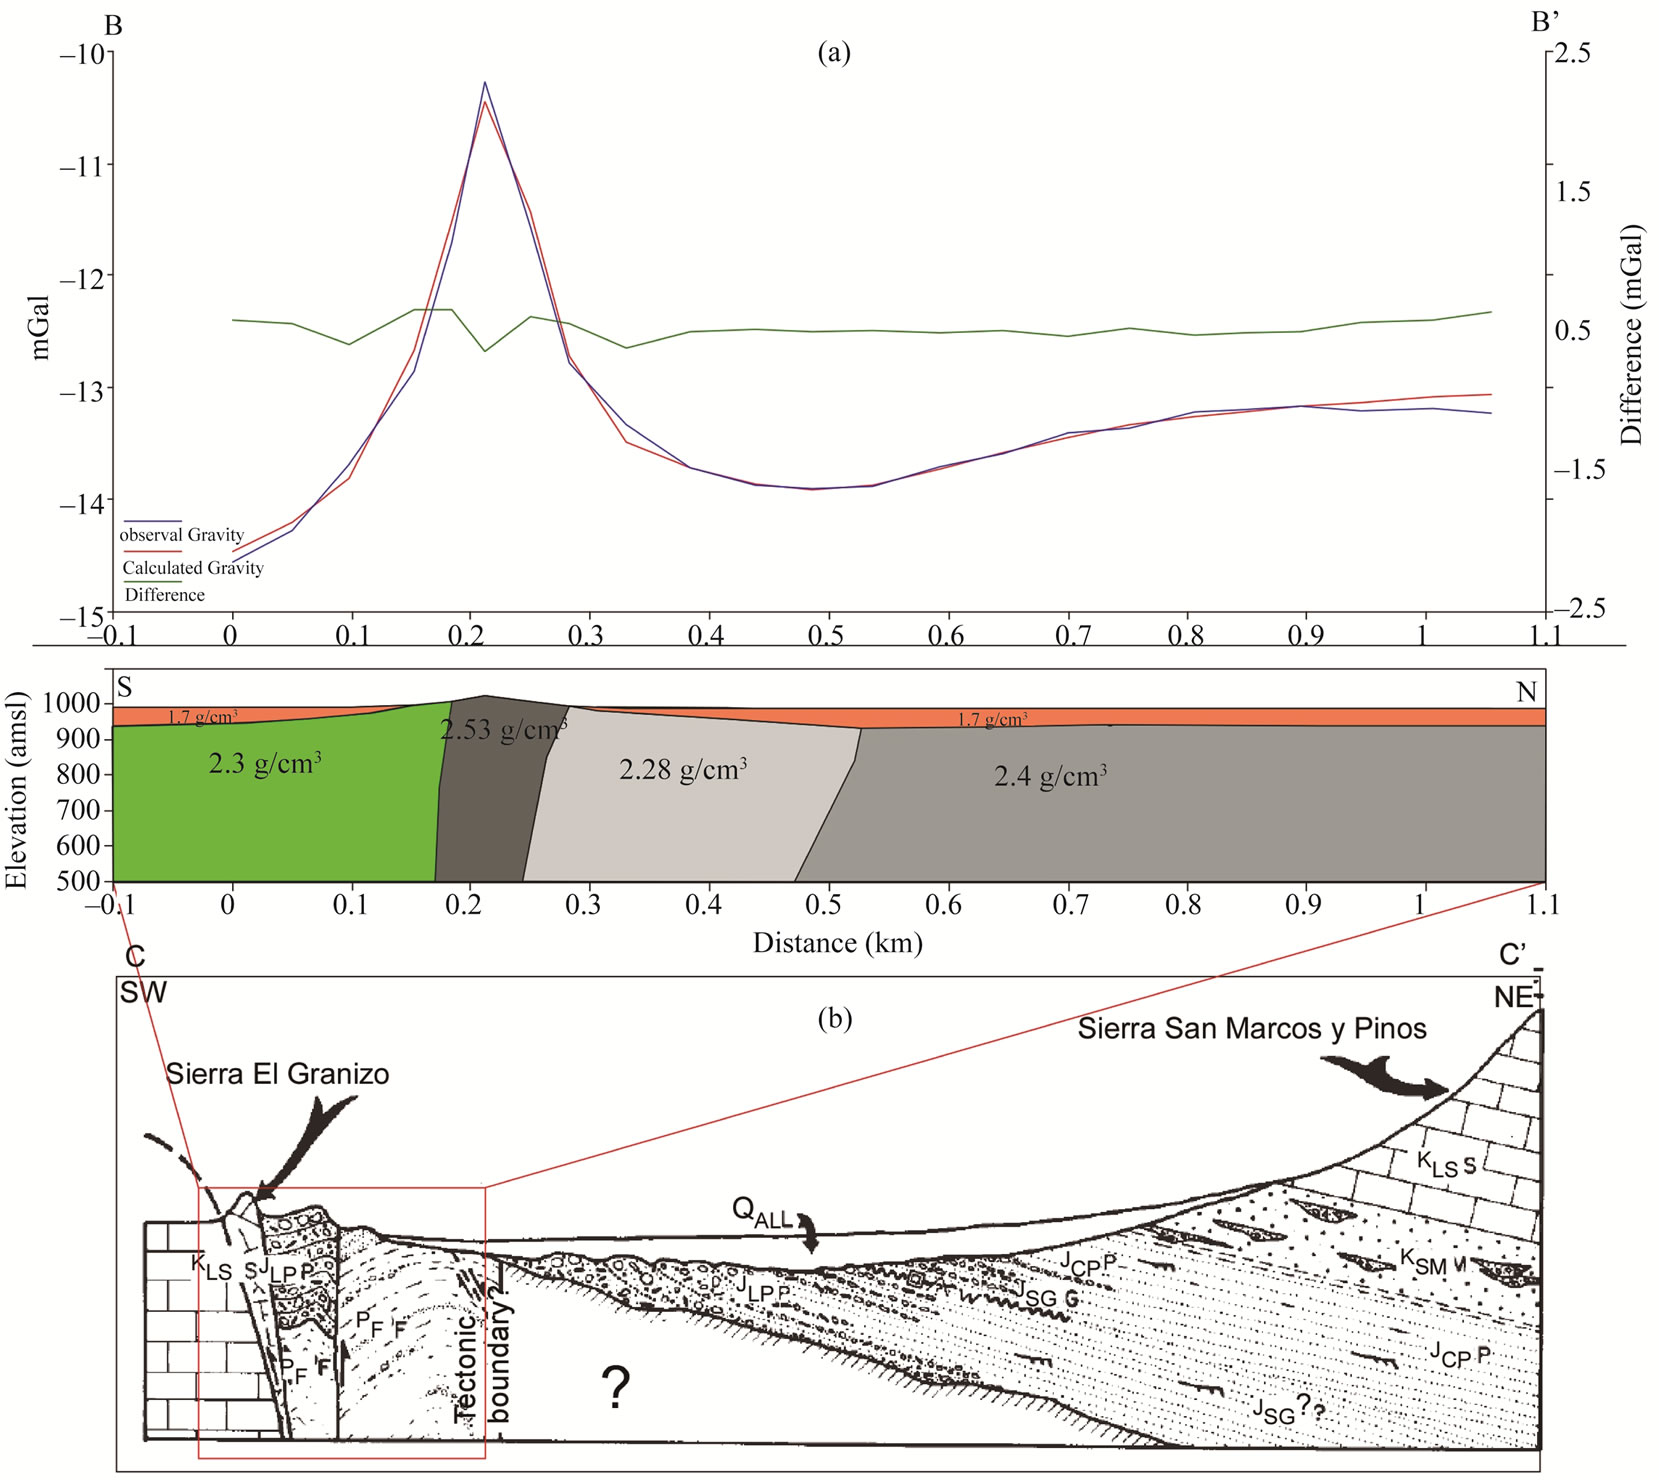
Figure 9. (a) Conceptual density model for the profile B-B’ (location shown in Figure 4); and (b) Generalized geologic cross section extending from the Sierra El Granizo northeastward to the crest of Sierra San Marcos y Pinos when is localized the tectonic boundary (C-C’). PF, Paleozoic flysch and wildflysch; JLP, Las Palomas beds (Late Jurassic); JSG, Sierra El Granizo beds (Late Jurassic); JCP, Tanque Cuatro Palmas beds (Late Jurassic); KSM, San Marcos Formation (Early Cretaceous); KLS, Cretaceous limestone; Tamaulipas Superior, La Peña y Cupido Formations (Late Cretaceous); QAL, Alluvium (Quaternary). The box shows part of the cross section that can have relation with the density model for profile 5 (Modified after McKee et al., 1990).
the area. The values of horizontal gravity gradient here are about 0.0035 - 0.004 mGal/m (Figure 6) and reach 0.035 - 0.04 mGal/m near the main fault zone (Figure 5(d)). The same characteristics have the gamma ray curves, which show a close coincidence with gravity gradient zones. For example, Figure 6 shows two extreme values of horizontal gradient 0.0024 mGal/m and 0.00450 mGal/m and two gamma ray peaks (240 cps and 250 cps) correspond them. As general, observed and transformed gravity anomalies was revealed trending northwestsoutheast across the central part of Las Palomas area. An extensive gravity gradient zone trends in the same direction. This zone probably represents the San Marcos Fault, which crosses the area from northwest to southeast (Figure 2).
The gravity data suggest a complex subsurface structure in the San Marcos Valley area. It seems that two distinct systems of linear elements dominate in the basement as well as shallow structure (Figure 7). The first has a southeast direction and it coincides with the San Marcos Fault main direction, plotting along the general axe of the San Marcos Valley. The second linear system has a nearly perpendicular (north-northwest-south-southeast) direction. It seems that these faults divide the San Marcos Valley area to the several blocks of basement accordingly the main structure of the San Marcos Fault (Figure 7).
5. Modeling 2D of Gravity Data
Figure 7 shows the contour of the Bouguer map and the main geologic features in the study area. In this figure is depicted the fracture arrangement that we interpreted from gravity data too. Two sets of fractures can be interpreted from the gravity data: WNW-ESE and NNW-SSE (Figure 7). It is associated with the isolated calcareous hill (La Pasta) at center of figure, which can be correlated with the trace of the SMF (red discontinuous line).
We also interpreted secondary faults that have the same orientation that SMF and a systems of faults or fractures the cut the main trending system that corresponds to conjugate faults.
From gravity data we constructed two 2D cross sections models for profiles A-A’ and B-B’ (Figure 4). The first one (A-A’) shows the model located in the sedimentary valley (Figure 8). In this figure are identified three units with the follow density values: Red unit with a density of 1.7 g/cm3 related to alluvial deposits. The green unit has a density value of 2.3 g/cm3 correlate with calcareous materials that is in a strong discontinuity or fault contact with the grey unit that is related to material with an increase in density of 2.425 g/cm3 that correspond to Paleozoic flysch. The same figure point up the correlation between the observed and calculate gravity data by the 2D model, which shows a step geometry of the gravitational anomaly; the interpreted source of this anomaly is due to the presence of the SMF. The difference of density for each block varies 0.125 g/cm3. The denser rocks are in the handing-wall of the fault. In this profile the anomalies can be associated to: a) basement up-lift or b) density contrast between rocks. These two circumstances can be interconnected as follows: small negative anomalies can be caused by increase in the thickness of quaternary sediments in those places where the rocks are less strong and less dense; we observed local positives anomalies that can be related to denser rocks denser rocks which are less weathered and thicker than the surrounded county rocks.
Figure 9 depicts the profile B-B’, it cross-cut La Pasta hill which have a height about 40 m and where calcareous rocks are outcropped, this profile has a south-north direction. The observed and calculated gravity show a positive anomaly of 4 mGal in the La Pasta hill and a small negative anomaly nearby –0.5 mGal to the north from this hill which can be related to denser rocks (0.1 mGal). Positive anomaly in area of the La Pasta hill reflects a relative high effective density of 0.23 g/cm3 (density of adjacent rocks is about 2.53 g/cm3). Geologically, this anomaly can be correlated with stronger and denser blocks by mineralization or low grade metamorphism. Negative anomaly can be caused by a thicker package of quaternary sediments. We identified the follows density units (Figure 9): Red unit with a density of 1.7 g/cm3 related to alluvial deposits, the green unit had a density value of 2.3 g/cm3 correlate with calcareous materials, that is in a strong discontinuity or fault contact with the third unit with a density of 2.53 g/cm3, that can be related with the main trace of the SMF that include conglomeratic sandstone of the Las Palomas beds and Paleozoic flysch. To the north of main fault exists another fault or discontinuity that separates the fourth and fifth units that have density values of 2.28 g/cm3 and 2.4 g/cm3 respectively.
6. Discussion
The Palomas area shows a clear evidence of the SMF documented by McKee et al., (1990) and Chávez-Cabello et al., (2007), in the Sierra El Granizo and La Pasta hill in SMV it is inferred because there are not geologic evidence of activity; in the Palomas area exist a isolate hills that can be associated with superficial expression of the SMF.
Gravity profiles ware carried out perpendicular to the main trace of the SMF in the SMV. The Bouguer anomaly shows maximum and minimum which can be used to define a system of fractures with a direction that can be correlated to the principal trending of the SMF in the Sierra El Granizo and San Marcos y Pinos that have a NW-SE direction [14,19]; also, orthogonal faults were identified, this can be associated with the change of direction in the main trace of the SMF or the fault bend zone in the SMF.
From gravity 2D models, we observed that there are contrasts of density in both models that are associated with displacement of the SMF. The model A-A’ (Figure 8) shows how the limestone are in discontinuity with the flysch and can be associated with the main traced of the SMF in this area where the fault had been inferred, in agreement with geological data [14,19] the fracture constrained with gravity data can be associate with the reverse reactivation of the SMF. On the other hand the Quaternary sediments could be cutting by recent activity of the SMF, this gravity study is the first geophysical study in the area that contemplate the mapping and found evidence if the SMF had had Quaternary activity such as suggested by Aranda-Gómez et al., (2005) in Chihuahua state, and its relation with seismic risk in northeast of Mexico.
The model B-B’ (Figure 9) shows some discontinueties that constrain a fault system related with the main fault. This model is similar to the McKee et al. (1990) geological cross-section from Sierra El Granizo-Sierra San Marcos y Pinos (profile C-C’, Figure 2). Figure 8 shows the correlation between the gravity cross-section obtained in this study and the geological model by McKee et al. (1990). In the southern part of the gravity model there is a discontinuity between the second and third units that can be correlated with the SMF where the density values for de second unit (2.3 g/cm3) could be associate with limestone of Upper Tamaulipas which is in reverse fault contact with the third unit, composed by a mixture of Paleozoic flysch and conglomeratic sandstone of the Las Palomas beds.
A second discontinuity north of the La Pasta hill involves a reverse fault with the third and fourth units, and correlate the Paleozoic flysch (unit fourth) and the shear zone composed by Las Palomas beds and the Paleozoic flysch [14,19].
A third discontinuity is formed by the fourth and fifth units, where the Paleozoic flysch (forth unit) is in reverse fault contact with an unknown material with a density value of 2.4 g/cm3 (fifth unit). Finally, both profiles A-A’ and B-B’ have a fault that is in direct contact with Quaternary sediments (first unit) of the SMV and this sediments could be cross-cut by this fault.
7. Conclusions
This is the first study to detect a buried basement fault in the Palomas area; we used a precision gravity data to find density contrasts of rocks to map fractures or faults. We choose the Palomas area in the SMV because is around by Sierra El Granizo and Sierra San Marcos y Pinos in central Coahuila, where had been found clear geological evidence (stratigraphic and structural) of the San Marcos Fault.
Results of this study show that the Free Air and Residual Bouguer anomalies are separating two blocks related with the San Marcos Fault. By other hand, the Bouguer anomaly is dominated by a series of faults or a fault zone that is interconnected by a principal fault, this zone has a width around of 1000 m. This fault system can be separated by a trending fault with a NNW-SSE direction that is correlated with the strike of the San Marcos Fault identified in the foothills of Sierra El Granizo; the other faults system is conjugate to the main system and is related to the change of direction of the principal fault orientation proposed by some authors.
We presents two 2D gravity models where can define the San Marcos Fault, in the first profile (A-A’) only can identify one discontinuity that is related with the princepal fault in agreement with geological data suggest the presence of a reverse fault. The second model (B-B’) constrain a wide fault zone, this model can be compared with the geological cross-section published by McKee et al. (1990). This model show a fault zone where the limestone are outcropped (La Pasta hill), these rocks have a density value of 2.3 g/cm3.
In both models, we can see that the Quaternary sediments are in direct contact with the fault; however, it is not enough evidence how this fault is cutting the Quaternary sediments. Other geophysical data (e.g., resistivity, magnetic and seismic methods) can be collected in this area to define if the San-Marcos Fault is cutting the Quaternary sediments.
8. Acknowledgements
This work was supported by the CONACYT Project 129550 “Evolución terciaria de cuencas continentales del norte de México: controles tectónicos heredados, pulsos de deformación, magmatismo y registro bioestratigráfico”.
REFERENCES
- W. J. Hinze, C. Aiken, J. Brozena, B. Coakley, D. Dater, G. Flanaga, R. Forsberg, T. Hildenbrand, G. R. Keller, J. Kellogg, R. Kucks, X. Li, A. Mainville, R. Morin, M. Pilkington, D. Plouff, D. Ravat, D. Roman, J. Urrutia-Facugauchi, M. Véronneau, M. Webring and D. Winester, “New Standards for Reducing Gravity Data: The North American Gravity Database,” Geophysics, Vol. 70, No. 4, 2005, pp. J25-J32.
- C. Jorgensen, “Tectonic Interpretation Using Potential Field Data for the Sweetgrass Arch Area, Montana-Alberta, Saskatchewan. Rocky Mountain Section,” AAPG Meeting, Denver, 9-11 August 2004.
- H. Lyatsky, D. P. Reg Olson and L. Godwin, “Detection of Subtle Basement Faults with Gravity and Magnetic Data in the Alberta Basin,” The Leading Edge, Vol. 24, No. 12, 2005, p. 1282.
- H. Lyatsky, D. P. R. Olson and L. Godwin, “Mapping of Basement Faults with Gravity and Magnetic Data in Northern Alberta,” 2005, 12 pages. http://www.cspg.org/documents/Conventions/Archives/Annual/035S0119.pdf
- P. V. Sharma, “Environmental and Engineering Geophysics,” Cambridge University Press, Cambridge, 2004.
- A. T. Ponce, V. Yutsis, E. R. H. Flores, A. A. Bulychev and K. Krivosheya, “Tectonic Features of La Popa Basin and Adjacent Areas in the NE Mexico Received with the Geophysical Potential Fields,” Bulletin of the Mexican Geological Society, Vol. 63, No. 2, 2011, pp. 271-283.
- V. V. Yutsis, U. Jenchen, H. de León-Gómez, F. Izaguirre Valdez and K. Krivosheya, “Paleogeographic Development of the Surroundings of Cerro Prieto Water Reservoir, Pablillo Basin, NE Mexico, and Geophysical Modeling of the Reservoir’s Subsurface,” Neues Jahrbuch für Geologie und Paläontologie, Vol. 253, No. 1, 2009, pp. 41-59. doi:10.1127/0077-7749/2009/0253-0041
- V. Yutsis, A. T. Ponce and K. Krivosheya, “Geophysical Modeling of the Surroundings of La Popa Basin, NE Mexico, with Gravity and Magnetic Data,” In: E. V. Sharkov, Ed., New Frontiers in Tectonic Research—General Problems, Sedimentary Basins and Island Arcs, InTech Publishing, Rijeka, 2011, pp. 125-142. doi.org/10.5772/18760
- M. Talwani, J. L. Worzel and M. Landisman, “Rapid Gravity Computations for Two-Dimensional Bodies with Application to the Mendocino Submarine Fracture Zone,” Journal of Geophysical Research, Vol. 64, No. 1, 1959, pp. 49-59. doi:10.1029/JZ064i001p00049
- W. M. Telford, L. P. Geldart and R. E. Sheriff, “Applied Geophysics,” Cambridge University Press, Cambridge, 1990. doi:10.1017/CBO9781139167932
- R. P. Y. Sánchez, “Post-Paleozoic Tectonics of Northeast Mexico and Its Role in the Evolution of the Gulf of Mexico,” Geofísica Internacional, Vol. 25, 1986, pp. 157-206.
- S. Charleston, “Stratigraphy, Tectonics and Hydrocarbon Potential of the Lower Cretaceous, Coahuila Series, Coahuila, Mexico,” Ph.D. Thesis, University of Michigan, Michigan, 1974.
- S. Charleston, “A Summary of the Structural Geology and Tectonics of the State of Coahuila, Mexico,” In: C. I. Schmidt and S. B. Katz, Eds., Lower Cretaceous Stratigraphy and Structure, Northern Mexico, Field Trip Guidebook, West Texas Geological Society, Midland, 1981.
- H. V. Lyatsky, D. I. Pana and M. Grobe, “Basement Structure in Central and Southern Alberta: Insights from Gravity and Magnetic Maps,” EUB/AGS Special Report, Vol. 72, 2005, pp. 1-83.
- J. W. McKee, N. W. Jones and L. E. Long, “Stratigraphy and Provenance of Strata along the San Marcos Fault, Central Coahuila, Mexico,” Geological Society of America Bulletin, Vol. 102, No. 5, 1990, pp. 593-614. doi:10.1130/0016-7606(1990)102<0593:SAPOSA>2.3.CO;2
- T. H. Anderson and V. A. Schmidt, “The Evolution of Middle America and the Gulf of Mexico-Caribbean Sea Region during Mesozoic Time,” Geological Society of America Bulletin, Vol. 94, No. 8, 1983, pp. 941-966. doi:10.1130/0016-7606(1983)94<941:TEOMAA>2.0.CO;2
- I. R. A. Gutiérrez, “Paleomagnetismo de Rocas Jurásicas y Cretácicas del Valle San Marcos, Coahuila, México,” Master Thesis, Universidad Nacional Autonoma de Mexico, Querétaro, 2006.
- G. Chávez-Cabello, J. J. Aranda-Gómez, R. S. MolinaGarza, T. Cossío-Torres, L. R. Arvizu-Gutiérrez and G. A. González-Naranjo, “The San Marcos Fault: A Jurassic Multireactived Basement Structure in Northeastern México,” Geology of México: Celebrating the Centenary of the Geological Society of México, Vol. 422, 2007, pp. 261- 286.
- G. C. Cabello, “Deformación y Magmatismo de la Cuenca de Sabinas, Coahuila, México,” Ph.D. Thesis, Universidad Nacional Autonoma de Mexico, Centro de Geociencias, 2005.
- G. Chávez-Cabello, J. J. Aranda-Gómez, R. Molina-Garza, T. Cossío-Torres, I. R. Arvizu-Gutiérrez and y G. González-Naranjo, “The San Marcos Fault: A Jurassic Structure of Multi-Reactivated Basement of the NorthEast of Mexico,” In: S. A. Alaniz-Álvarez and A. F. NietoSamaniego, Eds., Bulletin of the Mexican Geological Society, Commemorative Volume of the Centenary Big Tectonic Frontiers of Mexico, Vol. LVII, No. 1, 2005, pp. 27-52.
- W. R. Muehlberger, R. C. Belcher and L. K. Goetz, “Quarternary Faulting in Trans-Pecos Texas,” Geology, Vol. 6, No. 6, 1978, pp. 337-340. doi:10.1130/0091-7613(1978)6<337:QFITT>2.0.CO;2
- J. J. Aranda-Gómez, J. F. Luhr, T. G. Housh, G. ValdezMoreno and G. Chávez-Cabello, “Late Cenozoic Intraplate-Type Volcanism in Central and Northern México: A Review,” Geology of México: Celebrating the Centenary of the Geological Society of México, Vol. 422, 2007, pp. 93-128.
- J. J. Aranda-Gómez, J. F. Lhur, C. D. Henry, T. Becker and G. Chávez-Cabello, “Reactivation of the San Marcos Fault during Midto Late Tertiary Extension, Chihuahua, Mexico,” In: T. H. Anderson, J. A. Nourse, J. W. McKee and M. B. Steiner, Eds., The Mojave-Sonora Megashear Hypothesis: Development, Assessment, and Alternatives, Geological Society of America, Special Paper 393, 2005, pp. 481-521.
- J. Aranda-Gómez, J. Luhr, T. Housh, C. Cannor, T. Becker and C. Henry, “Synextensional Pliocene-Pleistocene Eruptive Activity in the Camargo Volcanic Field, Chihuahua, México,” Geological Society of America Bulletin, Vol. 115, No. 3, 2003, pp. 298-313.
- J. W. McKee, N. W. Jones and L. E. Long, “History of Recurrent Activity along a Major Fault in Northeastern Mexico,” Geology, Vol. 12 , No. 2, 1984, pp. 103-107. doi:10.1130/0091-7613(1984)12<103:HORAAA>2.0.CO;2
- R. S. Molina-Garza, I. R. Arvizu-Gutiérrez and y G. Chávez-Cabello, “Paleomagnetism of the Palomas Formation (Jurassic) and of the Permian-Triassic Granites in South Coahuila: Tectonic Implications,” GEOS, Vol. 23, 2003, p. 112.
- A. J. Crone, P. M. De Martini, M. N. Machette, K. Okumura and J. Prescott, “Paleoseismicity of Two Historically Quiescent Faults in Australia: Implications for Fault Behavior in Stable Continental Regions,” Bulletin of the Seismological Society of America, Vol. 93, No. 5, 2003, pp. 1913-1934. doi:10.1785/0120000094
- D. Doser, “The 16 August 1931 Valentine, Texas, Earthquake: Evidence for Normal Faulting in West Texas,” Bulletin of the Seismological Society of America, Vol. 77, No. 6, 1987, pp. 2005-2017.
- D. Doser and J. Rodriguez, “The Seismicity of Chihuahua, Mexico, and the 1928 Parral Earthquake,” Physics of the Earth and Planetary Interiors, Vol. 78, No. 1-2, 1993, pp. 97-104. doi:10.1016/0031-9201(93)90086-O
- I. N. Galván-Ramírez and J. C. Montalvo-Arrieta, “The Historical Seismicity and Prediction of Ground Motion in Northeast Mexico,” Journal of South American Earth Sciences, Vol. 25, 2008, pp. 37-48. doi:10.1016/j.jsames.2007.07.004
- R. K. Goldhammer, “Mesozoic Sequence Stratigraphy and Paleogeographic Evolution of Northeast Mexico,” Geological Society of America, Special Paper 340, 1999.
- T. Harding, “Seismic Characteristics and Identification of Negative Flower Strctures, Positive Flower Strctures, and Positive Structural Inversion,” Bulletin of the American Association of Petroleoum Geologists, Vol. 69, No. 4, 1985, pp. 582-600.
- L. L. Nettleton, “Determination of Density for Reduction of Gravimeter Observations,” Geophysics, Vol. 4, No. 3, 1939, pp. 176-183.
- L. L. Nettleton, “Elementary Gravity and Magnetics for Geologists and Seismologists,” Society of Exploration Geophysicists, Geophysical Monograph Series No. 1, 1971.