Modern Economy
Vol. 3 No. 1 (2012) , Article ID: 16799 , 4 pages DOI:10.4236/me.2012.31017
Economic Interdependence: Evidence from China and ASEAN-5 Countries
Department of Economics, Faculty of Economics and Business, Universiti Malaysia Sarawak, Sarawak, Malaysia
Email: aarunnan@yahoo.com
Received August 18, 2011; revised October 12, 2011; accepted November 12, 2011
Keywords: Granger Non-Causality Tests; Business Cycles; Time-Series; Economic Integration
ABSTRACT
This study aimed to examine the interdependence relationship among five Association of Southeast Asian Nations (ASEAN-5) countries (Indonesia, Malaysia, the Philippines, Singapore, and Thailand) and China from a business cycles perspective. The Granger non-causality test proposed by [1] was used to examine causal linkages in business cycles. The empirical results indicated common business cycles between China and ASEAN-5 economies. This suggested that China and ASEAN-5 share similar business cycles and could complement each other in the long run. A discussion of important insights for regional economic policy coordination in which similar business cycles provide a platform for common regional trade, as well as suggestions for monetary policies, conclude the paper.
1. Introduction
Since the seminal work by [2], a growing number of studies have investigated international interdependence involving various countries, including the Association of Southeast Asian Nations (ASEAN) region [3-11]. Nonetheless, little work has examined international interdependence between China-ASEAN business cycles. This relationship carries importance because of the recent establishment of the China-ASEAN Free Trade Area (CAFTA), which suggests that business cycle fluctuations may have been regularly transmitted between China and ASEAN countries.
Moreover, this study revealed the impact of economic fluctuations of a specific country on other neighboring economies. If expansion or recession in one economy is transmitted to another, they experience similar economic fluctuations [12]. This implies the need for a mutual policy to enhance economic benefits and avoid adverse shocks [6]. From this standpoint, the issue is whether there is any evidence of the impact of economic fluctuations between China and ASEAN countries. Therefore, this study intends to examine the interdependency of ASEAN-5 countries with China and to contribute to the literature with research conducted from a business cycles perspective.
To accomplish this, we extracted the business cycles series from the statistics of annual current gross domestic product (GDP) from 1967 to 2008 using the HodrickPrescott (HP) filter [13] and we re-sorted the time series econometrics methodology of simple correlation, Augmented Dickey-Fuller (ADF) unit root test [14], and the Granger non-causality test proposed by [1]. The following section contains a review of related literature; this is followed by discussion of empirical testing procedures and data, as well as a brief explanation of our findings. Finally, the researchers provide conclusions and suggest policy implications.
2. Brief Review
The studies on international interdependence with the application of causality tests found in [2], who investigated the relationship between gross national product (GNP) and GDP ratio of Japan and Australia using F-tests causality, concluded that both countries are fairly interdependent in macroeconomics terms. Reference [3] used vector error correction mechanism (VECM) based of causality test to study the causal patterns of US and Japan as reflected in the index of industrial production (IIP) and found two-way causality between the two economies. Another study by [4] investigated the interdependency of ASEAN countries with the US, Australia, Japan, and the European Union (EU) by using annual real GDP growth rates. The findings documented that the ASEAN countries are not strongly interdependent with their partner countries.
Reference [6] examined business cycles transmission among Germany, Japan, the UK, and the US using the IIP data and the Granger non-causality test proposed by [1]. The findings revealed a weak causal relationship which indicated that the economies move independently. Reference [7] studied interdependence between Turkey and the EU. They used structural vector auto regressions (SVARs) model to examine the causal interplays of real GDP between Turkey and the EU and found that Turkey’s GDP is only modestly influenced by the EU’s GDP. Reference [5] investigated the interdependence relationships between the IIP data of Korea and Japan using SVARs and found that Japan’s business cycles have a moderate effect on fluctuations in Korea’s, and this tendency is rising gradually.
Reference [8] examined the output linkages of Latin American countries with the US and Europe using the vector auto regression (VAR) model. They found reasonable evidence of US and European business cycle transmission among the Latin American economies. Reference [9] investigated the causal linkages of GDP among ASEAN-5 countries. They reported two-way causality among ASEAN-5 economies and suggested that economic shocks can be easily transmitted from one to the other, and vice versa. In another study, [10] tested timevarying convergence using cointegration on the real GDP of ASEAN-5 countries and concluded that it was unable to reveal changes in the degree of cointegration over time.
In short, there is scant research on China-ASEAN business cycles linkages. Little exception to this is a study by [11]. They tested the causality proposed by [1] between the real GDP of China and ASEAN-5 countries. They concluded that there is strong interdependence of income between China and ASEAN-5 economies. Besides, we had some doubts about previous studies that utilizing the F-test in causality examination; there might be inadequacy in terms of F-test usages in testing the causality. F-test could be invalid when there is I(1) or more [15].
Reference [16] suggested that the procedure developed by [1] avoids such problem through modified Wald (MWald) tests for restrictions on the parameters of a VAR (k). Furthermore, the simplicity of the modeling technique [17] is valuable and the technique does not require pretesting for unit root and cointegration. Therefore, this study contributes to the empirical literature on the China and ASEAN region by determining the direction of business cycles causal relationships through the use of powerful econometrics technique developed by [1].
3. Data and Methodology
This study employed time series annual data covering 1967 to 2007 for six Asian countries. The data on current GDP were obtained from the [18]. All the GDP data are expressed in billions of US dollars (USD). Since the business cycle is unobserved, we employed the HP filter [15] to extract business cycle indicators from GDP. In justifying proof of causal relationships, the augmented VAR procedure proposed by [1] was employed. Since the VAR procedure involves the order of integration, unit root analysis was conducted for the countries under study. The Granger non-causality test was carried out using (k + dmax) lag length in which k is the optimum lag order of VAR formulated in levels and dmax is the maximum order of integration suspected to occur in the system. For example, we can predict the VAR (3) model for business cycles causality for ASEAN-5 plus China by assuming k = 2 and dmax = 1 as follows:
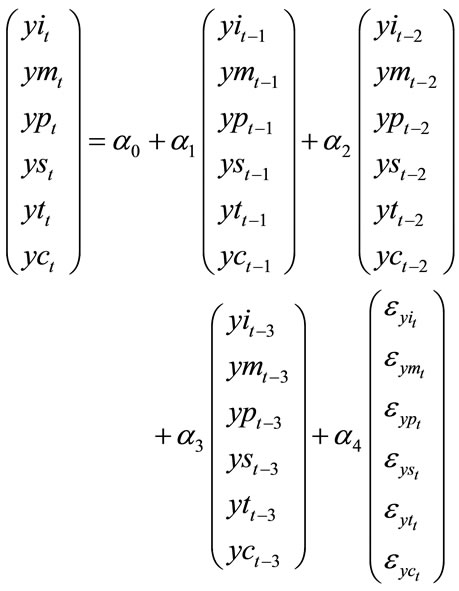 (1)
(1)
· yit: Business cycle of Indonesia at time t;
· ymt: Business cycle of Malaysia at time t;
· ypt: Business cycle of the Philippines at time t;
· yst: Business cycle of Singapore at time t;
· ytt: Business cycle of Thailand at time t;
· yct: Business cycle of China at time t;
· εt: error term at time t;
and a1, a2, a3, and a4 are 4 × 4 matrices of coefficient and a0 is an identity matrix. To test the hypothesis of Granger non-causality from the business cycles of ymt to business cycles yit, we tested:
H0:  i = 1, 2
 nth (2)
where  are coefficients of ymt–1 and ymt–2 in the first equation of the system stated above. Causality from ymt to yit can be established via rejecting the above null hypothesis, which necessitates finding the significance of the MWald test statistic for the group of the lagged independent variables documented above. On the other hand, the same testing procedure can be used for the alternative hypothesis of Granger non-causality from yit to ymt by testing:
H0: 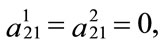 i = 1, 2
 nth (3)
where  are the coefficients of yit–1 and yit–2 in the second equation of the system.
4. Empirical Results and Discussion
This study began with a simple correlation analysis on business cycles of ASEAN-5 countries and China. Table 1 presents the correlation coefficients of the bilateral cycle combination for ASEAN-5 countries. Throughout the correlation analysis, we found a positive relationship among ASEAN-5 business cycles as well as between China’s and ASEAN-5 business cycles.
Although some coefficients appeared to be weak, China’s business cycles confirmed the presence of a relationship with ASEAN-5 business cycles. While the coefficients were statistically positive, this did not mean that tested countries’ cycles were interdependent. Thus, to rationalize interdependence relationships, we employed causality tests. Prior to that, we carried out ADF unit root tests to obtain the maximum order of integration (dmax). The ADF unit root test showed that the business cycles series for ASEAN-5 countries and China were all stationary at level form (see Table 2), indicating that dmax = 0. We pursued our analysis to the following stage to obtain the optimum lag length (k).
The VAR (r) can be determined by adding both criteria (k + dmax). Since [19] argued that Akaike information criterion (AIC) works better in small samples than the Schwartz information criterion (SIC), we followed AIC for the selection of optimum lag length (k).
Table 3 shows that the optimal lag length is 4 (k = 4) for ASEAN-5 countries plus China model. Thus, the VAR (4) model (r = 4) was used in the estimation since the order of integration was 0 (dmax = 0) and the selection of optimum lag length by AIC was 4 (k = 4).
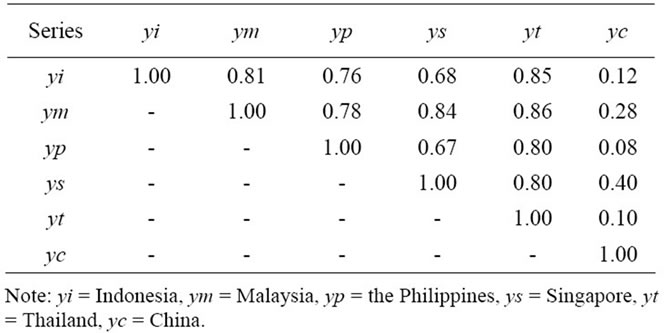
Table 1. Business cycles correlation.
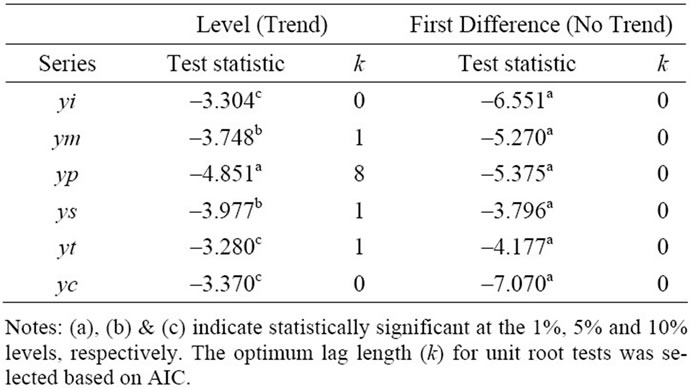
Table 2. ADF unit root test results.
Table 4 shows the Toda-Yamamoto causality tests results among the business cycles of the countries under study. Empirical results indicated that there is a causal interplay between business cycles of China and the ASEAN- 5 countries. In particular, we can reject the null hypothesis of Granger non-causality at 1% level for business cycle running from China to business cycles of Indonesia, Malaysia, the Philippines Singapore and Thailand. On the other hand, some of the ASEAN-5 countries’ business cycles did appear to Granger cause the business cycles of China. For example, the MWald test statistic was significant at 1% level for the case of business cycle running from Singapore to China. Moreover, the results also indicated that business cycles of Indonesia and the Philippines could Granger-cause business cycles of China at 5% and 10% levels, respectively.
5. Conclusions and Policy Implication
This study has highlighted the interdependence relationships among China-ASEAN countries from a business cycles standpoint. The major findings of our study are two-fold: First, a simple correlation analysis proved the presence of a positive relationship between China business cycles with ASEAN-5 business cycles and indicated that common shocks affect these countries. Second, despite the correlation analysis, the VAR results indicated that there are three sets of bidirectional and two sets of unidirectional business cycles causality among ASEAN- 5 countries and China. Bidirectional business cycles causality has been seen in the business cycle of China with the business cycles of Indonesia, the Philippines and Singapore. On the other hand, unidirectional causal interplays occur from the business cycle of China toward the business cycles of Malaysia and Thailand (see Figure 1).

Table 3. Selection of lag length based on AIC.
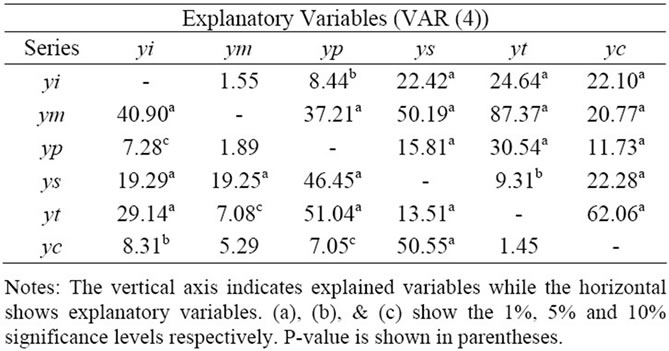
Table 4. Toda-Yamamoto causality tests results.
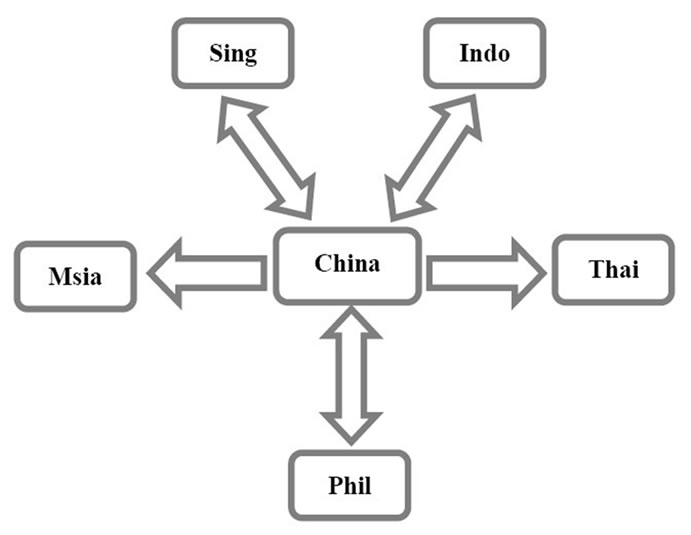
Figure 1. Summary of causal linkages.
Empirical findings from this study revealed evidence of interdependency of business cycle among ASEAN-5 countries and China. Hence, we concluded that it may exist a common business cycle between China and ASEAN- 5 economies. This conclusion implies that China and ASEAN-5 countries may have similar economic structures to some extent, and hence, these economies may have smaller variations in economic fluctuations, including exchange rates and other macroeconomic fundamentals, which assure that they can complement each other in the long run. Thus, this study provides important insights for regional economic policy coordination in which similar business cycles provide a platform for common regional trade as well as monetary policies. With these findings, future study is deemed necessary to support evidence for a currency union arrangement in ChinaASEAN region, with an underpinning of the theory of optimum currency area (OCA).
REFERENCES
- H. Y. Toda and T. Yamamoto, “Statistical Inference in Vector Autoregressive with Possibly Integrated Processes,” Journal of Econometrics, Vol. 66, No. 1-2, 1995, pp. 225-250. doi:10.1016/0304-4076(94)01616-8
- D. D. Selover and D. K. Round, “Business Cycle Transmission and Interdependence between Japan and Australia,” Journal of Asian Economics, Vol. 7, No. 3, 1996, pp. 569-602. doi:10.1016/S1049-0078(96)90057-3
- D. D. Selover, “Business Cycle Transmission between the United States and Japan: A Vector Error Correction Approach,” Japan and the World Economy, Vol. 9, No.3 1997, pp. 385-411. doi:10.1016/S0922-1425(96)00241-1
- D. D. Selover, “International Interdependence and Business Cycle Transmission in ASEAN,” Journal of Japanese and International Economies, Vol. 13, No. 3, 1999, pp. 230-253.doi:10.1006/jjie.1999.0436
- D. D. Selover, “International Co-Movements and Business Cycle Transmission between Korea and Japan,” Journal of Japan and International Economies, Vol. 18, No. 1, 2004, pp. 57-83. doi:10.1016/S0889-1583(03)00025-X
- S. Hamori, “The Transmission Mechanism Of Business Cycles Among Germany, Japan, the UK and the USA,” Applied Economics, Vol. 32, No. 4, 2000, pp. 405-410. doi:10.1080/000368400322589
- S. Sayek and D. D. Selover, “International Interdependence and Business Cycle Transmission between Turkey and the European Union,” Southern Economic Journal, Vol. 69, No. 2, 2002, pp. 206-238. doi:10.2307/1061670
- T. Bezmen and D. D. Selover, “Patterns of Economic Interdependence in Latin America,” The International Trade Journal, Vol. 19, No. 3, 2005, pp. 217-267. doi:10.1080/08853900591007339
- H. B. Ong, C. H. Puah and M. S. Habibullah, “Interdependence of ASEAN Business Cycles,” Frontiers in Finance and Economics, Vol. 3, No. 1, 2006, pp. 69-78.
- H. B. Ong and M. S. Habibullah, “The ASEAN-5 Economic Alliance: A Time Varying Convergence Analysis,” International Research Journal of Finance and Economics, Vol. 8, 2007, pp. 97-106.
- E. Lau and K. P. Lee, “Interdependence of Income between China and ASEAN-5 Countries,” Journal of Chinese Economic and Foreign Trade Studies, Vol. 1, No. 2, 2008, pp. 148-161. doi:10.1108/17544400810884718
- The Economist, “United We Fall,” 2002. http://www.economist.com/node/1336091
- R. J. Hodrick and E. C. Prescott, “Post-War U.S. Business Cycles: An Empirical Investigation,” Discussion Paper, Carnegie Mellon University, Pittsburgh, 1980.
- D. A. Dickey and W. A. Fuller, “Distribution of the Estimators for Autoregressive Time Series with a Unit Root,” Journal of the American Statistical Association, Vol. 74, No. 366, 1979, pp. 427-431. doi:10.2307/2286348
- D. N. Gujarati, “Basic Econometrics,” 3rd Edition, McGrawHill, New York, 1995.
- H. O. Zapata and A. N. Rambaldi, “Monte Carlo Evidence on Cointegration and Causation,” Oxford Bulletin of Economics and Statistics, Vol. 59, No. 2, 1997, pp. 285-298. doi:10.1111/1468-0084.00065
- A. Rambaldi and H. Doran, “Testing for Granger NonCausality in Cointegrated Systems,” Working Papers in Econometrics and Applied Statistics, Vol. 88, University of New England, Biddeford, 1996.
- World Bank, “World Development Indicators (WDI),” Various Issues, Washington DC, 2008.
- W. Enders, “Applied Econometric Time Series,” Wiley, Hoboken, 2003.