Advances in Chemical Engineering and Science
Vol. 2 No. 1 (2012) , Article ID: 16706 , 14 pages DOI:10.4236/aces.2012.21017
Parametric Sensitivity Studies in a Commercial FCC Unit
1University of Petroleum & Energy Studies, Dehradun, India
2University of Saskatchewan, Saskatoon, Canada
3Indian Oil Corporation Ltd., Research & Development Centre, Faridabad, India
Email: *ajay.dalai@usask.ca
Received August 16, 2011; revised September 13, 2011; accepted October 18, 2011
Keywords: Fluid Catalytic Cracking; Parametric Sensitivity Analysis; Kinetic Modeling of FCC Riser/Reactor; Regenerator Modeling
ABSTRACT
A steady state model was developed for simulating the performance of an industrial fluid catalytic cracking (FCC) unit which was subsequently used in parametric sensitivity studies. The simulator includes kinetic models for the riser reactor and the regeneration systems. Mass and energy balances were performed for each of these sections and simulation results were compared with the plant data available in the literature. Model predictions were found to be in close agreement with the reported data. Finally this validated model was used for studying the effects of independent variables such as feed preheat temperature (Tfeed) and feed flow rate (Ffeed) on the unit performance at either fixed regenerated catalyst temp/regenerator temp (Trgn) or constant reactor outlet temperature (ROT). The catalyst circulation rate (CCR) was automatically adjusted to keep the ROT constant with varying the independent variables feed preheat temperature while the air rate adjusted for keeping the regenerator temperature constant which consequences the dependency of both dependent and independent variables on the unit performance. The air flow rate to the regenerator was also an independent variable during the parametric sensitivity analysis and its effect on FCC performance was investigated at constant Tfeed, Ffeed and CCR. Combining all the sensitivity analysis, it has been found to increase gas oil conversion and product yields by 5 to 6 percent with decrease of say, 10 K, in the feed preheat temperature (Tfeed) and corresponding increase in air rate (Fair) and catalyst circulation rate (Frgc) at constant reactor outlet temperature (ROT) and regenerated catalyst temperature (Trgc).
1. Introduction
Fluid Catalytic Cracking (FCC) is one of the most efficient secondary processes to increase gross refinery margin (GRM) and hence increase profitability as it converts lowpriced heavy feedstock into lighter, more valuable hydrocarbons such as liquefied petroleum gas (LPG) and gasoline at high temperature and moderate pressure in presence of a finely divided silica/alumina based catalyst. One of the important advantages of fluid catalytic cracking is the ability of the catalyst to flow easily between the reactor and regenerator when fluidized with appropriate vapor phases. Due to this fluidization of the catalyst, there is intimate interaction between the catalyst and hydrocarbons leading to more cracking reactions. The conversion and yield pattern strongly depend on the feedstock quality, operating conditions of the riser reactor-regenerator sections and the type of catalyst. These complex interactions coupled with economic importance of the unit have prompted many researchers to put their efforts on the modeling of this unit for better understanding and improved productivity.
The complexity of the gas oil composition which cosists of a very large number of components makes it extremely difficult to characterize these components individually and their kinetics at molecular level. Therefore, the complex reactions occurring in the process are generally described by grouping a large number of compnents known as kinetic lumps and defining the reaction network in terms of these lumps. So far, only a limited number of lumps have been considered by researchers to describe the feed as well as the products. Many kinetic models have been developed using 2 - 6, 8, 10, and 12 lump schemes.
Weekman and Nace [1] developed a first kinetic scheme of catalytic cracking and considered only two lumps; feed and products, which accounted for conversion and gasoline yield in isothermal fixed, moving, and fluid bed reactors. Weekman [2] again developed a model to describe the feed and product yield distribution in terms of three lumped components: the gas oil, the gasoline and the remaining C4s, dry gas and coke. This model was used to study the effect of reaction time on the products, which showed that the time averaged gasoline yield is always less than the instantaneous gasoline yield because of the smoothing effect of time averaging. Lee et al. [3] proposed a 4 lump kinetic model using coke as a separate lump and estimated the kinetic parameters by using the experimental data from literature [4]. The main advantage of this model is its ability to predict coke production. This four lump model was used for the development of correlations and carry out different parametric studies on various aspects of FCC modeling [5-9]. Five lump kinetic models developed by Ancheyta et al. [10] and Bollas et al. [11] included 7 and 9 rate constants respectively. The advantage of these models is their ability to predict liquefied petroleum gas (LPG) and dry gas yield separately from the other lumps. Ancheyta et al. [12,13] estimated the reaction parameters in the models by using 3 - 5 lump kinetic scheme and developed some correlations for predicting the effect of feedstock properties on catalytic kinetic parameters. These correlations gave good predictions of gasoline and gas plus coke yields. An integrated reactor-regenerator model, using five kinetic lumps with 9 cracking reactions in the riser reactor has been investigated by Dave and Saraf [14]. A selective deactivation kinetic model is more accurate and realistic than the non-selective model, which has been studied by Corella [15].
In all the 2 - 5 lump models, the feed has been characterized in terms of a single kinetic lump. In more detailed kinetic models, the feed is characterized by several hydrocarbon groups with different lumping schemes. These detailed ten or twelve lump models characterize the feed in terms of 4 different heavy hydrocarbon groups such as paraffins, naphthenes, aromatics and carbon atom substituted aromatic rings [16-19]
Gupta et al. [20,21] developed a new detailed kinetic model based on pseudocomponents and also included a 3-phase, one dimensional heat transfer model for the riser reactor. The kinetic parameters were estimated by a semi-empirical approach based on normal probability distribution. A mathematical model was also developed by Arandes et al. [22] which is useful for predicting the behavior of FCC units both under steady and unsteady conditions. Wei et al. [23] and Wu et al. [24] developed kinetic reactor models using different lumping schemes for both riser and downer in fluid catalytic cracking process. Berry et al. [25] developed a two dimensional hydrodynamic model and coupled it with the four kinetic lump model for the reactor. A four lump kinetic model is also used by Baudrez et al. [26] for decoupled solution method to predict the reactive flow and effect of the reactions on the flow. The proposed method is applied to the steady-state, two-phase gas-solid simulation of a Fluid Catalytic Cracking riser reactor. Zhou et al. [27] developed a kinetic model considering reactant oriented selective deactivation for secondary reactions of FCC gasoline because catalyst deactivation is an important function on FCC performance that affects the secondary reaction on FCC gasoline. This validated model is capable of accurately predicting product distribution for secondary reactions of FCC gasoline over a wide range of operating conditions. Recently, a new approach based on transition state theory has been developed by Lee et al. [28] for kinetic modeling of both thermal and catalytic cracking mechanisms of paraffinic naphtha in the circulating fluidized bed.
A four or five lump kinetic scheme seems satisfactory and reasonable to represent the kinetics of gas oil cracking. One may be tempted to pick a more detailed 10 or 12 lump model but its implementation will require a detailed laboratory analysis of the feed in terms of light and heavy paraffins, naphthenes, aromatics etc., a serious practical limitation indeed.
The effects of sensitive parameters have an important role on the FCC performance. A complete reactor regenerator model is most versatile to understand the sensitivity of individual component on the process, which is not been studied in the existing steady state FCC models. To study the sensitivity analysis of each component on the heat balanced FCC model has been simulated from Dave and Saraf [14] with the modified catalyst deactivation function [16] in the present work.
In this paper, a five lump reaction scheme is used to represent the kinetics of gas oil cracking with two (dense and dilute) phase regenerator model. The objectives are to simulate a continuous reactor-regenerator plant which can be used to predict cracking reaction temperature, feed conversion, product yields, regenerator temperature and amount of deposited coke on the spent catalyst and regenerated catalyst. The product yields are assumed to be a function of reaction temperature, and the coke yield plays an important role in the strong interactions between the riser reactor and the regenerator. Any change in the coke yield in the riser affecting the concentration of coke on spent catalyst, for example due to the change in catalyst circulation rate or a feed composition change, results in changes in the rates of the combustion reactions occurring in the regenerator. These affect regenerator temperature and thus regenerated catalyst temperature. This will again affect the product yields and coke yield in the regenerator, thus indicating the existence of strong interaction between riser reactor and regenerator. The steady state simulation of the FCC unit including both the riser reactor and the regenerator is useful for studying the effect of various operating parameters on the performance of this unit. In the present study riser reactor model is validated by comparing its output with the plant data reported in literature [14]. Regenerator flue gas compositions are also calculated at the exit of both dense and dilute beds. This validated combined model is then used to study the effect of feed preheat temperature on the process by keeping the riser outlet temperature constant. The catalyst circulation rate increases with decreasing the feed preheat temperature to reach the target value of riser outlet temperature. The effect of change in feed flow rate and air flow rate on FCC performance was also examined.
As the FCC is most completed process to understand the effect of each parameter on its performance, the sensitivity analysis may help the refiners to understand the effects of individual parameters to improve the profitability of the process.
2. Reactor Model
Figure 1 shows a schematic of a modern FCC [29] , in which liquid feed enters at the bottom of riser reactor through feed nozzle system with optimum atomization of feed [7]. The liquid feed droplets come in direct contact with hot catalyst particles from the regenerator and are vaporized. These vapors along with catalyst particles move upwards along the riser height and at the same time vapor feed also starts cracking. The cracking reactions taking place in the riser are endothermic. The catalytic reactions occur in vapor phase. The rate of vaporization of feed in the entry zone of the riser reactor affects the cracking performance of the feed to a great extent. The cracking reaction terminates in the riser reactor because of the deactivation of the catalyst due to coke deposition on the catalyst surface as well as the short contact time between catalyst and vapor hydrocarbons in the riser reactor. The expanding volumes of vapors that are generated are the main driving force to carry the catalyst up the riser. The cracked hydrocarbons are separated from the deactivated catalyst in a separator. However, some thermal and non-selective catalytic reactions continue. A number of refineries are modifying the riser termination devices to minimize these undesirable reactions. Some valuable vapor hydrocarbons adsorbed on the catalyst surface are separated out in a stripper using stripping steam. Cyclones are located at the upper part of the reactor to prevent the catalyst particles to move along with product stream. Finally the cracked hydrocarbons from the reactor are recovered in the main fractionator and gas plant. The main fractionator recovers the heavier products such as light cycle oil and decanted oil, from the gasoline and lighter products. The gas plant separates the main fractionator overhead vapors into gasoline, C3’s, C4’s and fuel gas.
The regenerator is assumed to consist of dense bed and the dilute bed or freeboard region shown in Figure 1. The catalyst activity is recovered in the regenerator dense bed by burning off the coke deposited on the spent catalyst during the cracking reaction. This hot regenerated catalyst is recycled in the riser reactor where it is additionally used as a heat carrier to provide the heat required for endothermic cracking reactions and liquid feed vaporization. The 5-kinetic lump reaction scheme proposed by Bollas et al. [11] and shown in Figure 2 has been adopted in the present study.
There are several assumptions made for the modeling of steady state FCC riser reactor: 1) Gases and catalyst are in plug flow in the riser reactor; 2) Gas oil cracking is a second order reaction but cracking of gasoline and LPG are first order reactions; 3) There are no radial temperature gradients in the gas and solid phases; 4) As the catalyst particles are very small (20 µm - 80 µm) and the vaporized gas oil carries catalyst particles at high velocities, slip factor is assumed to be unity; 5) Dry gases produce no coke; 6) Catalyst deactivation is non-selective and related to coke on catalyst only; and 7) The solid catalyst particles are in thermal equilibrium with the gaseous mixture at all times.
With the above assumptions, the model equations for the riser reactor [30-32] are given in Table 1. Tables 2-5 provide plant operating data, design data and thermodynamic and other data [14,30].
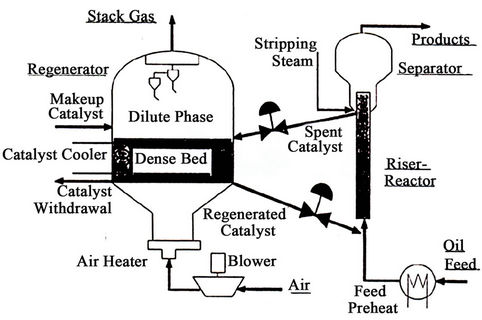
Figure 1. Schematic of modern FCCU (arbel et al. [29]).
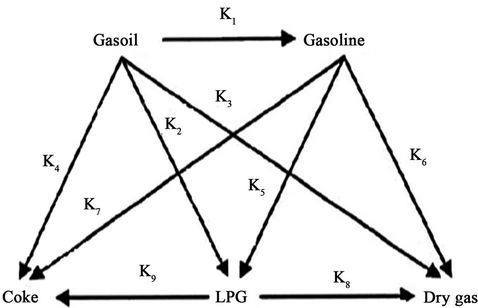
Figure 2. Five lump kinetic scheme.
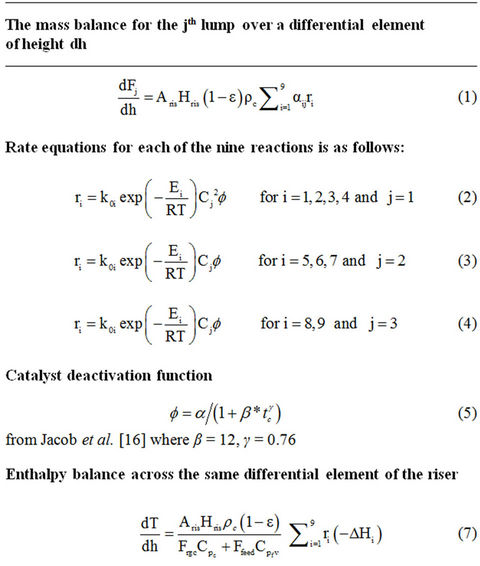
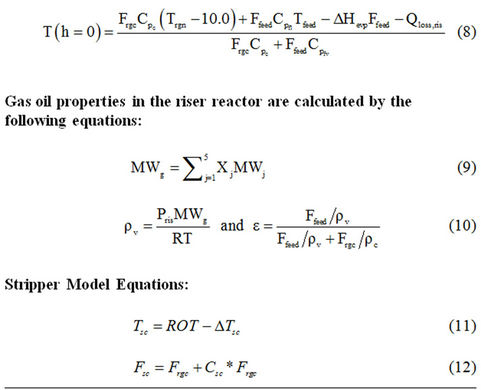
Table 1. Reactor model equations.
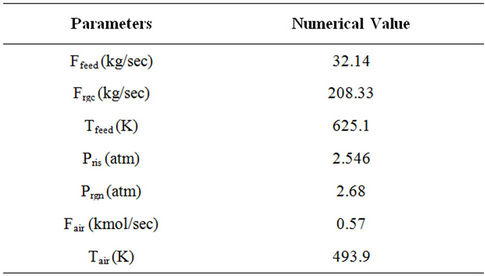
Table 2. Input data used in the simulation.
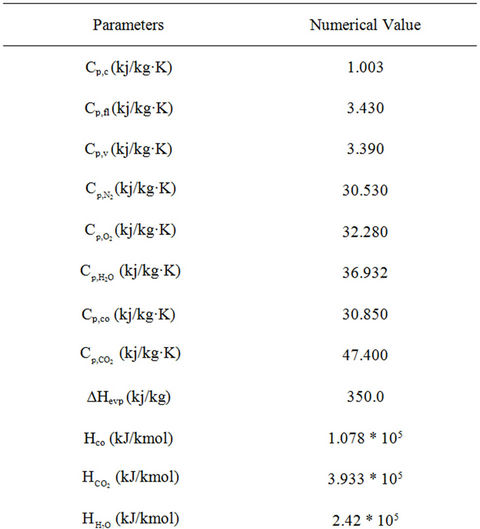
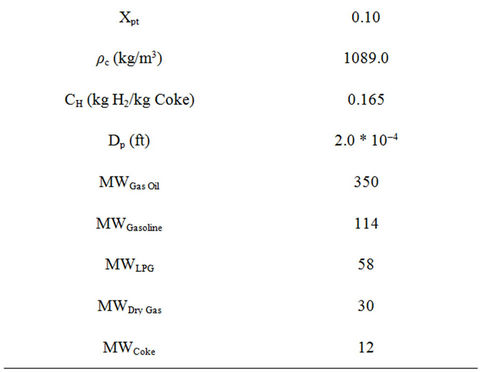
Table 3. Thermodynamic and other parameters used in the simulation of FCC unit.
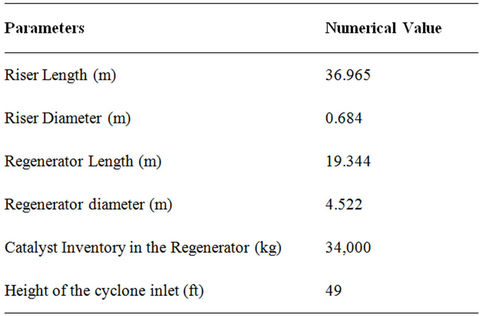
Table 4. Data used for the simulation of FCC unit.
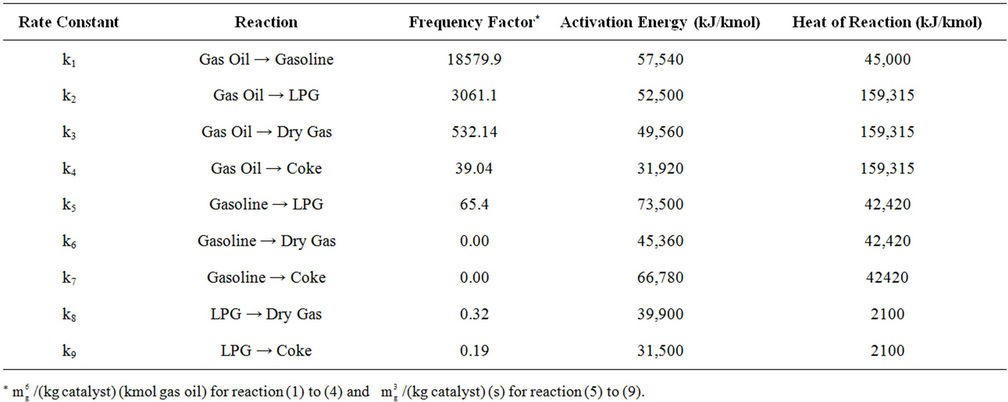
Table 5. Kinetic and thermodynamic parameters used for reactor modeling.
3. Regenerator Model
The deactivated catalyst, after steam stripping of hydrocarbons, enters the regenerator where all hydrogen in the coke is converted into steam. Carbon can be converted to either CO or CO2. The heat of combustion raises the temperature of the catalyst recycling from the regenerator. The heat of combustion released in the regenerator is therefore the most critical item in any such simulation.
The following assumptions are made in the development of the regenerator model [14,30,33-35]. 1) The gases are in the plug flow through bed and in thermal equilibrium with surrounding bed; 2) Catalyst in dense bed is well mixed and isothermal with uniform carbon on catalyst; 3) Kinetics of the coke combustion assumes catalyst particles to be 60 μm sizes; 4) Resistance to mass transfer from gas to catalyst phase is negligible; 5) Mean heat capacities of gases and catalyst are assumed to remain constant over the temperature range encountered; and 6) All entrained catalyst is returned via cyclones. The regenerator model equations are given in Table 6.
The CO2/CO ratio in the gas leaving the dense bed is a function of the bed temperature, residence time, carbonon-catalyst, and equilibrium metals on catalyst. The presence of CO promoters catalyzes CO oxidation and raises CO2/CO ratio. The CO in the dense bed exit is also oxidized in the dilute bed in presence of entrained catalyst. A set of ordinary differential equations in Table 6 (from Equations (23)-(36)) describe the steady state behavior of the gas phase in the regenerator dense bed in terms of the mathematical representation [30].
The Dilute bed is described as a lean phase where entrained catalyst particles and gases evolve in a plug flow pattern. The material and energy balance equations for the dilute bed regenerator are presented (from Equations (45)-(49)) in the Table 6 [30].
Carbon Balance in the Regenerator
The regenerator dense bed consists of two phases, the gases phase and catalyst phase (solid phase), where as the gases are assumed to be moving in plug flow, the catalyst phase is assumed to be well mixed. In this model it is assumed that there is no resistance to mass transfer of gaseous components between gas phase and catalyst phase (Krishna and Perkins [33])
The mathematical representation of carbon balance in the dense bed is given by equation 35 in the Table 6.
4. Stripper Modeling
The aim of stripper is to remove residual hydrocarbons from catalyst surface after cracking reactions. Being a minor unit, no effort was made to rigorously simulate this unit. The spent catalyst temperature and flow rate ware calculated from the model Equations (11) and (12) (shown in the Table 1). A temperature drop of 10 K was assumed across the stripper unit.
5. Simulation Procedure for Continuous Reactor-Regenerator
A continuous riser reactor and regenerator model equations have been coupled by generating a code in C computer language. The ordinary differential equations and nonlinear algebraic equations for material and energy balance (see in Tables 1 and 6) are solved by using a Runge Kutta fourth order and Successive Substitution methods respectively. The calculation of these equations started with initial guess of regenerated catalyst temperature (Trgn) and coke on regenerated catalyst (Crgc), the product yields are calculated at the outlet of the reactor. Subsequently the temperature of spent catalyst and coke on spent catalyst are calculated. The regenerator consists
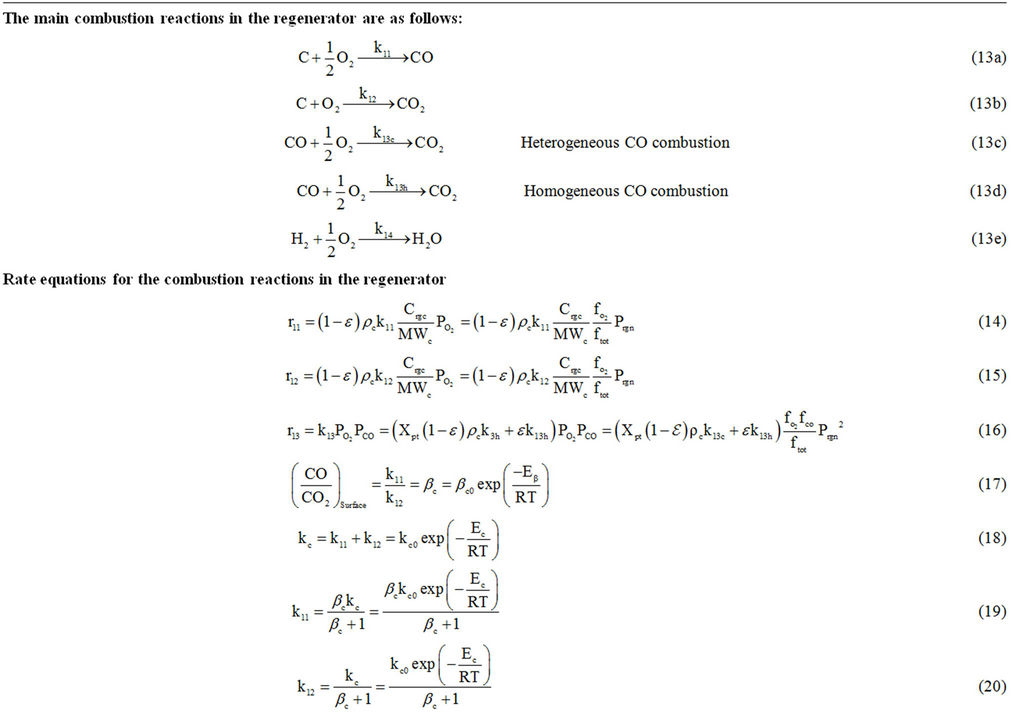
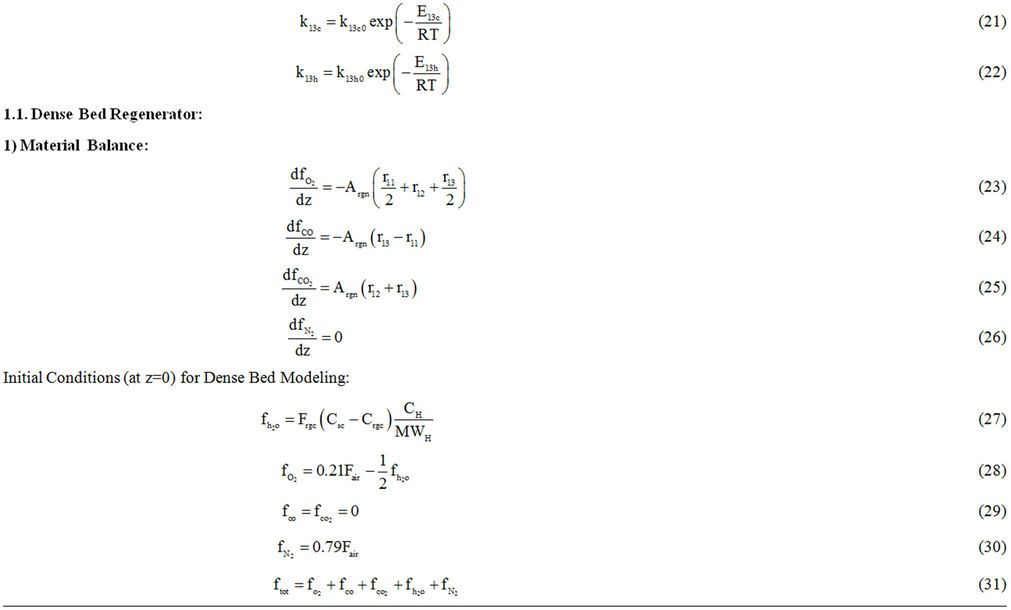
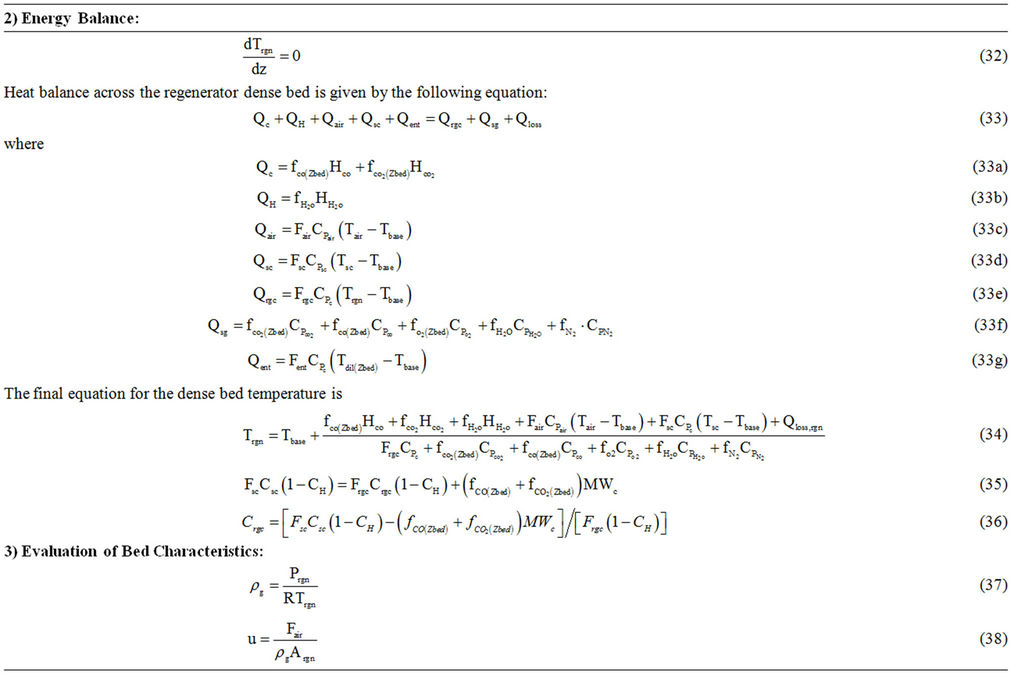
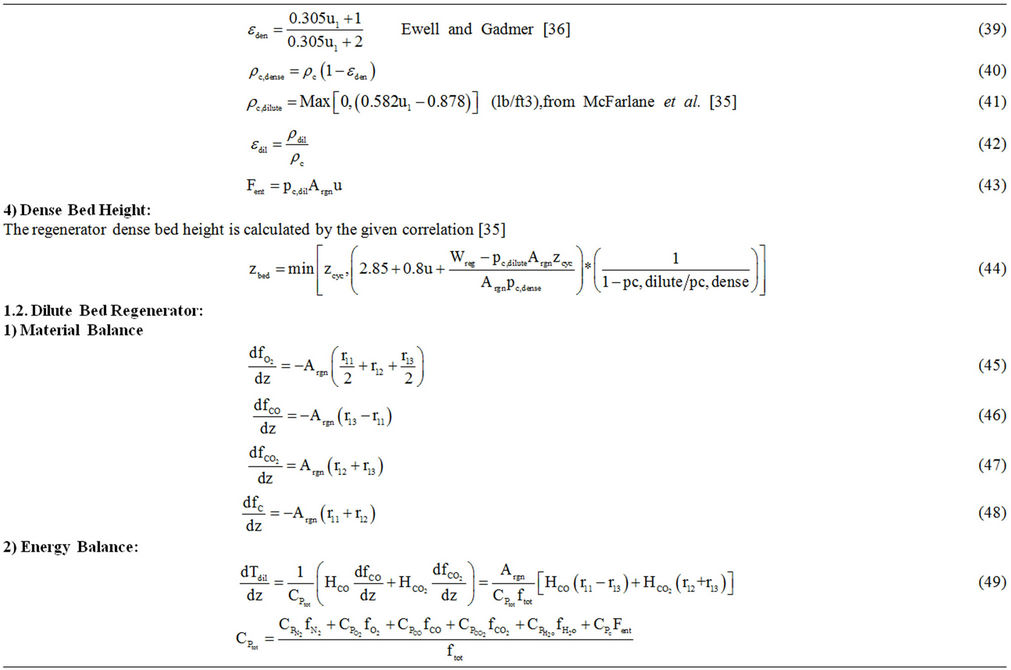
Table 6. Regenerator model equations.
of the two beds: dense bed and dilute bed. The spent catalyst enters into the regenerator dense bed where it regenerates in presence of air and produces flue gases (see Figure 1). The dense bed calculations obtain the new value of catalyst temperature (Tcal) and coke on regenerated catalyst (Ccal) which is compared with the initial value of Trgn and Crgc. If Tcal and Ccal do not match with assumed Trgn and Crgc then one needs to start the reactor calculation with newly calculated values of Trgn and Crgc by using the successive substitution method. Finally all the reactor and regenerator equations are solved with converged value of Trgn and Crgc. The tolerance for the convergence of Trgn and Crgc used are 1˚C and 10–4 kg of coke/kg of catalyst respectively.
6. Results and Discussion
A complete reactor regenerator FCC unit has been simulated using the reactor model equations given by Dave and Saraf [14] and the regenerator model equations from different literature sources [14,30,33,34,37]. The data on activation energies, frequency factors and heat of reaction (Table 5) are also used from the literature [14]. The plant data and the model predicted data are compared in Table 7 and found to be in a good agreement. This validated model is used for different case studies to check the flexibility of the model.
The reactor model has been coupled with regenerator model and used to study the effect of different independent and dependent parameters on the plant performance. In order to study the effect of changing one independent variable on the reactor performance, all others must be held constant. However, it is important that the reactor operates under steady state condition at all times, and this may require some other variable to be varied simultaneously.
The feed flow rate (Ffeed) and feed preheat temperature (Tfeed) are the two key independent variables in the FCC process. The effects of these operating variables on steady state FCC unit performance are calculated by varying air flow rate (Fair) and catalyst circulation rate (CCR) to keep either regenerated catalyst temp (Trgn) or ROT constant. The air flow rate to the regenerator was also used as an independent variable and its effect on conversion and yield studied.
6.1. Effect of Feed Preheat Temperature on FCC Performance at Constant Feed Flow Rate (Ffeed)
6.1.1. At Constant CCR and Constant Regenerator Temperature (Trgn)
Feed preheat temperature plays an important role in controlling the temperature in the riser reactor and hence the cracking reactions (see Figures 3 and 4). Gas oil conversions
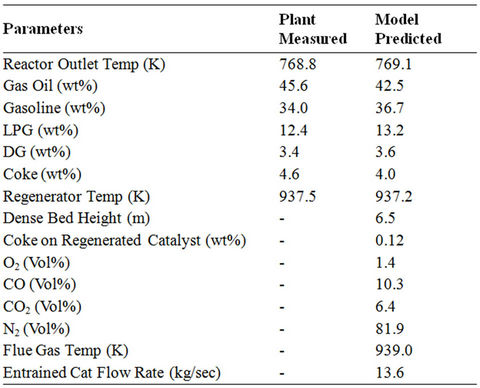
Table 7. Comparison of plant measured and models prediction data.
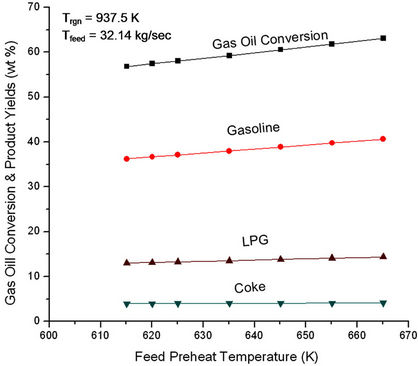
Figure 3. Effect of feed preheat temperature on gas oil conversion and product yields at fixed Ffeed (32.14 kg/sec) and fixed regenerator temperature (937.5 K).
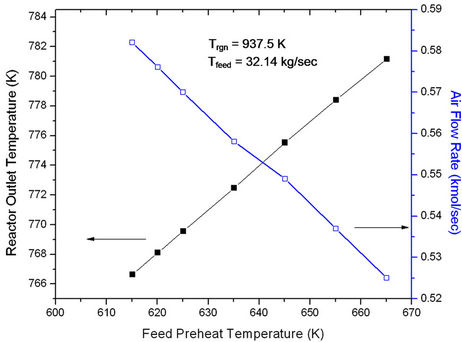
Figure 4. Effect of feed preheat temperature on riser outlet temperature (ROT) at fixed Ffeed (32.14 kg/sec) and fixed regenerator temperature (937.5 K).
as well as yield of all the products were found to increase linearly with increase in Tfeed (Figure 3). Figure 4 shows that reactor outlet temperature (ROT) increases nearly linearly with Tfeed but air flow rate to the regenerator decreases linearly. This is to be expected in view of the fact that with increased ROT, air flow rate must decrease in order to keep Trgn fixed.
6.1.2. At Constant Air Flow Rate and Constant Reactor Outlet Temperature (ROT)
For ease of operation often the reactor outlet temperature is kept constant with the help of a controller. When feed preheat temperature is increased, regenerated catalyst flow rate (Frgc) must decrease to hold ROT constant (Figure 5). At constant feed rate, this amounts to decreasing cat/oil ratio which leads to decrease in conversion and product yields (Figure 6). Figure 5 also shows that with
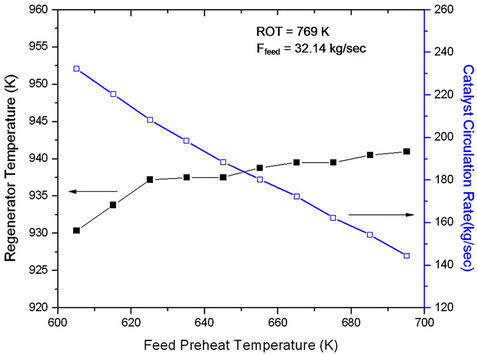
Figure 5. Effect of Feed Preheat Temperature on Regenerator Temperature (Trgn) at Fixed Feed Flow Rate (32.14 kg/sec) and Fix ROT (769 K).
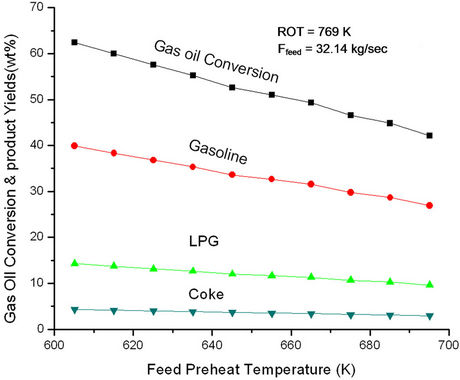
Figure 6. Effect of feed preheat temperature on gas oil conversion and product yields at fixed feed flow rate (32.14 kg/sec) and fix ROT (769 K).
increasing Tfeed, regenerator temperature increases initially rapidly and latter gradually. The change in slope seems to occur at feed preheat temperature 625 K perhaps indicating an optimal condition of operation. At low Tfeed the catalyst circulation rate is high giving rise of high conversion and high rate of coke formation. In view of this, regenerator temperature must increase rapidly, explaining the early sharp rise. From Figure 6 one can conclude that the effect of catalyst circulation rate (or cat/oil) is more pronounced as compared to that of Tfeed. Increasing Tfeed alone would have led to increase in conversion. The analysis showed that a decrease in feed preheat temperature by 10 K at fixed ROT and fixed feed could possibly result in 4% increase in gas oil conversion and 3.9 % gasoline yield. This corresponds to an increase in catalyst circulation rate from 208 kg/sec to 220 kg/sec or an increase in cat/oil ratio from 6.5 to 6.9.
6.2. Effect of Feed Flow Rate on FCC Performance at Constant Tfeed
6.2.1. At Constant CCR and Constant Regenerator Temperature (Trgn)
As feed flow rate is increased keeping regenerator temperature and catalyst flow rate constant, the cat/oil ratio decreases which leads to decreased cracking activity and lower conversion and product yields (Figure 7). Figure 8 shows that ROT decreases with increase in feed rate. While lower cat/oil ratio decreases conversion leading to less absorption of endothermic heat, higher feed absorbs more heat. The effect of feed rate being more pronounced as compared to cat/oil ratio, there is net decrease in ROT, which is to be expected since Trgn is fixed. To keep Trgn constant, air flow rate must increase since sensible heat brought in the regenerator by the catalyst is less at lower ROT.
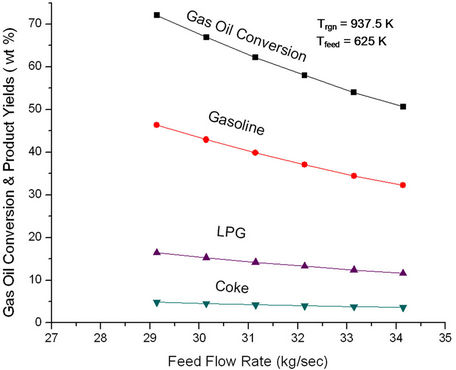
Figure 7. Effect of feed flow rate on the conversion and product yields at fixed feed preheat temperature (625 K) and fixed regenerator temperature (937.5 K).

Figure 8. Effect of feed flow rate on the reactor outlet temperature (ROT) at fixed feed preheat temperature (625 K) and fixed regenerator temperature (937.5 K).
6.2.2. At Constant Air Flow Rate and Constant Reactor Outlet Temperature (ROT)
Figure 9 shows effect of change in feed rate on conversion and product yields at constant ROT and air flow rate. Under these conditions, Trgn is expected to decrease because of extra amount of carbon coming in the regenerator (Figure 10). Catalyst circulation rate must increase to keep ROT constant. In the present case both catalyst flow rate and feed rate are increasing, the cat/oil ratio increaseing gradually. This should lead to increase in conversion. However, Figure 9 shows a decreasing trend in conversion as well as product yields. This can be explained in terms of sharp decrease in Trgn amounting to less heat being available for endothermic cracking reactions, particularly when reactor outlet temperature must be maintained constant.
6.3. Effect of Air Flow Rate (Fair) on FCC Performance at Constant Tfeed, Ffeed and CCR
Figure 11 shows that ROT as well as Trgn increase initially with increasing air rate but become constant at higher air rates. More air rate leads to better coke combustion and hence higher Trgn which in turn, increases ROT. Both Trgn and ROT level off once coke combustion is nearly complete. Higher regenerated catalyst temperature provides higher reactor temperature and hence increased conversion and product yields (Figure 12). These plots suggest that it will be advantageous to increase ROT by 14 K, Trgn by 24 K by increasing air rate to 0.06 kmol/sec.
The result of Figures 11 and 12 have been cross plotted in Figures 13 and 14 which show variation of conversion, product yields and reactor outlet temperature as a function of Trgn.

Figure 9. Effect of feed flow rate on the regenerator temperature (Trgn) at fixed feed preheat temperature (625 K) and fixed reactor outlet temperature (768.8 K).
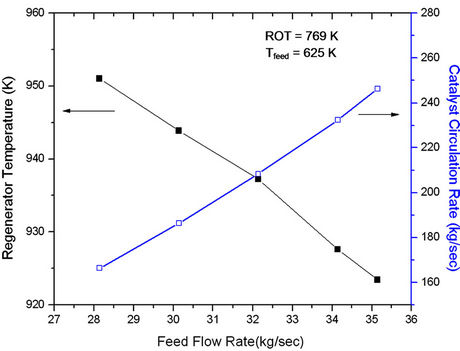
Figure 10. Effect of feed flow rate on the conversion and product yields at fixed reactor outlet temperature (768.8 K) and fixed feed preheat temperature (625 K).
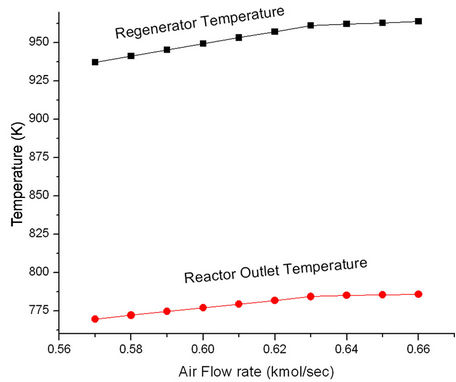
Figure 11. Effect of air flow rate on the regenerator temperature (Trgn) and reactor outlet temperature (ROT).
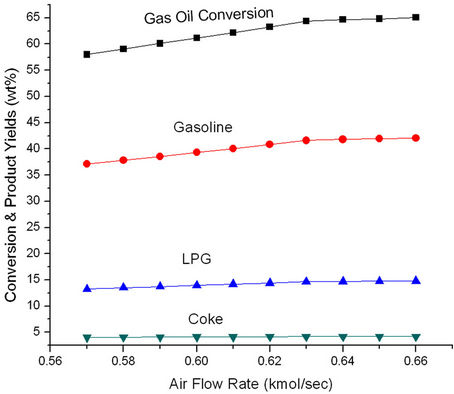
Figure 12. Effect of air flow rate on the conversion and product yields.
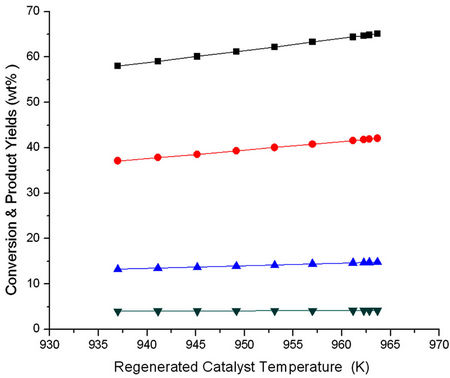
Figure 13. Effect of regenerated catalyst temperature (Trgn) on the conversion and product yields.
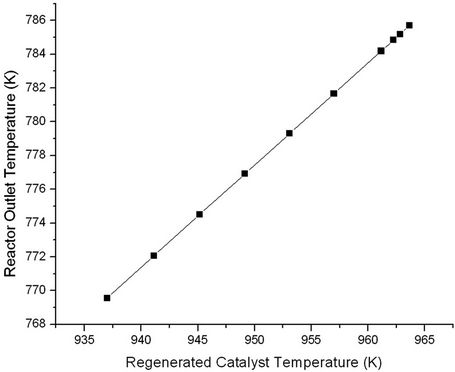
Figure 14. Effect of regenerated catalyst temperature (Trgn) on reactor outlet temperature (ROT).
Combining some of these observations as referred in Table 8, a decrease of say, 10 K, in the feed preheat temperature (Tfeed) and corresponding increase in air rate (Fair) and catalyst circulation rate (Frgc) was found to increase gas oil conversion and product yields by 5 to 6 percent at constant reactor outlet temperature (ROT) and regenerated catalyst temperature (Trgc). The economic visibility of such changes on the operating conditions can be explored by the refiners.
7. Conclusions
An industrial FCC unit has been simulated by integrating kinetic models for the riser reactor and the regenerator. The model equations were solved using a computer based code in C-language. The calculated model results are compared with the plant data, which are found to be in agreement. This validated model is used to study parametric sensitivity such as effects of feed preheat temperature, feed flow rate and air flow rate (independent variables) on the FCC performance.
Catalyst circulation rate has stronger influence on gas oil conversion as compared to feed preheat temperature for a fixed reactor outlet temperature. On the other hand feed flow rate affects conversion more than catalyst circulation rate. Increase in air flow rate with other important parameters remaining constant leads to increased conversion. From above discussion of sensitivity analysis it appears that decreasing Tfeed and increasing catalyst circulation rate and air flow rate should lead to higher conversion and product yields. Table 8 shows the result of such computations. At given feed flow rate, a decrease in feed preheat temperature and increase in air flow rate may lead to increased conversion and product yields. However, this will require increased catalyst circulation rate. Trgn and ROT were found to remain essentially constant.
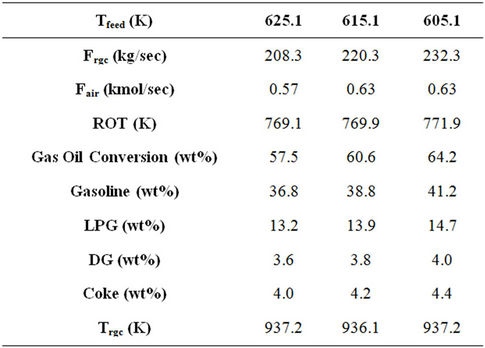
Table 8. Comparison of FCC performance at three different feed preheat temperatures with increased cat/oil ratio and air flow rate.
8. Acknowledgements
The first author thanks the University of Petroleum and Energy Studies for allowing her leave of absence for continuing the research work at University of Saskatchewan, and gratefully acknowledges the financial support of Government of Canada and Indian Oil Corporation Ltd. for this research work.
REFERENCES
- V. W. Weekman Jr. and D. M Nace, “A Model of Catalytic Cracking in Fixed, Moving and Fluid Bed Reactors,” Industrial and Engineering Chemistry Process Design and Development, Vol. 7, No. 1, 1968, pp. 90-95. doi:10.1021/i260025a018
- V. W. Weekman Jr., “Kinetics and Dynamics of Catalytic Cracking Selectivity in Fixed Bed Reactors,” Industrial and Engineering Chemistry Process Design and Development, Vol. 8, No. 3, 1969, pp. 385-391. doi:10.1021/i260031a015
- L. Lee, Y. Chen and T. Huang, “Four-Lump Kinetic Model for Fluid Catalytic Cracking Process,” Canadian Journal of Chemical Engineering, Vol. 67, No. 4, 1989, pp. 615-619. doi:10.1002/cjce.5450670414
- I. Wang, “High Temperature Catalytic Cracking,” Ph. D. Dissertation, Fuels Engineering Department, University of Utah, Salt Lake City, 1974.
- L. C. Yen, R. E. Wrench and A. S. Ong, “Reaction Kinetic Correlation Equation predicts Fluid Catalytic Cracking Coke Yields,” Oil & Gas Journal, Vol. 86, 1988, pp. 67-70.
- M. A. Abul-Hamayel, “Kinetic Modeling of High—Severity Fluidized Catalytic Cracking,” Fuel, Vol. 82, No. 9, 2003, pp. 1113-1118. doi:10.1016/S0016-2361(03)00017-6
- A. Gupta and D. S. Rao, “Model for the Performance of a Fluid Catalytic Cracking (FCC) Riser Reactor: Effect of Feed Atomization,” Chemical Engineering Science, Vol. 56, No. 15, 2001, pp. 4499-4503. doi:10.1016/S0009-2509(01)00122-1
- H. Ali, S. Rohani and J. P. Corriou, “Modeling and Control of a Riser-Type Fluid Catalytic Cracking (FCC) Unit,” Transactions of the Institution of Chemical Engineers, Vol. 75, 1997, pp. 401-412. doi:10.1205/026387697523868
- A. Blasetti and H. de Lasa, “FCC Riser Unit Operated in the Heat-Transfer Mode: Kinetic Modeling,” Industrial & Engineering Chemistry Research, Vol. 36, No. 8, 1997, pp. 3223-3229. doi:10.1021/ie950704v
- J. J. Ancheyta, I. F. Lopez and R. E. Aguilar, “5-Lump Kinetic Model for Gas Oil Catalytic Cracking,” Applied Catalysis A: General, Vol. 177, No. 2, 1999, pp. 227-235. doi:10.1016/S0926-860X(98)00262-2
- G. M. Bollas, A. A. Lappas, D. K. Iatridis and I. A. Vasalos, “Five-Lump Kinetic Model with Selective Catalyst Deactivation for the Prediction of the Cracking Process,” Catalysis Today, Vol. 127, No. 1, 2007, pp. 31-43. doi:10.1016/j.cattod.2007.02.037
- J. J. Ancheyta, I. F. Lopez, R. E. Aguilar and M. I. Moreno, “A Strategy for Kinetic Parameter Estimation in the Fluid Catalytic Cracking Process,” Industrial & Engineering Chemistry Research, Vol. 36, No. 12, 1997, pp. 5170-5174. doi:10.1021/ie970271r
- J. J. Ancheyta, L. F. Lopez and R. L. Aguilar, “Correlations for Predicting the Effect of Feedstock Properties on Catalytic Cracking Kinetic Parameters,” Industrial & Engineering Chemistry Research, Vol. 37, No. 12, 1998, pp. 4637-4640.
- D. J. Dave and D. N. Saraf, “A Model Suitable for Rating and Optimization of Industrial FCC Units,” Indian Chemical Engineer, Section (A), Vol. 45, 2003, pp. 7-19.
- J. Corella, “On the Modeling of the Kinetics of the Selective Deactivation of Catalysts. Application to the Fluidized Catalytic Cracking Process,” Industrial & Engineering Chemistry Research, Vol. 43, No. 15, 2004, pp. 4080- 4086. doi:10.1021/ie040033d
- S. M. Jacob, B. Gross, S. E. Volts and V. W. Weekman Jr., “A Lumping and Reaction Scheme for Catalytic Cracking,” AIChE Journal, Vol. 22, No. 4, 1976, pp. 701-713. doi:10.1002/aic.690220412
- B. Gross, S. M Jacob, D. M. Nace and S. E. Voltz, “Simulation of Catalytic Cracking Process,” US Patent 3960707, 1976.
- S. H. Cerqueira, E. C. Biscaia Jr. and E. F. Sousa-Aguiar, “Mathematical Modeling and Simulation of Catalytic Cracking of Gas Oil in a Fixed Bed: Coke Formation,” Applied Catalysis A: General, Vol. 164, No. 1, 1997, pp. 35-45. doi:10.1016/S0926-860X(97)00155-5
- R. C. Ellis, X. Li and J. B. Riggs, “Modeling and Optimization of a Model IV Fluidized Catalytic Cracking Unit,” AIChE Journal, Vol. 44, No. 9, 1998, pp. 2068- 2079. doi:10.1002/aic.690440914
- R. K. Gupta, V. Kumar and V. K. Srivastava, “Modeling and Simulation of Fluid Catalytic Cracking Unit,” Reviews in Chemical Engineering, Vol. 21, 2005, pp. 95- 131. doi:10.1515/REVCE.2005.21.2.95
- R. K. Gupta, V. Kumar and V. K. Srivastava, “A New Generic Approach for the Modeling of Fluid Catalytic Cracking (FCC) Riser Reactor,” Chemical Engineering Science, Vol. 62, No. 17, 2007, pp. 4510-4528. doi:10.1016/j.ces.2007.05.009
- J. M. Arandes, M. J. Azkoiti, J. Bilbao, H. I. de Lasa, “Modeling FCC Units under Steady and Unsteady State Conditions,” Canadian Journal of Chemical Engineering, Vol. 78, 2000, pp. 111-123. doi:10.1002/cjce.5450780116
- W. Fei, R. Xing, Z. Rujin, L. Guohua and J. Yong, “A Dispersion Model for Fluid Catalytic Cracking Riser and Downer Reactors,” Industrial & Engineering Chemistry Research, Vol. 36, No. 12, 1997, pp. 5049-5053. doi:10.1021/ie9702183
- C. Wu, Y. Cheng and Y. Jin, “Understanding Riser and Downer Based Fluid Catalytic Cracking Processes by a Comprehensive Two-Dimensional Reactor Model,” Industrial & Engineering Chemistry Research, Vol. 48, No. 1, 2009, pp. 12-26. doi:10.1021/ie800168x
- T. A. Berry, T. R. McKeen, T. S. Pugsley and A. K. Dalai, “Two Dimensional Reaction Engineering Model of the Riser Section of a Fluid Catalytic cracking Unit,” Industrial & Engineering Chemistry Research, Vol. 43, No. 18, 2004, pp. 5571-5581. doi:10.1021/ie0306877
- E. Baudrez, G. J. Heynderickx and G. B. Marin, “Steady- state Simulation of Fluid Catalytic Cracking Riser Reactors Using a Decoupled Solution Method with Feedback of the Cracking Reactions on the Flow,” Chemical Engineering Research and Design, Vol. 88, No. 3, 2010, pp. 290-303. doi:10.1016/j.cherd.2009.05.003
- X. Zhou, T. Chen, B. Yang, X. Jiang, H. Zhang and L. Wang, “Kinetic Model Considering Reactant Oriented Selective Deactivation for Secondary Reactions of Fluid Catalytic Cracking Gasoline,” Energy & Fuels, Vol. 25, No. 6, 2011, pp. 2427-2437. doi:10.1021/ef200316r
- J. H. Lee, S. Kang, Y. Kim and S. Park, “New Approach for Kinetic Modeling of Catalytic Cracking of Paraffinic Naphtha,” Industrial & Engineering Chemistry Research, Vol. 50, No. 8, 2011, pp. 4264-4279. doi:10.1021/ie1014074
- A. Arbel, Z. Haung, I. H. Rinard, R. Shinnar and A. V. Sapre, “Dynamic and Control of Fluidized Catalytic Crackers. 1. Modeling of the Current Generation of FCC’s,” Industrial & Engineering Chemistry Research, Vol. 34, No. 4, 1995, pp. 1228-1243. doi:10.1021/ie00043a027
- R. B. Kasat, D. Kunzuru, D. N. Saraf and S. K. Gupta, “Multiobjective Optimization of Industrial FCC Units Using Elitist Non-Dominated Sorting Genetic Algorithm,” Industrial & Engineering Chemistry Research, Vol. 41, No. 19, 2002. pp. 4765-4776. doi:10.1021/ie020087s
- Y. X. Sha, “Deactivation by Coke in Residuum Catalytic Cracking, Catalysts Deactivation,” In: J. B. Butt, Ed., Bartholomew, Elsevier, Amsterdam, 1991, pp. 327-331.
- A. Voorhies Jr., “Carbon Formation in Catalytic Cracking,” Industrial & Engineering Chemistry, Vol. 37, No. 4, 1945, pp. 318-322.
- A. S. Krishna and E. S. Parkin, “Modeling the Regenerator in Commercial Fluid Catalytic Cracking Units,” Chemical Engineering Progress, Vol. 81, 1985, pp. 57- 62.
- H. I. De Lasa and J. R. Grace, “The Influence of the Freeboard Region in a Fluidized Bed Catalytic Cracking Regenerator,” AIChE Journal, Vol. 25, No. 6, 1979, pp. 984-991. doi:10.1002/aic.690250609
- R. C. McFarlane, R. C. Reineman, J. F. Bartere and C. Georgakis, “Dynamic Simulator for a Model IV Fluid Catalytic Cracking Unit,” Computers & Chemical Engineering, Vol. 17, 1993, pp. 275-300.
- R. B. Ewell and G. Gadmer, “Design Cat Crackers by Computer,” Hydrocarbon Processing, Vol. 4, 1978, pp. 125-134.
- A. A. Avidan and R. Shinnar, “Development of Catalytic Cracking Technology. A Lesson in Chemical Reactor Design,” Industrial & Engineering Chemistry Research, Vol. 29, No. 6, 1990, pp. 931-942. doi:10.1021/ie00102a001
Nomenclature
Argn = Regenerator cross-section area, m2
Aris = Riser cross-sectional area, m2
CH = Weight fraction of hydrogen in coke, (kg H2)/(kg coke)
Cc = Coke on catalyst, kg coke /kg catalyst Ci = Concentration of ith component, kmol/m3
Cpc = Catalyst heat capacity, kj/kg·K Cpco = Mean heat capacity of CO, kj/kg·K
 = Mean heat capacity of CO2, kj/kg·K Cpfl = Liquid feed heat capacity, kj/kg·K Cpfv = Vapor feed heat capacity, kj/kg·K
 = Mean heat capacity of water, kj/kg·K
 = Mean heat capacity of N2, kj/kg·K
 = Mean heat capacity of O2, kj/kg·K Crgc = Coke on regenerator catalyst, (kg coke)/kg cat Csc = Coke on spent catalyst, (kg coke)/kg cat Eβ = Activation energy for CO/CO2 at the catalyst surface
Ej = Activation energy of ith cracking reaction in the riser E13c = Activation energy for homogeneous CO combustion E13h = Activation energy for heterogeneous CO combustion fc = Molar flow rate of carbon in the regenerator, kmol/ sec fco = CO molar flow rate in the regenerator, kmol/sec
 = CO molar flow rate in the regenerator, kmol/sec
 = H2O molar flow rate in the regenerator, kmol/sec
 = N2 molar flow rate in the regenerator, kmol/sec
 = O2 molar flow rate in the regenerator, kmol/sec ftot = Total gas molar flow rate in the regenerator, kmol/ sec Fair = Air flow rate to the regenerator, kmol/sec Qent = Heat input to the dense bed from entrained catalyst returning from cyclone, kj/sec QH = Heat released by the hydrogen combustion, kj/sec Qrgc = Heat flow with regenerated catalyst, kj/sec Fj = Molar flow rate of jth lump, kmol/sec Frgc = Catalyst Circulation Rate (CCR), kg/sec Fsc = Spent catalyst flow rate, kg/sec Ffeed = Oil feed flow rate, kg/sec h = Dimensionless riser height Hris = Riser height, m
∆Hevp = Heat of vaporization of oil feed, kj/kg Hco = Heat of Formation of oil feed, kj/kmol
 = Heat of formation of CO2, kj/kmol
 = Heat of formation of H2O, kj/kmol
∆Hi = Heat of cracking of ith lump, kj/kmol i = total no. of reactions in the reactor j = Total no. of kinetic lumps k0, i = Frequency factor for ith reaction in the riser kco = Frequency factor for coke combustion, 1/(atm) (s)
k13co = Frequency factor in heterogeneous CO combustion expression, kmol CO/(m3) (atm2) (s)
k13ho = Frequency factor in homogeneous CO combustion expression, kmol CO/ (m3) (atm2) (s)
MWj = Molecular weight of jth lump, kg/kmol MWc = Molecular weight of coke, kg/kmol MWg = Average molecular weight of gas oil feed, kg/ kmol MWH = Molecular weight of hydrogen Pris = Riser pressure, atm Prgn = Regenerator pressure, atm
 = Average mean oxygen partial pressure, atm Qair = Heat flow rate with air, kj/sec QC = Heat released by the carbon combustion, kj/sec Qsc = Heat flow rate with spent catalyst, kj/sec Qsg = Heat flow rate with gases from the regenerator dense bed, kj/sec Qloss, rgn = Heat losses from the regenerator, kj/sec Qloss, ris = Heat losses from the riser base, kj/sec ri = Rate of the ith reaction (kmol/kg.cat.s)
R = Universal gas constant ROT = Riser outlet temperature (K)
T = Riser temperature at any axial height, K Tair = Temperature of the air to the regenerator Tbase = Base temperature for heat balance calculations, K (866.6 K)
Tfeed = Gas oil feed temperature, K Trgn = Regenerator dense bed temperature/Regenerated catalyst temperature, K Tsc = Temperature of spent catalyst, K
∆Tst = Stripper temperature drop (~10˚C)
W = Catalyst inventory in the regenerator, kg
ρden = Catalyst density in the dilute phase of the regenerator, kg/m3
ρg = Molar gas density in the regenerator, kmol/m3
ρv = Oil vapor density, kg/m3
 = Catalyst activity
 = Catalyst residence time, sec Xpt = Relative catalytic CO combustion rate Xj = Mole fraction of jth component Z = Axial height from the entrance of the riser or regenerator, m Zbed = Regenerator dilute bed height Zdil = Regenerator dilute phase height, m Zrgn = Regenerator height, m
Greek Letters
αij = Stoichiometric coefficient of jth species in ith reaction
βc = CO/CO2 ratio at the surface in the regenerator
βcoFrequency factor in βc expression
ε = Riser or regenerator void fraction
ρc = Catalyst density, kg/m3
ρden = Catalyst density in the regenerator dense bed, kg/m3
NOTES
*Corresponding author.