Food and Nutrition Sciences
Vol. 3 No. 6 (2012) , Article ID: 20048 , 15 pages DOI:10.4236/fns.2012.36112
Characterization of Feed Properties for Conceptual Process Design Involving Complex Mixtures, Such as Natural Extracts
![]()
Institute for Separation and Process Technology, Clausthal University of Technology, Clausthal-Zellerfeld, Germany.
Email: *strube@itv.tu-clausthal.de
Received March 15th, 2012; revised May 3rd, 2012; accepted May 11th, 2012
Keywords: Complex Mixtures; Process Synthesis; Conceptual Process Design; Modeling; Plant-Based Extracts
ABSTRACT
The number of products used as agro-chemicals, food additives, flavors, aromas, pharmaceuticals and nutraceuticals which are made by fermentation or extraction from plants has increased significantly. Despite this growth, initial predictions for a potential product purification process for these complex mixtures remains entirely experimentally based. The present work represents an initial study to demonstrate the benefits of a systematic approach. For process development of chemically well-studied systems model based process design methods are already available. Therefore the proposed approach focuses on a method for the efficient characterization of the physical properties of the key components. Once this is adequately defined, unit operations and their potential to separate the feed components can be modeled. The current state of research is discussed. Based on this evaluation the most efficient method for conceptual process development has been identified and further developed. The resulting methodology consists of model-based cost accounting accompanied by experimental model-parameter determination. The latter is carried out at in miniaturized laboratory-scale measurement cells for each unit operation using the complete original feed. The model-based modelparameter determination from these experiments is accompanied by a comprehensive error analysis. The experimental plan currently includes the determination of thermodynamic equilibrium conditions in the mixture directly from the raw material mixture. Transport kinetics and fluid dynamic parameters are first estimated from known correlations or preexisting knowledge. Later on these parameters are determined exactly in mini-plant experiments. Furthermore, biological and botanical-based guidelines are developed to identify thermodynamically favored basic operations. Finally, the developed approaches are successfully validated using two plant extracts. Firstly, it could be proven that the botanical pre-selection can reduce the experimental plan significantly. Secondly, it was shown that the experimental equilibrium data of the kinetics and fluid dynamics can have a significant impact on the separation costs. Therefore, detailed rigorous modeling approaches have to be chosen instead of short-cut methods in order to make any valid process development conclusions or to further optimize the system.
1. Introduction
Usually the design and development of a separation process passes through multiple phases e.g. product development, basic and then detailed engineering. At the end of each phase a cost-driven decision to either continue or to abort the project must be made [1].
The amount and accuracy of information about the processes and systems under these considerations increases exponentially with development time. Simultaneously, the possibility of cost effective improvements in process management which can be developed with increasing knowledge, decreases (see Figure 1). Thus, over 70% of the manufacturing costs are already defined in the conceptual process design (CPD) and therefore the first development of the first flow-sheet set-up [2]. The fundamental limitation which has to be taken into account is the limited availability of feedstock, usually of the order of a few liters. At this stage of the project, when the probability of project failure is high, there is also limited analytical and experimental resource to be exploited.
Figure 1 shows that only improvements which are introduced in the product development or early basic engineering stages can reduce costs significantly. But these potential improvements require additional investment in detailed research and development at an early process
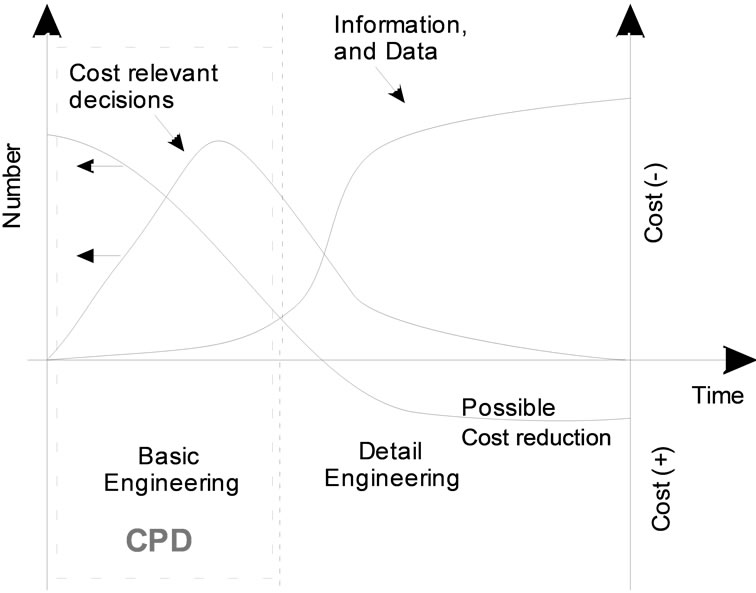
Figure 1. Available information and possible cost reduction over the engineering phases.
development stage when there is a higher risk of project failure. Therefore, to justify these increased efforts in process optimization at an early project stage, an extremely efficient approach has to be found. If opportunities for improvements are identified later on, they are often no longer economical. In the context of a concepttual process design (CPD) it should therefore be attempted to predict an optimal process at an early stage of process design at the limited basis of available information. These facts result in the demand of a systematic and standardized approach to characterize the regarded feed. The unit operations have to be evaluated in terms of feasibility and economy. The central question to be considered then is: what approach can be used in order to gain the necessary increased level of information without requiring unacceptable additional experimental or analytical effort.
Figure 2 locates the feed characterization step in the overall process development. Individual unit operations have to be modeled before they can be arranged as a first process proposal in the conceptual process design accompanied by cost estimations. In advance, an identification of key-components and their thermodynamics physical-chemical data with regard to the needed modeling depth has to be done. Experiments to determine model parameters in lab scale are inevitable.
For process synthesis some theoretical approaches such as the method according to Blass, the branch-andbound algorithm, evolutionary or heuristic methods [1, 3-5] already exist. Nowadays, these methods can be mapped by algorithms and supported by simulations using varying depths of detail. Literature shows that for systems with only few (<5), well-studied, low molecular weight components, these different approaches for process synthesis exist and are generally applicable [6-8].
The behavior of a mixture in each separation operation can be predicted from pure component data found in databases [9-13]. Laboratory experiments and analysis of streams provide further information on the separation behavior of mixtures in the various separation operations [14-16]. However, these methods fail in the treatment of complex mixtures, such as plant extracts, due to the high number of different substances and the lack of available physicochemical data based on known molecular structures.
Complex mixtures are defined in this case as follows:
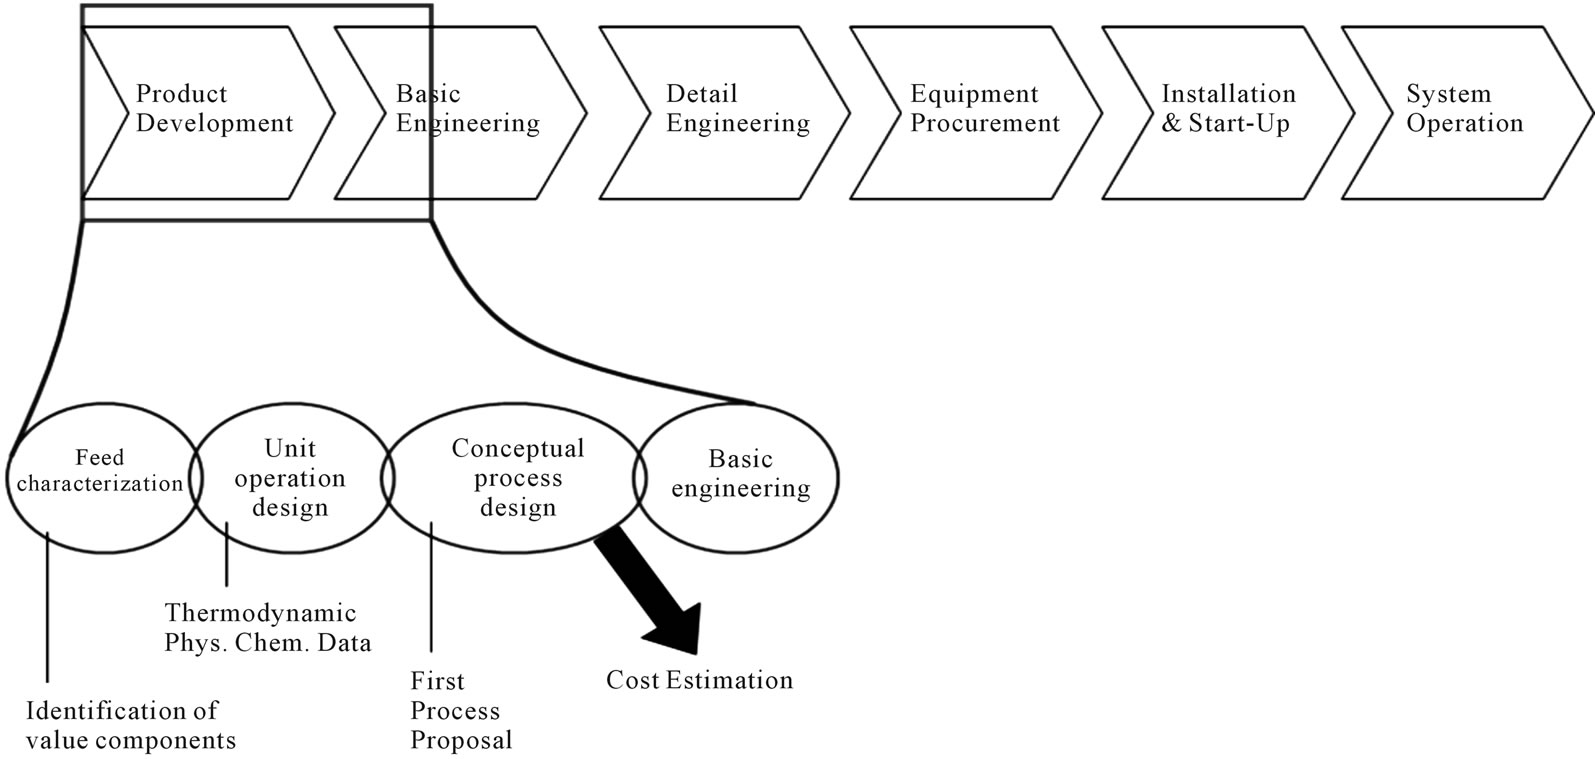
Figure 2. Location of feed characterization in the process synthesis.
The mixtures consist of several components.
• The components are divided into one or more target components and several tens to thousands side components.
• The approach points out to reduce the separation task to 5 key-components for each unit operation.
• Some of the components are so similar in their thermodynamic properties that they cannot be separated from each other with sufficient selectivity in a single unit operation.
• Most often thermal not stable target substances.
The transfer of existing CPD methods to complex mixtures fail. This is because, so far, no efficient way has been found to identify the structure of all relevant substances in these mixtures. This is required to begin the determination of the relevant thermodynamic data:
• Both main tools of the early process development stages, namely the database queries and quantum mechanicalor group-contribution-based calculations need a structure determining analysis.
• Experimental determination of thermodynamic properties for both pure components and mixtures requires the isolation of representative sample quantities.
Therefore, to date, it was not possible to examine the feasibility or accessibility of approaches in conceptual process design for the separation of complex mixtures such as plant extracts. A standardized, systematic approach for the determination of an optimal separation sequence based on modeling of operating and investment costs, but with minimal experimental efforts, currently does not exist. In this paper, the state of the art is depicted and discussed. On base of that a systematic approach, which combines the model-based evaluation of the feasibility and economy of the unit operations in separation science and experiments in laboratory scale, to determine model parameter is shown.
2. Conceptual Process Design
In academic literature, different approaches have been presented in the last few years. A recent analysis of references using methodical approaches showed that (Figure 3):
• Most often (37%) short-cut models are used.
• More detailed models are used 16% of the time.
• Synthesis tools using heuristic rules are used by 13% of the analyzed literature.
• Least frequently (with 2%) used were purely experimental driven methods for process synthesis.
• Of the literature-described examples of process synthesis, about 75% of the physical properties needed are known in databases or are calculated from molecular structure, about 16% are unspecified and only
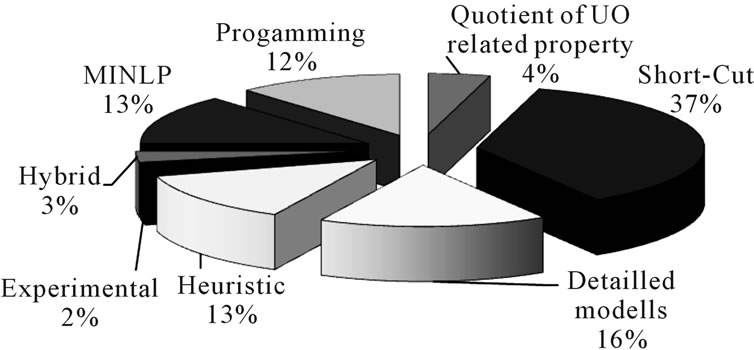
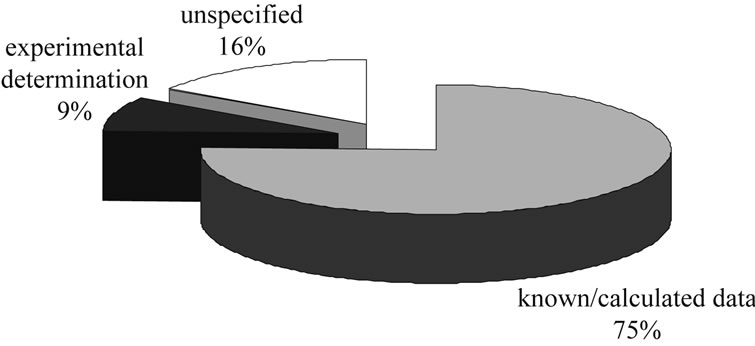
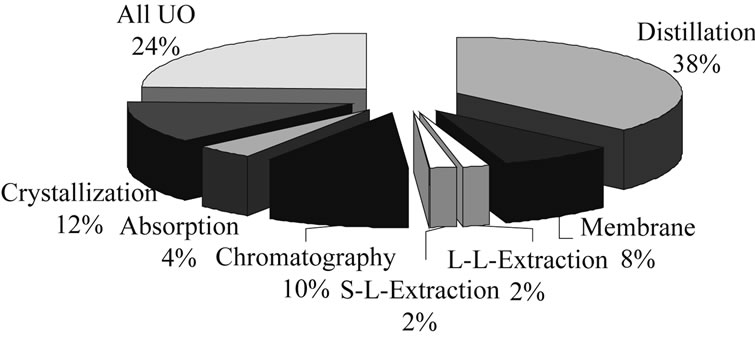
Figure 3. Distribution of methods used in process synthesis.
the remaining roughly 9% are experimentally determined.
• The unit operations considered for the process synthesis examples in literature are predominantly distillation, followed by crystallization, chromatography and membranes. Absorption, solid-liquid extraction and liquid-liquid extraction are found to a much lesser extent in these examples.
In the field of process synthesis model-based methods are well established. Regardless of the different approaches, it is important for model-based process synthesis to have a reliable and comprehensive data basis. For short cut calculations at the lowest level of detail, the model input parameters used are separation factors. Accuracy of short-cut calculations could be improved by the use of thermodynamic mixture data instead of separation factors e.g. [17,18].
In reality the degree of non-ideality in the equipment operated determines the degree to which each unit operation should be optimized. In process design and optimization only the optima which can be achieved in reality should be compared. For process design and optimization, the detailed model used ought to take into account equilibrium thermodynamic data and both mass transport and fluid dynamics parameters.
In order to define the necessary modeling depth for each unit operation due to the sensitivity of detailed modeling vs short-cut approaches, mass transfer coefficient and axial distribution are varied in typical magnitudes.
Figure 4 demonstrates this effect in a typical liquidliquid extraction column used in the purification of plant extract. It is clear that fluid dynamic and mass transfer non-idealities account for between 20% and 40% of the separation costs. This is a significant contribution and therefore should be taken into account. A short-cut approach would fail to generate data which is reliable when being realized industrially.
The majority of the data used in academia is obtained from databases or by calculation methods for physical properties based on molecular structure.
• In about 16% of the literature how data is gained is not explained. However, it is likely that it is taken from databases.
• For only about 9% of the references is the required data determined experimentally; this 9% is largely concerned with either process synthesis of chromatographic separations [19-21] or optimization of existing processes [22-24].
• The references include all the usual basic unit operations, while the majority deal with distillation operations. Those labeled in the figure as “all unit operations” (24%) include mostly review articles whose statements can be applied to all unit operations.
From this literature research it can be concluded that currently there are three different ways for obtaining the necessary data for the model-based process synthesis:
1) Databases
There are extensive databases in which the properties
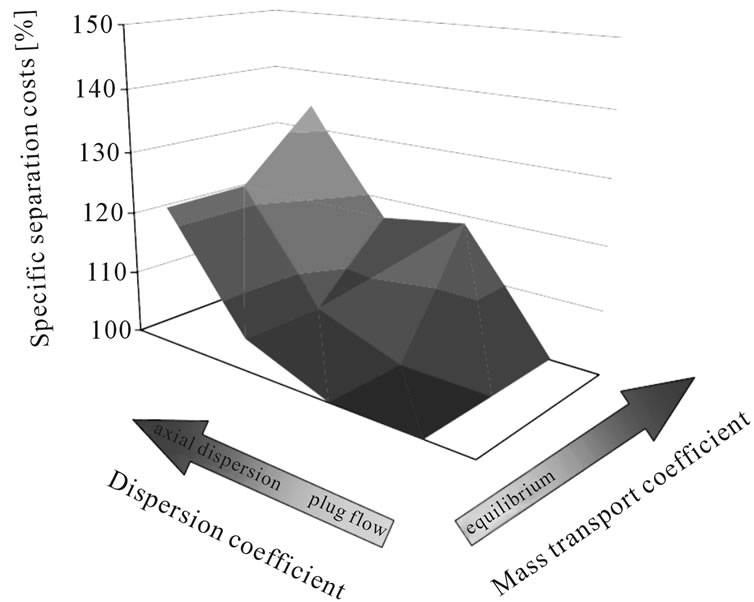
Figure 4. Separation costs and as they vary with dispersion and mass transport coefficients.
of already known and well-studied substances and systems are deposited [9-13]. The development of distillation columns for the separation of well-studied and documented systems is possible without prior experiments with a high degree of accuracy [14].
2) Calculation methods
There are comprehensive methods for the calculation of physicochemical property data based on molecular structure. These include quantum mechanics as well as group contribution methods [19,25-31].
3) Experimental determination
Equilibrium phase distribution coefficients and separation factors for the individual unit operation are determined in laboratory-scale experiments [21,24,32-39].
3. Modeling Depth
To describe a thermodynamically feasible separation as a unit operation, several model parameters are needed. In Table 1 these phase equilibrium, mass transport (kinetic) and fluid dynamic parameters are listed for the main unit operations in separation of plant extracts or fermentation broths. Furthermore, parameters important for cost calculations are also listed.
To make decisions between alternative unit operations and their sequencing requires models of these unit operations which are sufficiently precise. As described before, these decisions are in most cases quite in a narrow range, they can not be filed on the basis of a rough estimation like it would be if only separation coefficients between target and side components are considered if so called short-cut-calculations would be applied.
On the other hand, the required model parameters must be accurately determined and with reasonable cost and experimental effort, even at this early stage in the project. Therefore, a compromise between maximization of the model depth and accuracy of the method for model parameter determination has to be found.
Experience shows that inclusion of mass transfer and overall fluid dynamic non idealities often brings a sizable gain in modeling accuracy and should therefore be included (see Figure 4). For this reason, in this study axial dispersed plug models with equilibrium description of mixtures by key-component groups and mass transfer resistances are used.
The parameters for the equilibrium behavior have to be determined using one of the above described methods.
Due to the fact that an exact experimental measurement of the mass transfer and fluid dynamic parameters would result in significant additional experimental work and an increase in the required sample volume, these parameters should be assessed as follows: Initially, at this early stage of process development the parameters are

Table 1. Required model parameters for different modeling depth.
only calculated and/or assumed by using existing correlations, pre-existing knowledge and experience.
Subsequently their significance to the separation should be checked using parameter sensitivity studies. They should then be improved using experimental results. At a later stage in the project, these efforts are justified by the benefit of continuing with the project. Pathways for parameter determination: The common approaches found in the literature can be classified into three different methods as shown schematically in Figure 5.
1) The molecular structure-oriented variant, “Molecular structure based” is a process design strategy in which the required physical and chemical properties are either available, or can be calculated or measured from the pure single components. Here, the substances in the feed mixture will first be identified in their structure and identity. The relevant physicochemical data are taken from databases or calculated by different methods like COSMORS, UNIFAC or UNIQUAC.
If these methods fail the physicochemical data can be determined experimentally from the pure component. These parameters can be used afterwards for simulation and process synthesis. As shown in the literature research above, this is a very well documented and widely used approach. To test the feasibility of this approach, it is subjected to a detailed review:
• Analytical-scale separation and determination of molecular structure is a very well-researched area in the scientific field of substance discovery in plant extracts [40-46]. Nevertheless, these techniques are optimized with the focus being to identify one or at least a few substances. The aim in the application to complex mixtures is to identify several substances in parallel. The adaption of these techniques to these new requirements has shown that it is possible to identify several of the more highly concentrated substances, but that it needs huge experimental effort. In particular, the providing of sample quantities for all substances (even the side components) needed for the experimental determination of physicochemical data would result in an unaffordable experimental task.
• In order to analyze the possibility of determination of physicochemical data by databases, the 3026 known secondary metabolites [47] were compared with the technologically most relevant physicochemical databases like the Dortmund-database [10] and Dechema database [9]:
- This study shows that for only 166 (5%) of the requested substances physical chemical data was available.

Figure 5. Three basic approaches by which all common methods for process synthesis can be classified.
- The most frequently listed data are melting points with 3.3% of all substances listed, vapor pressure (where the corresponding figure is 3.3%), density (2.8%), heat capacity (2.5%) and evaporation (2%).
- The proportion of known substances in plants, according to present knowledge, is estimated to be 3% - 5%.
This shows that for only a small proportion of the secondary metabolites is their structure known. For only a small fraction of these known ones is the relevant information for process design available in databases.
Only for well studied systems, such as the extraction of lemon peel [48], is there a sufficient understanding of the system to complete the process development using the existing data. Even with simulation methods such as group contribution or quantum mechanical methods, a parameter calculation is only possible for molecules with up to 50 atoms. Above this range the calculations do not produce accurate values [14].
2) The model parameter-oriented variant, “Unit operation based”, provides a way to develop a separation sequence, even in the absence of physicochemical property data. The experimentally-driven method starts with a characterization of the feed mixture in the individual unit operations at different operating conditions. With the data obtained from these mixture experiments the simulation and process synthesis will carried out.
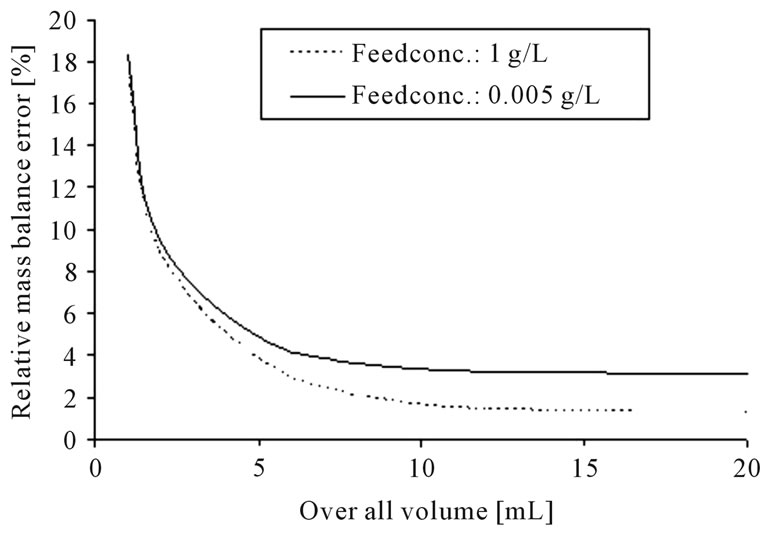
For measurement of the equilibrium data, standardized laboratory scale experiments are buildup. An error calculation has been made to determine the minimal equipment volume to get results with a relative mass balance error of ±5%. The Gaussian error propagation law, see Equation (1), was used to consider the different error sources.
 (1)
(1)
The error calculation for the standardized parameter determination experiments for: 1) liquid-liquid-extraction and; 2) distillation, results in the following volume-dependent graph (see Figure 6).
From these calculations it is possible to determine the minimum required volume for minimized error. Table 2 summarizes these minimum required volumes for the experimental model parameter determination of unit operations such as:
• Liquid-liquid-extraction,
• Distillation,
• Membrane and
• Chromatography.
The conclusion of the analysis is that, with about 1 liter of natural extracts broth, all relevant experiments should be possible within the desired accuracy for detailed modeling.
3) The third approach is a combination of the two variants described above. First, the material data for the target component and all other known substances are

Table 2. Required volumes for the determination of equilibrium data.
 (a)
(a)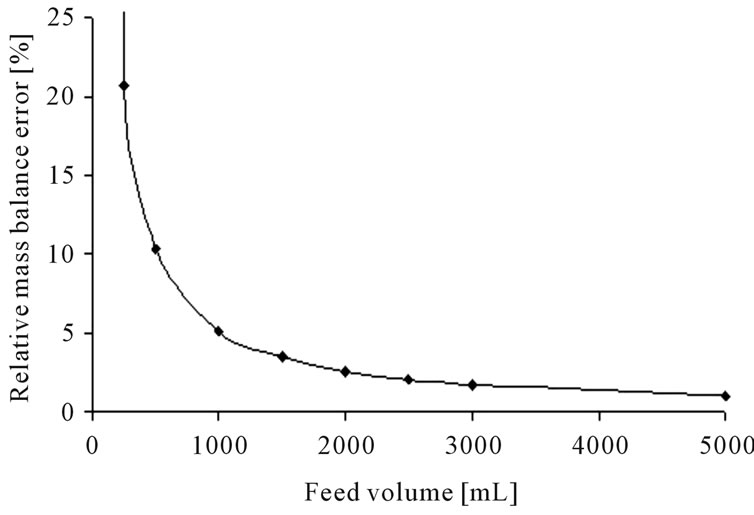 (b)
(b)
Figure 6. Error calculation for the determination of equilibrium data for liquid-liquid-extraction (a) and distillation (b).
needed. The physicochemical data of these components are determined in accordance with the “Molecular structure based” approach described above.
Initially information from literature and heuristics are used to describe the possible behavior of the target component in the unit operations (see Figure 7). A fundamental superstructure is derived from literature data and is shown in the same figure.
Of course this data is not complete, and not sufficiently accurate to achieve precise enough predictions. But, based on this initial, educated guess at potential unit operations, a superstructure of a process flow-sheet is the starting point for model-based process development. Therefore, the experimental parameter determination according to the “Unit operation based” approach can be reduced, but not replaced by this method.
Afterwards the “Unit operation based” laboratoryscale experiments are optimized with the objective that the target component is always preferentially separated. The parameters obtained from these experiments are sufficient for modeling and process synthesis.
4. Experiments and Results for the “Unit Operation Based” Approach
4.1. System 1: Vanillin
4.1.1. Analysis by Chromatography
An extract made by solid-liquid extraction with a water/ ethanol mixture (1:1) of vanilla pods was considered. Analysis is based on an RP-separation with a UV detector. An example of the resulting chromatogram is shown in Figure 8. The target component (TC) is vanillin, the five side components (SC) are assumed to be unknown.
The target component is the most apolar in this chromatogram. Any industrial scale/preparative separation by RP-chromatography, or even using the more economical NP-chromatography, is therefore an option which must be considered in comparison to the other unit operations.
As analytics, the separation is often based on chromatography. Any transfer to technical chromatography is therefore an option directly on hand. Economy has to be evaluated in process synthesis, of course.
4.1.2. Potential Unit Operations for Product Purification
Fundamentally, all separation mechanisms, and therefore all unit operations, are possible for the isolation of the target component. Previously known information about the target and side component led to the following restrictions:
• It is known that both target and side components have

Figure 7. Heuristics for secondary metabolites, generated from data available in [49].

Figure 8. Chromatogram of vanillin extract with target and side component.
a molecular weight below 500 g/mol. Therefore, the use of separation techniques using molecular size e.g. filtration membranes makes no sense. Nanofiltration may be an option, but molecular sizes are too similar.
• Chromatographic separations may not be feasible due to the low value of the target component.
Thus, the appropriate separation operations to be examined are liquid-liquid extraction, distillation and crystallization. Liquid-liquid extraction and distillation are considered here and a possible process is proposed.
4.1.2.1. Option: Liquid-Liquid Extraction
1) Solvent choice
An experimental plan can be derived for solvent combinations which are immiscible in liquid-liquid extraction:
• The feed solvent is a 1:1 mixture of ethanol and water. Water is immiscible with many organic solvents; however ethanol is soluble in any solvent.
• Miscibility tables determine which solvents are immiscible with an ethanol-water mixture. This has been proved in preliminary laboratory-scale tests. Examples of solvents which are not miscible with the system water-ethanol are hexane, heptane, toluene, dichloromethane and chloroform.
• Especially for flavors and nutrition, most of the named solvents are not applicable by regulations. To exemplify solvent selectivity they were taken into account in this studie.
2) Determination of equilibrium phase distribution coefficient
The various solvent and feed mixtures were added to 15 mL tubes and their exact volumes measured. The sealed samples were individually weighed. To increase the surface area the reaction vessels were shaken horizontally for 24 hours at 20˚C. The emulsion formed is separated into two distinct phases using a centrifuge. At the end of the experiment the volumes of all phases are again determined. The individual phases are withdrawn using syringes and analyzed for their contents by HPLCUV. The resulting distribution coefficients are given in Table 3.
To evaluate the separation efficiency of the LLE, the distribution coefficients between the two phases and the separation factor relative to the target component were calculated:
The solubility of all substances in hexane and heptane is small. Even if the separation factor relative to the target component is very good, the absolute solubility of the
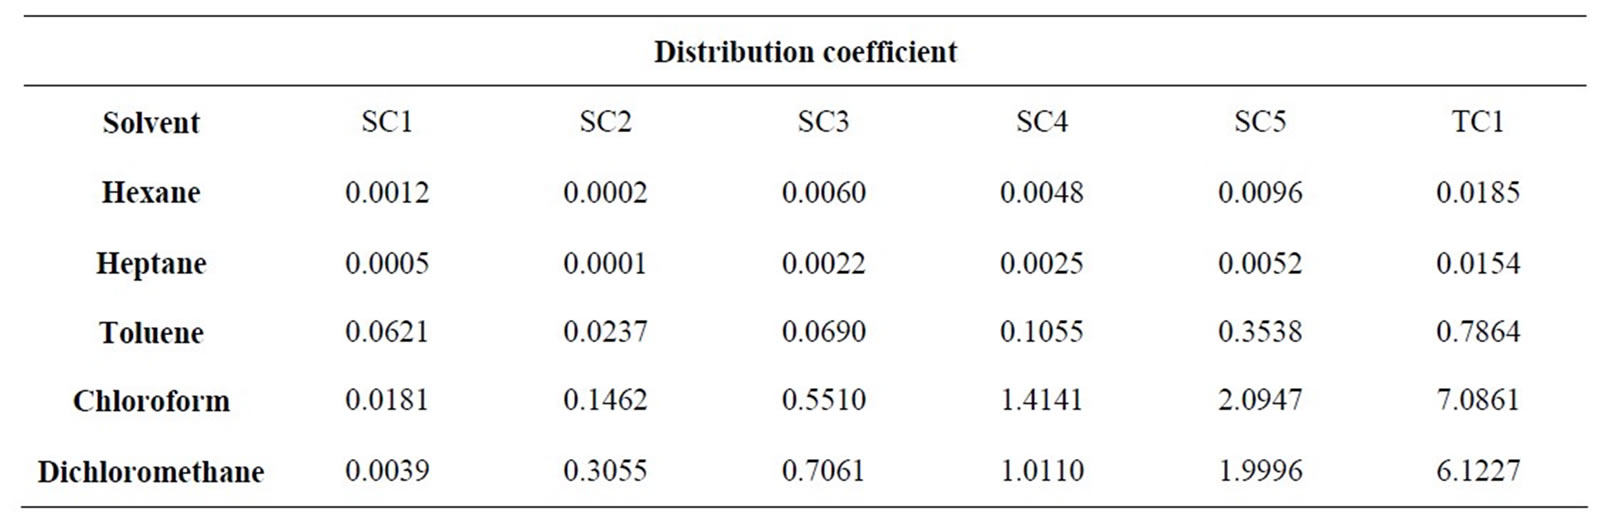
Table 3. Distribution coefficients for LLE.
target component in the extract phase is low.
• Toluene is also not suited for the purification. Although the relative separability of the secondary components to the target component is good, the distribution coefficient is too small for an economic extraction.
• Chloroform and dichloromethane are, however, very efficient at separating minor components nos. 1 - 3. The target component is enriched in the solvent phase more strongly than all the other components. These are ideal conditions for an economic treatment of the target component.
4.1.2.2. Option: Distillation
To test experimentally whether the extract could be separated by distillation, a distillation test is carried out at starting temperatures of 40˚C and 70˚C. The pressure in the mini-scale apparatus is gradually lowered until the mixture begins to boil. In advance a DTA analysis for thermal stability of the target components is relevant.
At a fixed temperature, e.g. 40˚C, the mixture in the product vessel is kept at first at atmosphere pressure for about 15 minutes and cycled in the equipment. If a fraction is evaporated and condensed, the fraction is taken out of the recycle until the temperature drops significantly. Than a lower pressure step is adjusted. A clear sign that a balance has been achieved is a constant temperature of each pressure level. Samples are drawn at the top and at the bottom and the pressure is lowered further. The samples are analyzed in HPLC. This results in the following chart, Figure 9.
Figure 9(a) shows the distribution of components between two phases. In this unit operation none of the components goes into the vapor phase to a sufficient degree. During distillation only almost pure solvent evaporates. Side and target components accumulate in the bottom.
Figure 9(b) depicts the overall mass of the individual components in the vapor phase. At 90 mbar over 50% of the solvent has already been evaporated. Side component
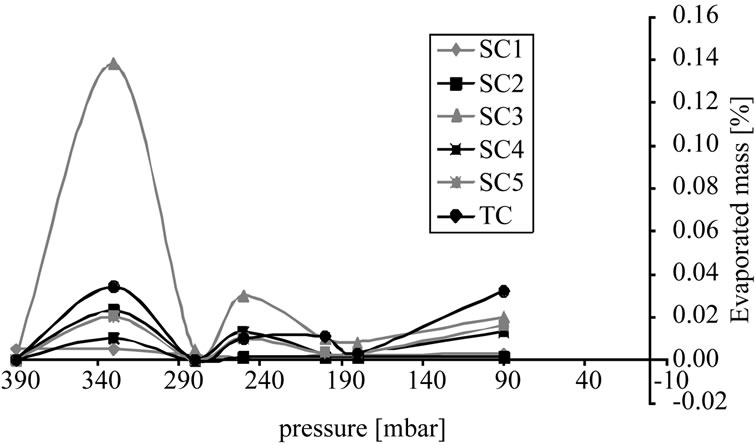 (a)
(a)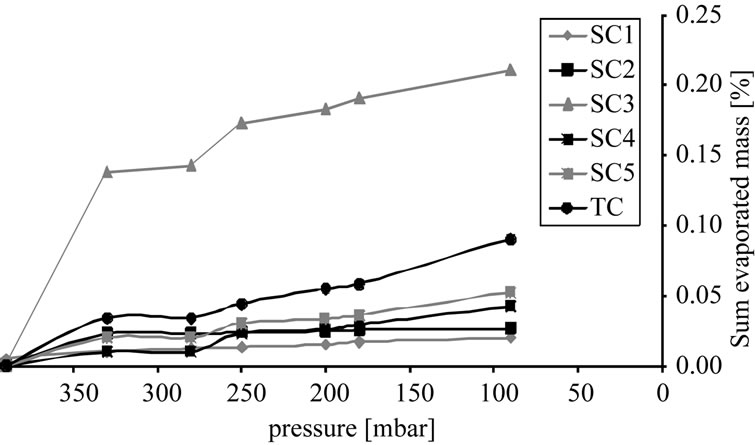 (b)
(b)
Figure 9. Percentage of vaporized mass, (a) Sample concentration; (b) Cumulative curve.
3 is the most volatile substance, but even at 90 mbar there is only around 0.22% of the total mass in the gas phase. As a consequence, an economic purification of the target component by distillation is not feasible.
4.1.3. Data Evaluation
By summing up the knowledge gained from the distillation and liquid-liquid-experiments, it is possible to draw the following partition of physicochemical equilibrium parameters, shown in Figure 10.
By summarizing the measured data as shown in Figure 10, the benefit of liquid-liquid extraction can be seen
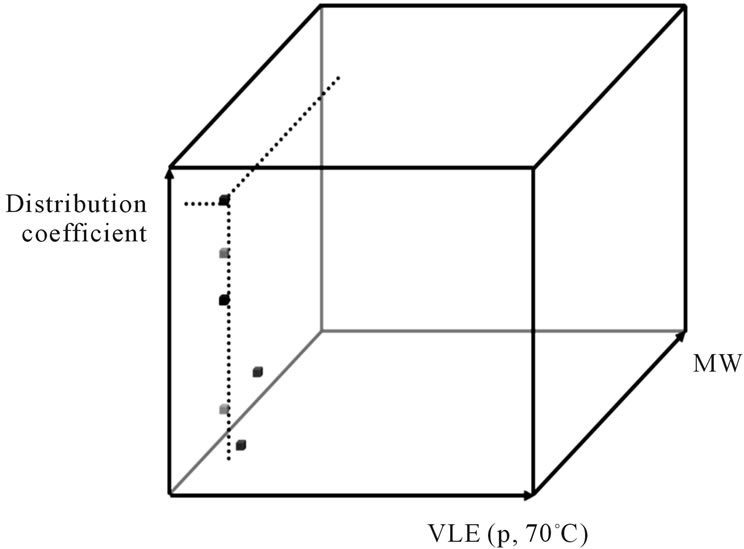
Figure 10. Partition of physicochemical equilibrium parameter.
at a glance.
4.1.4. Model-Based Process Design and Calculation of Separation Costs
The experimentally determined partition coefficients and estimated model parameters for mass-transfer kinetics and fluid dynamics are used for a first cost estimate of the purification of the target component.
Simulations show that by using liquid-liquid extraction, it is possible to separate the first three side components from the target component with an acceptable number of theoretical stages.
To understand the influence of mass-transfer kinetics and fluid dynamics, the mass-transfer coefficient was increased by a factor of 10 to simulate equilibrium conditions and reduced by a factor of 10 to simulate masstransfer limitations. In addition fluid dynamics was varied between by a factor of 10. The results in the change of the separation costs are shown in chapter 4.1.5.
Process Proposal and Design
For process simulation the following parameters were used: 10 m3/h feed with a target and side component concentration of 10 g/L, a water phase of 10 m3/h and organic phase of 10 m3/h. For the equilibrium conditions the experimentally-determined values are used, while the kinetics are taken into account by a mass transfer coefficient of 0.05 m/hr calculated according to Schmidt/ Shearwood/Reynolds-correlation as a first approximation.
The result for the separation of this mixture is 10 theoretical stages, a feed inlet on stage 4 as shown in Figure 11. From the results it is clear that a complete separation of the target and side components 1 to 3 is possible. Although the column is designed to remove the side components 4 and 5 from the aqueous phase using the 6 stages above the feed inlet, it is only possible to reduce the concentration of these substances. This effect can be well observed in the column profile shown in Figure 11.
4.1.5. Separation Cost Estimation
Based on the target component, the separation costs are estimated to be about 0.17 EUR/kg. To examine the sensitivity of the cost to kinetics, the mass transfer coefficient and axial dispersion are varied.
• The reduction of the mass transfer coefficient by a factor of 100 results in a separation cost increase of 4.5%.
• With a change fluid dynamic, from plug flow to a flow regime which is dominated by axial dispersion, the separation cost increases by up to 48%, as can be seen from Figure 12.
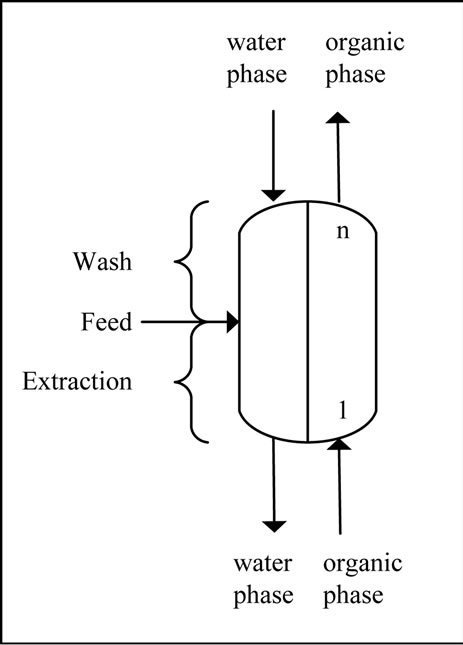
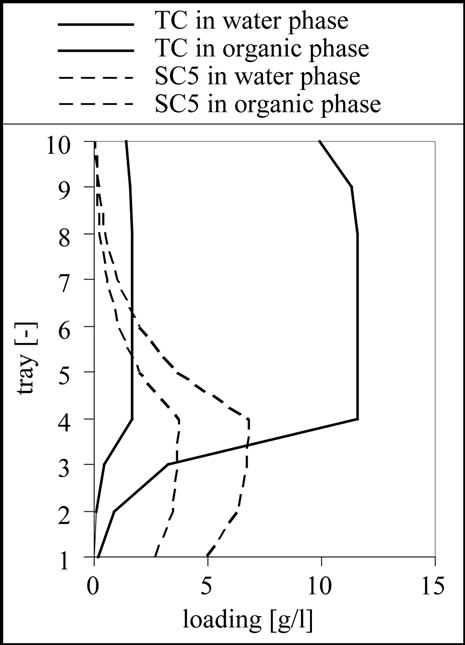
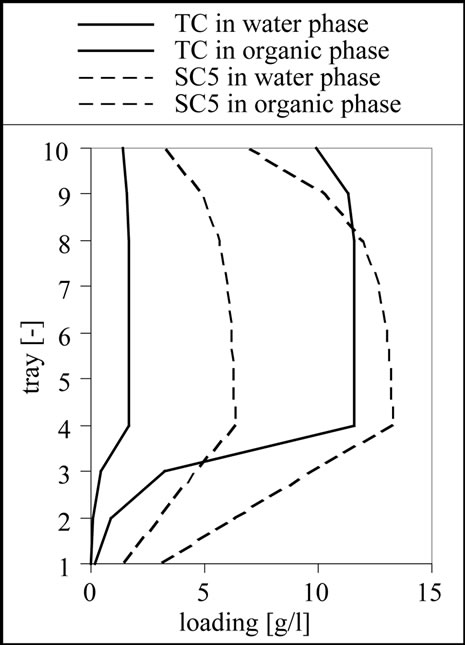
Figure 11. Column profile for the target component (TC) as well as for the side component 3 (SC3) and 5 (SC5).
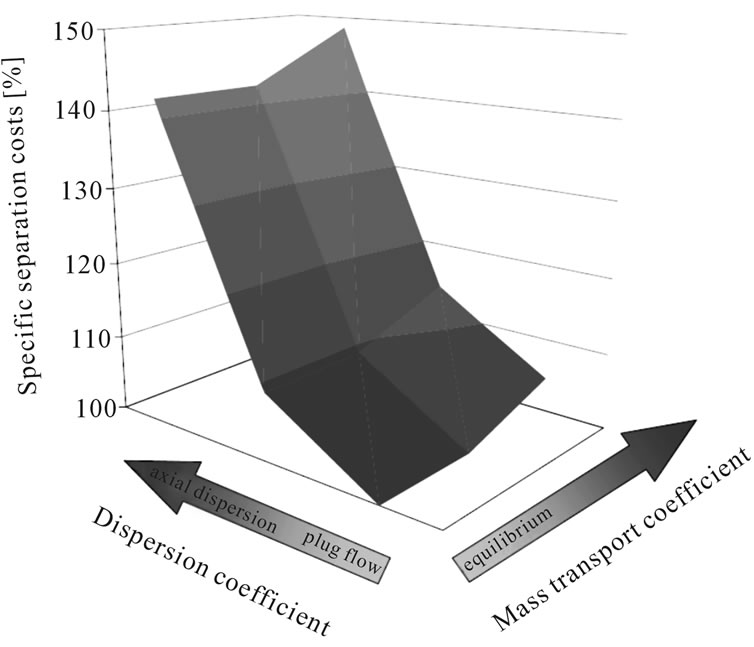
Figure 12. Change of separation costs due to variation in model parameters.
4.2. System 2: Tea Aroma
The second system is a solid-liquid extract made by percolation of a tea with ethyl-acetate. The ingredient substances were analyzed by gas chromatography (GC) with a flame ionization detector (FID). For the preparation of this extract the tea is percolated by ethyl-acetate. The extract produced by this percolation consists in large part of caffeine, matrix components, catechins, chlorophyll and, in smaller parts, of a variety of flavor compounds, which are shown in Table 4.
4.2.1. Data for Potential Unit Operation
For this example initially a separation by liquid-liquid extraction was investigated. Crystallization was not considered as a first step in this work, because of its solidhandling complexity. Membranes are not suitable because of the small molecular weights involved.
The pre-selection-system, Figure 7, shown above, can be used in this case to limit the number of experiments:
The flavors like linalool, geraniol, and guaiacol are part of the main groups “terpenoids” and “phenols” and should be soluble—according to Figure 7—in polar to medium polar solvents.
• Caffeine can be extracted as a substance of the main group “nitrogen-containing substances” only in very polar solvents.
• Based on this information and the lack of choice of solvents that are immiscible with ethyl-acetate, water was chosen as the counter-phase. According to the scheme shown in Figure 7, caffeine should pass into the aqueous phase, and the flavors tend to remain in the less polar organic ethyl-acetate phase.
The experiments for the model parameter determination for the LLE are performed as described above. The only possible solvent, which does not dissolve completely in ethyl-acetate, is water. The experimental determination of distribution coefficients in the shaking experiments produces the results shown in Table 4.
The separation factors indicate a very strong enrichment of the flavors in the organic phase (upper phase, uP), while caffeine passes into the aqueous phase (lower phase, lP).
4.2.2. Process Design and Cost Estimation
The cost calculation for a separation of flavors and caffeine in the organic and the aqueous phase results in the following process parameters and structure: with plug flow, a mass transfer coefficient of 0.1 m/hr and for a caffeine purity of 99.99% with a caffeine-yield of 99.98%, the separation costs are about 7 EUR/kg. In order to examine the sensitivity of the result to kinetics and fluid dynamics, the mass transfer coefficient and fluid dynamic non idealities have been varied.
• The reduction of the mass transfer coefficient by a factor of 10 from 0.1 to 0.01 m/h results in a separation cost increase of 18%.
• With the increase of fluid dynamic non idealities, a separation cost increase of up to 34% occurs. This can be seen from Figure 13.
Résumé:
• The cost calculations for vanilla and for tea extract show very different influences of mass transfer coefficient and fluid dynamics.
• Any change in these parameters does not always have the same influence on the separation costs, but the influence is significant and has to be considered individually for each system.
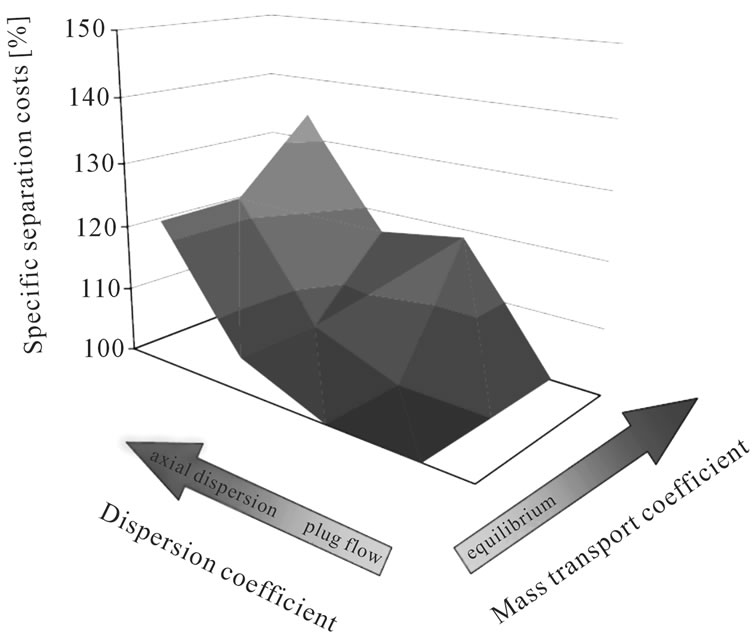
Figure 13. Separation cost increase with variation of kinetic and fluid dynamic—tea aroma.

Table 4. Distribution coefficients and derivations.
• Therefore, with the aid of detailed models, both influences must be included in cost accounting. Sensitivity studies have to be carried out individually for each system under consideration.
5. Discussion and Conclusions
The aim of this work is to propose and prove an initial systematic methodology and the necessary tools required for the conceptual process design of complex mixtures. First, it was shown that a modeling depth is required which does not only take separation coefficients (so called short-cut-models) into account but also mixture phase equilibrium as well as mass transfer coefficient and axial dispersion fluid dynamic non-idealities. With the aid of such models of different unit operations, any first process could be proposed, designed, evaluated and then chosen on the basis of separation cost calculations.
Even in the conceptual process development and design stages of a project, thermodynamic equilibrium data has to be measured experimentally at laboratory scale using minimal volumes and with sufficient accuracy. Mass transfer coefficients, in addition to axial dispersion fluid dynamics parameters must also be estimated using pre-existing knowledge and/or correlations.
The currently known approaches for the determination of the thermodynamic equilibrium data of complex mixtures can be divided into three schemes. An approach for complex mixtures, which is based on molecular structure and databases of physical properties is not feasible. This is because only about 5% of data for plant-based extract components are available [10-15,18,24-30].
Based on this evaluation, only an experimental determination of model-parameters is feasible for complex systems. It reduces the time and cost-intensive laboratory work most effectively. To determine model parameters for all unit operations known in separation engineering, miniaturized laboratory experiments and standardized experimental procedures were designed and the minimal required sample volumes were determined via error calculations. The experimental plan and the volumes needed could be reduced significantly to a magnitude of about 1 l broth.
The developed experimental approaches were tested successfully using two different plant extracts. The results show that mass transport and fluid dynamic parameters have a significant impact on the costs. Therefore it is necessary to have good estimates of the parameters and then to proof them in the later process development.
Moreover, the results confirmed that the pre-selection of unit operations, based on molecular group membership of target and side component, reduces the experimental plan drastically. Such a pre-selection scheme is proposed in this work. The developed method is now available for use on other complex mixtures and can be further verified by comparison to already existing processes.
6. Acknowledgements
The authors thank their colleagues at the Institute of Separation and Process Technology at Clausthal University of Technology especially Markus Kassing, Christian Borrmann, Florian Grote, Christoph Helling and Holger Fröhlich for many fruitful discussions. Kaspar Hallenberger and Werner Bäcker (both Bayer Technology Services GmbH, Leverkusen) are acknowledged for their experimental advice based on a broad industrial experience. Urban Jenelten and Jonas Schenk from Firmenich S. A., Genevea and Bernd Bonnländer from Plantextrakt, Vestenbergsgreuth assisted with analytical and component-specific demands.
REFERENCES
- A. Mersmann, M. Kind and J. Stichlmair, “Thermische Verfahrenstechnik. Grundlagen und Methoden,” Springer, Berlin, 2005.
- J. C. Brunet and Y. A. Liu, “Studies in Chemical Process Design and Synthesis, 10. An Expert System for Solvent-Based Separation Process Synthesis,” Industrial & Engineering Chemistry Research, Vol. 32, No. 2, 1993, pp. 315-334. doi:10.1021/ie00014a010
- G. Schembecker and K. H. Simmrock, “Heuristic-Numeric Design of Separation Processes for Azeotropic Mixtures,” Computers & Chemical Engineering, Vol. 21, 1997, pp. 231-236.
- M. Hurmw and M. Jarvelainen, “Combined Process Synthesis and Simulation System for Feasiilty Studies,” Computers & Chemical Engineering, Vol. 19, 1995, pp. 663-668. doi:10.1016/0098-1354(95)87111-X
- E. Blass, “Methoden, Zielsuche, Lösungssuche, Lösungsauswahl,” Springer, Berlin, 1997.
- R. Manski and H. J. Bart, “Gleichgewichtsmodellierung bei der Trennung von Cobalt und Nickel durch Reaktivextraktion,” Chemie Ingenieur Technik, Vol. 76, No. 7, 2004, pp. 924-929. doi:10.1002/cite.200400075
- M. Franke, A. Górak and J. Strube, “Auslegung und Optimierung von Hybriden Trennverfahren,” Chemie Ingenieur Technik, Vol. 76, No. 3, 2004, pp. 199-210. doi:10.1002/cite.200406150
- M. B. Franke, N. Nowotny, E. N. Ndocko, A. Gorak and J. Strube, “Design and Optimization of a Hybrid Distillation/Melt Crystallization Process,” AIChE Journal, Vol. 54, No. 11, 2008, pp. 2925-2942. doi:10.1002/aic.11605
- Dechema: Detherm, 2011. http://i-systems.dechema.de/detherm/detherm.php
- DDBST, 2011. http://www.ddbst.com/
- Spectral Database for Organic Compounds SDBS, 2010. http://riodb01.ibase.aist.go.jp/sdbs/
- NIST Chemistry WebBook, 2011. http://webbook.nist.gov/chemistry/
- CHEMnetBASE, 2011. http://www.chemnetbase.com/
- J. Gmehling, “Present Status and Potential of Group Contribution Methods for Process Development,” The Journal of Chemical Thermodynamics, Vol. 41, No. 6, 2009, pp. 731-747. doi:10.1016/j.jct.2008.12.007
- J. Gmehling and C. Mollman, “Synthesis of Distillation Processes Using Thermodynamic Models and the Dortmund Data Bank,” Industrial & Engineering Chemistry Research, Vol. 37, No. 8, 1998, pp. 3112-3123. doi:10.1021/ie970782d
- J. R. Rarey and J. Gmehling, “Factual Data Banks and Their Application to the Synthesis and Design of Chemical Processes and the Development and Testing of Thermophysical Property Estimation Methods,” Pure and Applied Chemistry, Vol. 81, No. 10, 2009, pp. 1745-1768. doi:10.1351/PAC-CON-08-11-17
- R. von Watzdorf, J. Bausa and W. Marquardt, “Shortcut Methods for Nonideal Multicomponent Distillation: 2. Complex Columns,” AIChE Journal, Vol. 45, No. 8, 1999, pp. 1615-1628. doi:10.1002/aic.690450803
- R. Urdaneta, J. Bausa, S. Brüggemann and W. Marquardt, “Analysis and Conceptual Design of Ternary Heterogeneous Distillation Processes,” Industrial & Engineering Chemistry Research, Vol. 41, 2002, pp. 3849-3866. doi:10.1021/ie0107486
- M. E. Lienqueo, A. Mahn, G. Navarro, J. C. Salgado, T. Perez-Acle, I. Rapaport and J. A. Asenjo, “New Approaches for Predicting Protein Retention Time in Hydrophobic Interaction Chromatography,” Journal of Molecular Recognition, Vol. 19, No. 4, 2006, pp. 260-269. doi:10.1002/jmr.776
- M. E. Lienqueo, E. W. Leser and J. A. Asenjo, “An Expert System for the Selection and Synthesis of Multistep Protein Separation Processes,” Computers & Chemical Engineering, Vol. 20, 1, 1996, pp. 189-194. doi:10.1016/0098-1354(96)00042-7
- P. Scherpian and G. Schembecker, “Scaling-Up Recycling Chromatography,” Chemical Engineering Science, Vol. 64, No. 18, 2009, pp. 4068-4080. doi:10.1016/j.ces.2009.06.024
- R. Faber, P. Li and G. Wozny, “Sequential Parameter Estimation for Large-Scale Systems with Multiple Data Sets. 1. Computational Framework,” Industrial & Engineering Chemistry Research, Vol. 42, No. 23, 2003, pp. 5850-5860. doi:10.1021/ie030296s
- R. Faber, P. Li and G. Wozny, “Sequential Parameter Estimation for Large-Scale Systems with Multiple Data Sets. 2. Application to an Industrial Coke-Oven-Gas Purification Process,” Industrial & Engineering Chemistry Research, Vol. 43, No. 15, 2004, pp. 4350-4362. doi:10.1021/ie0305622
- R. Faber, H. Arellano-Garcia, P. Li and G. Wozny, “An Optimization Framework for Parameter Estimation of Large-Scale Systems,” Chemical Engineering and Processing, Vol. 46, No. 11, 2007, pp. 1085-1095. doi:10.1016/j.cep.2007.02.019
- A. Fredenslund, R. L. Jones and J. M. Prausnitz, “GroupContribution Estimation of Activity Coefficients in Nonideal Liquid Mixtures,” AIChE Journal, Vol. 21, No. 6, 1975, pp. 1086-1099. doi:10.1002/aic.690210607
- F. Eckert and A. Klamt, “Fast Solvent Screening via Quantum Chemistry. COSMO-RS Approach,” AIChE Journal, Vol. 48, No. 2, 2002, pp. 369-385. doi:10.1002/aic.690480220
- A. Mahn, G. Zapata-Torres and J. A. Asenjo, “A Theory of Protein-Resin Interaction in Hydrophobic Interaction Chromatography,” Journal of Chromatography A, Vol. 1066, No. 1-2, 2005, pp. 81-88. doi:10.1016/j.chroma.2005.01.016
- J. C. Salgado, I. Rapaport and J. A. Asenjo, “Predicting the Behaviour of Proteins in Hydrophobic Interaction Chromatography 1: Using the Hydrophobic Imbalance, No. HI) to Describe Their Surface Amino Acid Distribution,” Journal of Chromatography A, Vol. 1107, No. 1-2, 2006, pp. 110-119. doi:10.1016/j.chroma.2005.12.032
- J. C. Salgado, I. Rapaport and J. A. Asenjo, “Predicting the Behaviour of Proteins in Hydrophobic Interaction Chromatography 2. Using a Statistical Description of Their Surface Amino Acid Distribution,” Journal of Chromatography A, Vol. 1107, No. 1-2, 2006, pp. 120- 129. doi:10.1016/j.chroma.2005.12.033
- J. C. Salgado, B. A. Andrews, M. F. Ortuzar and J. A. Asenjo, “Prediction of the Partitioning Behaviour of Proteins in Aqueous Two-Phase Systems Using Only Their Amino Acid Composition,” Journal of Chromatography A, Vol. 1178, No. 1-2, 2008, pp. 134-144. doi:10.1016/j.chroma.2007.11.064
- K. J. Siebert, “Modeling Protein Functional Properties from Amino Acid Composition,” Journal of Agricultural and Food Chemistry, Vol. 51, No. 26, 2003, pp. 7792- 7797. doi:10.1021/jf0342775
- F. Hachem, B. A. Andrews and J. A. Asenjo, “Hydrophobic Partitioning of Proteins in Aqueous Two-Phase Systems,” Enzyme and Microbial Technology, Vol. 19, No. 7, 1996, pp. 507-517. doi:10.1016/S0141-0229(96)80002-D
- B. A. Andrews, A. S. Schmidt and J. A. Asenjo, “Correlation for the Partition Behavior of Proteins in Aqueous Two-Phase Systems: Effect of Surface Hydrophobicity and Charge,” Biotechnology and Bioengineering, Vol. 90, No. 3, 2005, pp. 380-390. doi:10.1002/bit.20495
- C. A. Haskard and E. C. Li-Chan, “Hydrophobicity of Bovine Serum Albumin and Ovalbumin Determined Using Uncharged, and Anionic, ANS, Fluorescent Probes,” Journal of Agricultural and Food Chemistry, Vol. 46, No. 7, 1998, pp. 2671-2677. doi:10.1021/jf970876y
- C. B. Mazza, N. Sukumar, C. M. Breneman and S. M. Cramer, “Prediction of Protein Retention in Ion-Exchange Systems Using Molecular Descriptors Obtained from Crystal Structure,” Analytical Chemistry, Vol. 73, No. 22, 2001, pp. 5457-5461. doi:10.1021/ac010797s
- A. Ladiwala, K. Rege, C. M. Breneman and S. M. Cramer, “A Priori Prediction of Adsorption Isotherm Parameters and Chromatographic Behavior in Ion-Exchange Systems,” Proceedings of the National Academy of Sciences of the USA, Vol. 102, No. 33, 2005, pp. 11710-11715. doi:10.1073/pnas.0408769102
- G. Malmquist, U. H. Nilsson, M. Norrman, U. Skarp, M. Stromgren and E. Carredano, “Electrostatic Calculations and Quantitative Protein Retention Models for Ion Exchange Chromatography,” Journal of Chromatography A, Vol. 1115, No. 1-2, 2006, pp. 164-186. doi:10.1016/j.chroma.2006.02.097
- L. Xu and C. E. Glatz, “Predicting Protein Retention Time in Ion-Exchange Chromatography Based on threeDimensional Protein Characterization,” Journal of Chromatography A, Vol. 1216, No. 2, 2009, pp. 274-280. doi:10.1016/j.chroma.2008.11.075
- Z. Gu and C. E. Glatz, “A Method for Three-Dimensional Protein Characterization and Its Application to a Complex Plant, Extract,” Biotechnology and Bioengineering, Vol. 97, No. 5, 2007, pp. 1158-1169. doi:10.1002/bit.21310
- A. Aberham, V. Pieri, E. M. Croom, E. Ellmerer and H. Stuppner, “Analysis of Iridoids, Secoiridoids and Xanthones in Centaurium erythraea, Frasera caroliniensis and Gentiana lutea Using LC-MS and RP-HPLC,” Journal of Pharmaceutical and Biomedical Analysis, Vol. 54, No. 3, 2011, pp. 517-525. doi:10.1016/j.jpba.2010.09.030
- I. Carpinteiro, M. Ramil, I. Rodriguez and R. Cela, “Determination of Fungicides in Wine by Mixed-Mode Solid Phase Extraction and Liquid Chromatography Coupled to Tandem Mass Spectrometry,” Journal of Chromatography A, Vol. 1217, No. 48, 2010, pp. 7484-7492. doi:10.1016/j.chroma.2010.09.080
- I. J. Colquhoun, “Use of NMR for Metabolic Profiling in Plant Systems,” Journal of Pesticide Science, Vol. 32, No. 3, 2007, pp. 200-212. doi:10.1584/jpestics.R07-03
- W. Eisenreich and A. Bacher, “Advances of High-Resolution NMR Techniques in the Structural and Metabolic Analysis of Plant Biochemistry. Highlights in the Evolution of Phytochemistry: 50 Years of the Phytochemical Society of Europe,” Phytochemistry, Vol. 68, No. 22-24, 2011, pp. 2799-2815. doi:10.1016/j.phytochem.2007.09.028
- V. Exarchou, Y. C. Fiamegos, T. A. van Beek, C. Nanos and J. Vervoort, “Hyphenated Chromatographic Techniques for the Rapid Screening and Identification of Antioxidants in Methanolic Extracts of Pharmaceutically Used Plants. Plant Analysis,” Journal of Chromatography A, Vol. 1112, No. 1-2, 2006, pp. 293-302. doi:10.1016/j.chroma.2005.11.077
- M. Iranshahi, M. Mojarab, H. Sadeghian, M. Y. HanafiBojd and B. Schneider, “Polar Secondary Metabolites of Ferula Persica Roots,” Phytochemistry, Vol. 69, No. 2, 2008, pp. 473-478. doi:10.1016/j.phytochem.2007.08.001
- B. Schneider and D. Hölscher, “Laser Microdissection and Cryogenic Nuclear Magnetic Resonance Spectroscopy: An Alliance for Cell Type-Specific Metabolite Profiling,” Planta, Vol. 225, No. 3, 2007, pp. 763-770. doi:10.1007/s00425-006-0404-z
- J. B. Harborne, H. Baxter and G. P. Moss, “Phytochemical Dictionary. A Handbook of Bioactive Compounds from Plants,” 2nd Edition, Taylor & Francis, London, 1999.
- W. Nelißen, S. Sievers, M. Michel and G. Schembecker, “Entwicklung von Aufreinigungsprozessen für Phytoextrakte,” Poster, 2009.
- E. Stahl and W. Schild, “Isolierung und Charakterisierung von Naturstoffen,” Gustav Fischer Verlag, Stuttgart, 1986.
Nomenclature
s2: Variance of the experimental result;
fK: Measured variable;
ΔfK: Error of measurement;
NOTES
*Corresponding author.