Food and Nutrition Sciences
Vol. 2 No. 4 (2011) , Article ID: 5445 , 6 pages DOI:10.4236/fns.2011.24050
The Use of Solid State NMR to Evaluate the Carbohydrates in Commercial Coffee Granules
![]()
1Departamento de Química da, Universidade Federal de Sao Carlos, Sao Carlos, Brasil; 2Institutito de Macromoléculas, Universidade Federal do Rio de Janeiro, Rio de Janeiro, Brasil; 3Escola Técnica Federal de, Minas Gerais, Brasil.
Email: mibt@ima.ufrj.br, mibtima@bol.com.br
Received June 10th, 2010; revised August 10th, 2010; accepted January 12th, 2011.
Keywords: Solid State, NMR, Coffee
ABSTRACT
Coffee brings many health benefits due to its chemical constituents. Based on this information, it is essential to know the main chemical compounds from coffee granules; the intermolecular interaction among the coffees compounds and the molecular components homogeneity. In this study six types of roasted commercial coffee were evaluated by solid state nuclear magnetic resonance (NMR), employing carbon-13 (13C) and hydrogen (1H) nucleus. Carbon-13 was analyzed applying high field NMR techniques, such as: magic angle spinning (MAS); magic angle spinning with cross-polarization (CPMAS) and magic angle spinning with cross-polarization and dipolar dephasing (CPMASDD). The hydrogen was evaluated via relaxation times. Proton spin-lattice relaxation time in the rotating frame was determined through the carbon-13 decay, during the variable contact-time experiment, using high field NMR. Proton spin-lattice relaxation time was determined through the inversion-recovery pulse sequence, using low field NMR. Considering all NMR results, it was concluded that the major coffee compounds are: 1) triacilglycerides, which constitute the mobile region in the granule coffee and 2) Carbohydrates such as: polysaccharides and fibers that belong to the rigid domain. These constituents belong to different molecular mobility domain, although they have strong intermolecular interactions due to the granule organization.
1. Introduction
Coffee is very much consumed in Brazil and all over theworld, for this reason it is very well studied [1-5]. Some latest studies have shown that coffee brings a lot of benefits to human health, such as: concentration power, preventing Alzheimer [6-8]; preventing some types of cancer [9-13] and it can also be used as an agent to avoid drugs consumption, because it contains many substances with pharmacological properties, as quinides, for instance. The chemical composition of coffee granules present a great variety of mineral; aminoacids; lipids; triacilglycerides; fatty acids; sugar and clorogenic acids, including alkaloids and caffeine. It should be pointed out that caffeine is present in low percentage (1 to 2.5%) [14]. It is known that when coffee granules are toasted changes in its chemical composition and/or molecular ordination and distribution can be found. We do not have much knowledge of coffee chemical components and its molecular dynamic behavior after being toasted. Many techniques can be used to evaluate toasted coffees; among them solid state nuclear magnetic resonance (NMR) is one of the best techniques for that, because it permits analyzing coffee granules in their total form, and it also informs on chemical structure; components interaction and molecular homogeneity at molecular level [15-19]. Thus, the focus of this work is to evaluate six commercial coffee types, employing solid state NMR techniques, using high and low field NMR. Many nuclei can be investigated by solid state NMR; in this specific case we have chosen carbon-13 and hydrogen nucleus because they can inform on chemical structure and molecular dynamic. The results obtained from these nucleuses will help us to have response on the chemical and molecular behavior from the samples analyzed. Carbon-13 will be evaluated from: a) MAS, which permits using short recycle delay that allows evaluating the mobile coffee granule components [20]; b) CPMAS that analyzes sample focusing the rigid components and c) variable contact-time from which the molecular homogeneity and dispersion can be evaluated.
From variable contact time the values of proton spinlattice relaxation time in the rotating frame can be determined from the decay of all resolved carbons, which permits evaluating the molecular dynamic [21] in the scale of tens of kHz. The 13C CPMASDD experiment was carried out observing the molecular rigid components present in the coffees granules due to the detection of non protonated carbon [21]. Hydrogen nuclei will be also evaluated through the proton relaxation time [22], which will be measured directly in a low filed NMR spectrometer, employing inversion-recovery pulse sequence [23].
2. Experimental
The six commercial roasted coffee samples, obtained in the market, were analyzed to know more about their chemical characteristics. They were divided into three groups named: coffee type 1; coffee type 2 and coffee type 3. Coffee type 1 is formed by decaffeinated coffee (gd); strong coffee (gf); express coffee (ge) and organic coffee (gorg). Coffee type 2 is constituted by organic coffee (org). And coffee type 3 is formed by coffee extra strong (cef). This classification divided into three groups was based on the coffee nature.
Sample Preparation Each one of the six coffee samples was bought on the same day and was kept in their package. The samples were packed in the NMR rotor on the day of analysis.
All solid state RMN spectra were obtained on a VARIAN spectrometer, UNIT-Plus, 9.4 Tesla, operating at 104 MHz for 13C nuclei. The samples were packed in a 7 mm zirconia rotor that was spun in the magic angle at about 6 kHz. The applied techniques to analyze the samples were: magic angle spinning (MAS); cross-polarization magic angle spinning (CPMAS); cross-polarization magic angle spinning with dipolar dephasing (CPMASDD) and variable contact time (VCT). The MAS was recorded with short recycle delay (0.3 s), to investigate the mobile region/chains. The CPMAS were obtained from the VCT experiment, which were carried out using 8 s of recycle delay with the increase of contact time from 200 to 8000 ms. From this experiment it was also determined the proton spin-lattice relaxation time in the rotating frame (T1rH), for each resolved carbon. The low field NMR analyses were done at Maran Ultra 23 (Resonance-Oxford), operating at 23 MHz for protons. It is equipped with an 18 mm variable temperature probe, used for determining of relaxation measurements. Proton spin-lattice relaxation times (T1H) were determined directly by the traditional inversion recovery pulse sequence (180° - t - 90°) the 90° pulse of 4.6 µs was calibrated automatically by the instrument software. The amplitude of the FID was sampled for twenty t data points, ranging from 0.1 to 5000 ms, with 4 scans for each point and 5 s of recycle delay. The relaxation values and relative intensities were obtained by fitting the exponential data with the aid of the program WINFIT. Distributed exponential fittings as a plot of relaxation amplitude versus relaxation time were performed by using the software WINDXP.
3. Results and Discussion
From the 13C NMR MAS spectra (Figure 1) it was identified signals which refer to carbons which belong to the mobile region present in the coffee samples (Table 1), due to the use of short recycle delay between 90 degree pulses. Thus, only signals from the triacilglycerides were detected. Table 2 shows the carbon type and the chemical shift assignment of 13C NMR MAS spectra of coffee samples.
Taking into account the 13C NMR MAS results, another technique applied was VCT experiment, which allows observing the decay pattern of coffee samples. In this experiment the contact time varied from short values (0.2 ms) to long values (8 ms). Figure 2 shows the pattern obtained from each coffee sample. VCT decay of coffees behaves as heterogeneous materials, because, at least, two domains with different molecular mobility were observed: one located at short contact-time, TCH= 0.4 ms, which refers to polysaccharides and fibers, and the other one located at long contact-times, TCH = 4 and 8 ms, due to triacilglycerides constituents.
Comparing the profile of VCT decay for the coffees of type 1, all of them present more than one domain, excluding 1 gf, which posses a more homogeneous distribution of the constituents. It is due to the low oil content and a signal located at 30 ppm that refers to the protein and/or fibers. The other coffees analyzed present at least two domains: one related to the polysaccharides and the other one from the oil (triacilglycerols with long molecular chains). Analyzing the two types of organic coffees, the 2 org coffee presents much quantity of oil than 1 gorg coffee.
From the VCT experiment, it was obtained the 13C CPMAS spectra with different contact-times. From these series, it was also obtained the optimum contact-time, which was 0.4 ms for 1 gd coffee; 1 ms for 1 gorg coffee and 0.8 ms for the others. These data reveal that 1 gd coffee has a great contribution from the rigidity domain in comparison to the others, because of the low contacttime for the polarization transfer. The coffee 1 gorg posses, at least, two domains with distinct molecular mobility, one has higher molecular mobility and the other one lower molecular mobility. Coffee 1 gorg has a short optimum contact-time, indicating that this coffee type is a

Figure 1. 13C NMR MAS – (a) 1gorg and (b) 1gd.

Table 1. Chemical shift assignments of 13C NMR MAS of coffee samples.
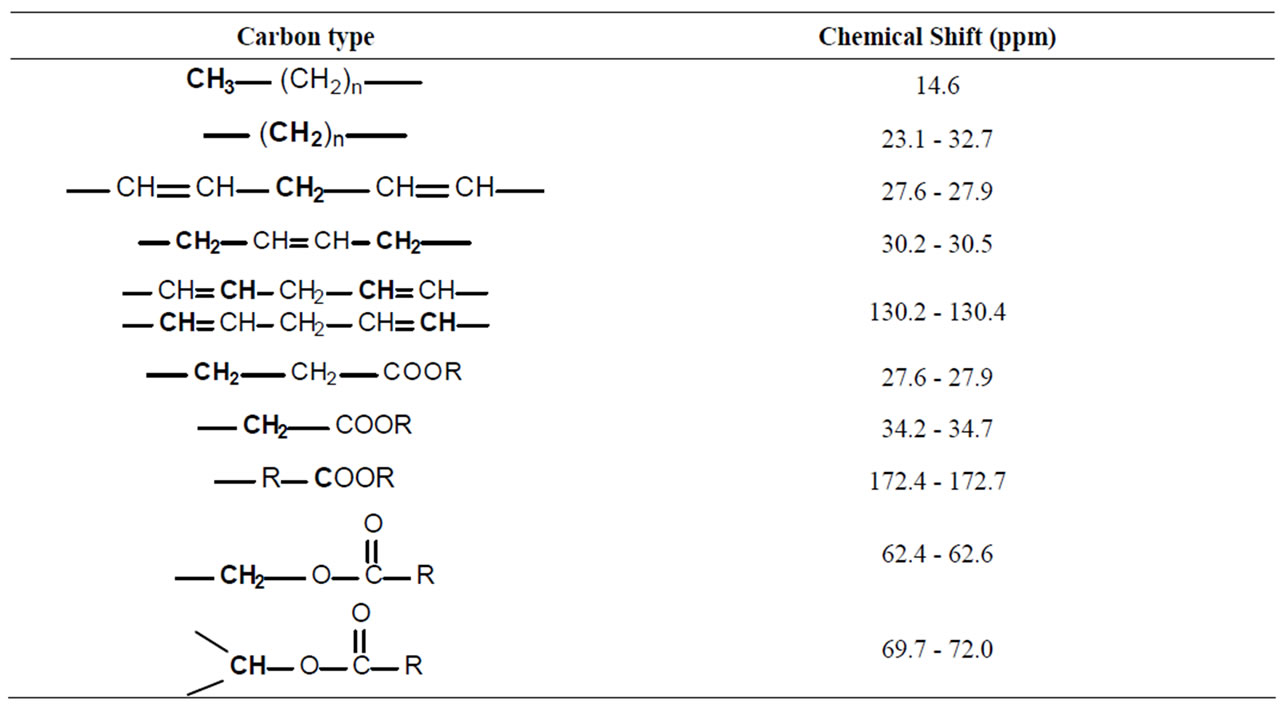
Table 2. Carbon type and the chemical shift assignment of 13C NMR MAS spectra of coffee samples.

Figure 2. 13C NMR VTC experiment for coffee samples: (a) 1gd; (b) 1gf; (c) 1ge; (d) 1gorg; (e) 2org; (f) 3ef.
heterogeneous material. Signals which refer to polysaccharides were detected at: 62 ppm (CH2-O), 72 ppm (CH-O) and 102 ppm (CH-O-CH). For all coffees one large signal centered at 30 ppm, derived from CH2 groups were detected, which can be due to protein and/or fibers (Figure 3).
T1rH values are important information obtained from VCT experiment. They were determined through the VCT decays as far as the contact time increases. Table 3 shows the values of this parameter, determined for all resolved carbons, which were derived from the polysaccharides, assigned at: 103 ppm, 72 ppm and 62 ppm.
According to the relaxation values 1 gf and 1 gd coffees presented better homogeneity at the molecular level, which can be due to the molecular arrangement and ordination in the granule, compared to the other coffees investigated. The coffee 1 gorg is the most heterogeneous coffee type, probably due to its molecular organization, because of its components distribution and intermolecular interactions. The changes in the molecular mobility can have the following contributions: 1) oil quantity and distribution, 2) molecular interactions and 3) granular constituted organization. No significant difference was found between 2 org and 3 cef coffees in relation to the molecular organization, therefore, they are different from all type1 coffees.
In order to obtain more responses on constituted distribution in the coffee granules, CPMASDD technique

Figure 3. 13C NMR CPMAS for coffee samples: (a) 1gd; (b) 1gf; (c) 1gorg; (d) 2org; (e) 3ef.

Table 3. T1rH values for coffee samples.
was used. Generally, 13C NMR CPMASDD technique only shows signals which refers to the non-hydrogenated carbons, although the methyl group and other carbons can also be detected due to its high molecular mobility. For the analyzed coffees, the carbonyl carbons were detected from 177.3 to 171.2 ppm, based on the coffee type/nature (Table 4). The chemical shift of coffee 1 gorg is related to carbonyl group that presents small triacylglycerols chains, confirming the presence of more than one domain, with distinct molecular mobility.
To have more information on coffees behavior, they were analyzed by low field NMR, employing the determination of proton spin-lattice relaxation time (T1H). The values of this parameter for all coffees are listed in Table 5.
From the data showed in Table 5 the values of T1H can be extracted and interpreted in two ways:
1) One is related to the T1H values determined from one curve fit, which has a major influence from the do-

Table 4. Chemical shifts assignments from the 13C NMR CPMASDD.
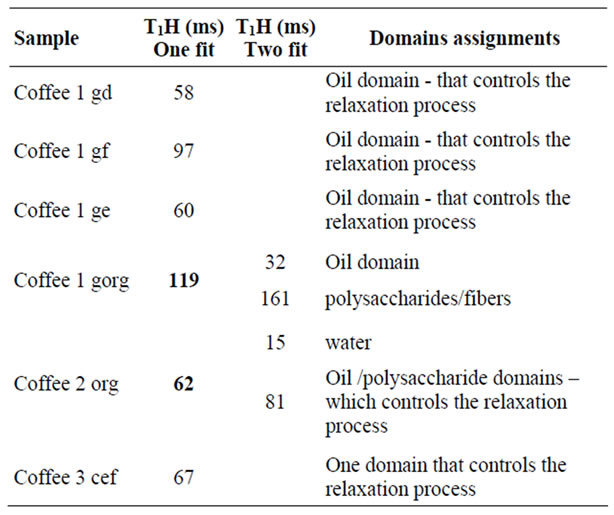
Table 5. T1H data for coffee samples, determined from low field NMR.
main that controls the relaxation process. In this sense, Coffee 1 gf and Coffee 1 gorg have this parameter influenced by the polysaccharides, while for the other coffees their relaxation parameters has more influence from the oil domain, confirming their heterogeneity;
2) Analyzing the domains distribution values of T1H, it is obvious that Coffee 1gorg has a rigid domain that controls the relaxation process.
Figure 4 exhibits the distribution of relaxation data for the Coffee 1 gorg (A) and Coffee 2 org (B). Both samples presented 4 relaxation times that are related to different molecular domains: two of them, which present lower relaxation values, were related to free water and the other two referred to water associated to oil and interacting with the polysaccharides, respectively. Therefore, for coffee 1 gorg, the relaxation value for the rigid domain was formed by much stronger interactions, because it presents a higher relaxation value and for the coffee 2 org the relaxation values did not have the same behavior. Normally the longer relaxation time controls the relaxation process and for this sample longer relaxation time has lower influence on this process due to its proportion in relation to the other. The relaxation data

Figure 4. domain distribution curves for (a) Coffee 1 gorg; (b) Coffee 2 org * - free water.
and the domain distribution suggest that the domains on both coffees are organized differently, promoting multiple intermolecular interactions.
4. Conclusions
According to the main objective of this work, it can be concluded that the major coffee components are: triacilglycerides, which constitute the mobile region in the granule coffee; and carbohy-drates/fibers which belong to the rigid domain. Although these constituents are located in different regions, it is relevant to mention that they have strong intermolecular interactions with water and its molecular arrangements have been influenced by the distribution of constituents.
5. Acknowledgements
To FINEP, FAPESP, CAPES and CNPq.
REFERENCES
- M. El Yacoubi, et al., “The Stimulant Effects of Caffeine on Locomotor Behaviour in Mice are Mediated through Its Blockade of Adenosine A2A Receptors,” British Journal of Pharmacology, Vol. 129, No. 7, 2000, pp. 1465- 1473. doi:10.1038/sj.bjp.0703170
- J. W. Daly and B. B. Fredholm, “Caffeine—An Atypical Drug of Dependence,” Drug and Alcohol Dependence, Vol. 51, No. 1, 1998, pp. 199-206. doi:10.1016/S0376-8716(98)00077-5
- M. N. Clifford and J. R. Ramirez-Martinez, “Phenols and Caffeine in Wet-Processed Coffee Beans and Coffee Pulp,” Food Chemistry, Vol. 40, No. 1, 1991, pp. 35-42. doi:10.1016/0308-8146(91)90017-I
- A. M. N. G. Correia, et al., “Caffeoyl–Tyrosine and Angola II as Characteristic Markers for Angolan Robusta Coffees,” Food Chemistry, Vol. 53, No. 3, 1995, pp. 309- 313. doi:10.1016/0308-8146(95)93938-N
- A. Farah, et al., “Effect of Roasting on the Formation of Chlorogenic Acids Lactones in Coffee,” Journal of Agricultural and Food Chemistry, Vol. 53, No. 5, 2005, pp. 1505-1513. doi:10.1021/jf048701t
- J. L. B. Quintana, et al., “Alzheimer’s Disease and Coffee: A Quantitative Review,” Neurology Research, Vol. 29, No. 1, 2007, pp. 91-95. doi:10.1179/174313206X152546
- G. W. Arendash, et al., “Caffeine Protects Alzheimer’s Mice against Cognitive Impairment and Reduces Brain β-Amyloid Production,” Neuroscience, Vol. 142, No. 4, 2006, pp. 941-952. doi:10.1016/j.neuroscience.2006.07.021
- T. Giovannetti, et al., “Coffee with Jelly or Unbuttered Toast: Commissions and Omissions Are Dissociable Aspects of Everyday Action Impairment in Alzheimer’s Disease,” Neuropsychology, Vol. 22, No. 5, 2008, pp. 235-245. doi:10.1037/0894-4105.22.2.235
- F. Bravi, et al., “Coffee Drinking and Hepatocellular Carcinoma Risk: A Meta-Analysis,” Hepatology, Vol. 46, No. 2, 2007, pp. 430-435. doi:10.1002/hep.21708
- S. C. Larsson and A. Wolk, “Coffee Consumption and Risk of Liver Cancer: A Meta-Analysis,” Gastroenterology, Vol. 132, No. 5, 2007, pp. 1740-1745. doi:10.1053/j.gastro.2007.03.044
- K. Wakai, et al., “Liver Cancer Risk, Coffee, and Hepatitis C Virus Infection: A Nested Case-Control Study in Japan,” British Journal of Cancer, Vol. 97, 2007, pp. 426-428. doi:10.1038/sj.bjc.6603891
- J. Kotsopoulos, et al., “The CYP1A2 Genotype Modifies the Association between Coffee Consumption and Breast Cancer Risk among BRCA1 Mutation Carriers,” Cancer Epidemiol Biomarkers Prevention, Vol. 16, No. 5, 2007, pp. 912-916. doi:10.1158/1055-9965.EPI-06-1074
- S. Merighi, et al., “Caffeine Inhibits Adenosine-Induced Accumulation of Hypoxia-Inducible Factor-1{Alpha}, Vascular Endothelial Growth Factor, and Interleukin-8 Expression in Hypoxic Human Colon Cancer Cells,” Molecular Pharmacologycal, Vol. 72, No. 2, 2007, pp. 395- 406.
- L. A. Tavares and A. G. Ferreira, “Análise Qualie Quantitativa de Cafés Comerciais via Ressonância Magnética Nuclear,” Química Nova, Vol. 29, No. 5, 2006, pp. 911-915. doi:10.1590/S0100-40422006000500005
- R. F. Nogueira and M. I. B. Tavares, “Carbon-13 Solution and Solid-State NMR Investigation of Alpha-Methylstyrene-co-Acrylonitrile,” Journal Applied of Polymer Science, Vol. 84, No. 1, 2002, pp. 138-142. doi:10.1002/app. 10275
- A. L. B. S. Bathista, et al., “1D and 2D Solid State NMR Study of Mangifera Indica Starch,” Annals of Magnetic Resonance, Vol. 5, No. 1, 2006, pp. 41-49.
- M. S. M. Preto, et al., “Proton Relaxation Study of Hypolytrum Pungens,” Annals of Magnetic Resonance, Vol. 5, No. 1, 2006, pp. 50-54.
- A. M. R. Nascimento and M. I. B. Tavares, “The Application of NMR Techniques to the Study of Polysaccharides from Pulp and Latex of Sorva,” International Journal of Polymeric Materials, Vol. 56, No. 2, 2007, pp. 115-125. doi:10.1080/00914030600735213
- A. M. R. Nascimento, et al., “Solid State NMR Study of Couma Utilis Seeds,” International Journal of Polymeric Materials, Vol. 56, No. 4, 2007, pp. 365-370. doi:10.1080/00914030600873485
- R. A. KomorosKi, “High Resolution NMR Spectroscopy of Synthetic Polymers in Bulk,” VCH Publishers, Deerfield Beach, 1986, pp. 118-136.
- F. A. Bovey and P. A. Mirau, “NMR of Polymers,” Academic Press, New York, 1996, pp. 11-19.
- D. L. Vanderhart, et al., “Solid-State NMR Investigation of Paramagnetic Nylon-6 Clay Nanocomposites. 1. Crystallinity Morphology, and the Direct Influence of Fe3+ on Nuclear Spins,” Chemistry of Materials, Vol. 13, No. 10, 2001, pp. 3796-3809. doi:10.1021/cm011078x
- M. I. B. Tavares, et al., “Polypropylene-Clay Nanocomposite Structure Probed by HNMR Relaxometry,” Polymer Testing, Vol. 26, No. 8, 2007, pp. 1100-1102. doi:10.1016/j.polymertesting.2007.07.012