Open Journal of Veterinary Medicine
Vol.3 No.2(2013), Article ID:32866,5 pages DOI:10.4236/ojvm.2013.32031
Association between Presence of Urovirulence Factors, Phylogenetic Class, and Antimicrobial Resistance Patterns in 159 Uropathogenic Escherichia coli Samples Isolated from Dogs
1Department of Small Animal Clinical Sciences, The University of Tennessee, Knoxville, USA
2Department of Biomedical and Diagnostic Sciences, The University of Tennessee, Knoxville, USA
Email: jwells@medvetohio.com
Copyright © 2013 Jennifer E. Wells et al. This is an open access article distributed under the Creative Commons Attribution License, which permits unrestricted use, distribution, and reproduction in any medium, provided the original work is properly cited.
Received February 23, 2013; revised March 25, 2013; accepted April 25, 2013
Keywords: Antimicrobials; Cystitis; Dog; Escherichia coli
ABSTRACT
The purpose of this study was to examine four urovirulence factors (UVFs) and their phylogenetic classes and compare their levels of resistance to antimicrobial drug classes in 159 canine uropathogenic E. coli (UPEC) isolates submitted to the Clinical bacteriology and Mycology Laboratory of The University of Tennessee Veterinary Medical Center in 2007. Multiplex polymerase chain reaction was used to detect the following UVFs: cytotoxic necrotizing factor (cnf), hemolysin (hly), S-fimbrial adhesion gene (sfa), and Pilus associated with pyelonephritis gene G allele III (pap); polymerase chain reaction was used to determine phylogenetic group. In vitro susceptibility to antimicrobial classes was evaluated, and resistance was compared to UVF presence as well as phylogenetic class. UVFs were presented in 48% of UPEC and were negatively correlated with antimicrobial resistance. Of the 159 samples, the number of UVFs expressed per isolate was 0 = 82 (52%), 1 = 24 (15%), 2 = 2 (1%), 3 = 18 (11%), and 4 = 33 (21%). The following UVFs were expressed: sfa (33%), hly (24%), cnf (25%), and pap (18%). Presence of all four UVFs, hly, cnf, and sfa together, and sfa alone, was associated with less resistance (P < 0.0001). Class B2 was the most common phylogenetic class and contained the highest number of UVFs (P < 0.001). Mean antimicrobial resistance was the highest in class A (P < 0.001) and the lowest in B2 (P < 0.001). Phylogenetic class A contained the lowest number of UVFs.
1. Introduction
Urinary tract infections occur commonly in dogs and affect approximately 14% of dogs presented to veterinarians [1]. In two such infections, cystitis and pyelonephritis, Escherichia coli is the most prevalent associated pathogen, accounting for 41% to 51% of cases in dogs [1-4].
The colonization of E. coli in the uroepithelium is affected by virulence factors, which play a role in overcoming host defenses. Virulence factors are present in increased numbers in E. coli that infect the urinary tract compared to E. coli that are present only in the rectum [5,6]. Several urovirulence factors (UVFs) have been associated with canine uropathogenic E. coli (UPEC), including adhesion-encoding operons (pilus associated with pyelonephritis gene G allele III [pap]), s-fimbrial adhesion gene [sfa]), hemolysin (hly), cytotoxic necrotizing factor (cnf), and aerobactin (aer) [5-7]. In one study of 12 dogs with persistent or recurrent UTIs, 70% of the UPEC were positive for at least one UVF [8]. Cnf, hly, and sfa were found most commonly and were each present in 52% of cases. In another study evaluating 50 canine UPEC isolates, the most common UVFs isolated were type I pilus (92%), pap (54%), sfa (54%), hly (54%), and cnf (52%) [5]. In a third study evaluating 30 canine UPEC isolates, fimbriae A (83%) was most common, followed by sfa and cnf (both 53%), pap and aerobactin receptor (iutA) (37%), and hly (23%) [9].
Phylogenetic studies have shown that E. coli can be divided into four main phylogenetic classes: A, B1, B2, and D [10,11]. Determination of phylogenetic class can be determined by multilocus enzyme electrophoresis, ribotyping, or triplex PCR [12]. In one study, B2 was the most common class for antimicrobial-susceptible organisms, whereas antimicrobial-resistant organisms were most commonly in either A or D class [13]. Another study found that while B2 was less prevalent among resistant organisms compared to susceptible organisms, it was still the most dominant class in resistant organisms [14]. A third study also found B2 to be the most common class among UPEC but did not differentiate susceptible versus resistant organisms [9]. To the authors’ knowledge, the correlation between the presence of UVFs, phylogenetic class, and antimicrobial resistance in E. coli isolates from dogs with UTIs has not previously been investigated.
Our hypothesis was that the presence of UVFs would be associated with increased UPEC resistance to antimicrobials and that B2 would be the most common phylogenetic class. The objectives of this study were to determine the presence and prevalence of UVFs pap, sfa, hly, and cnf and antimicrobial resistance in canine UPEC, as well as to evaluate for associations between antimicrobial resistance and individual UVFs, the number of UVFs present, and phylogenetic class. We also sought to determine phylogenetic classes present among canine UPEC and the correlation between number of UVFs and phylogenetic class.
2. Materials and Methods
2.1. Case Selection
Results from all canine urine culture samples submitted in 2007 to the Clinical Bacteriology and Mycology Laboratory of The University of Tennessee Veterinary Medical Center were reviewed. All samples from which E. coli was isolated were considered for the study. Samples from which multiple E. coli isolates were obtained were excluded because recurrence versus resistance could not be determined.
2.2. Antimicrobial Susceptibility
In vitro susceptibility of E. coli isolates was determined using the Ericsson Sherris agar-disk diffusion method. Isolates were characterized as susceptible or resistant to specific antimicrobials based on criteria for interpreting zone sizes for dog samples, as described by the National Committee on Clinical Laboratory Standards [15]. An isolate was considered resistant if it measured in the intermediate or resistant range. The antimicrobials were grouped into classes as follows: aminoglycoside (amikacin, gentamicin, tobramycin), fluoroquinolone (FQ; ciprofloxacin, marbofloxacin, enrofloxacin), beta-lactam with beta-lactamase inhibitor (amoxicillin/clavulanic acid), beta-lactam without beta-lactamase inhibitor (ampicillin, ticarcillin), first-generation cephalosporin (cephalothin), third-generation cephalosporin (ceftazidime), chloramphenicol (chloramphenicol), nitrofuran (nitrofurantoin), and potentiated sulfonamide (trimethoprim sulfamethoxazole [TMS]). If the isolate was resistant to any of the antimicrobials in the class, it was considered resistant to a class.
2.3. Assays
For UVF and phylogenetic class, polymerase chain reaction assays were performed using previously described techniques by technicians who were blinded to the results of the antimicrobial resistance testing [12,16]. Briefly, multiplex PCR assay as used to detect genes cnf, hly, sfa, and pap. E coli strain J96 was used as a positive control sample for all 4 virulence genes, and E. coli strain JJ055 was used as a negative control sample. A thermal cycler was used for the PCR assay. A commercial software program (FPQuest Software, version 4.5, BioRad, Richmond, CA) was used to analyse band size on the electrophoretic gel and to verify the presence or absence of virulence factor genes [16]. Triplex PCR was used to determine phylogenetic class using chuA and yja genes, and anonymous DNA fragment (Tsp.E4.C2) [12].
2.4. Statistical Analysis
Descriptive statistics were generated for antimicrobial classes to which organisms were resistant as well as the number of UVFs expressed by organisms and phylogenetic class. Correlation was assessed in antimicrobial resistance patterns and UVF possession. Chi-square analysis was performed to determine the association between possession of individual UVFs and resistance to an antimicrobial class. Analysis of variance (ANOVA) was performed to assess resistance to an antimicrobial class and phylogenetic class. Two-way ANOVA was performed to examine the relationship between resistance to an antimicrobial class, phylogenetic class, and possession of UVFs. A P value < 0.05 was considered significant. All statistical analysis was performed using a commercially available statistical software package (Analyse-it, Leeds, UK).
3. Results
Included in the study were 159 E. coli urinary tract isolates from 159 different canine patients presented in the year 2007. Of the 159 isolates tested, 82 (52%) did not possess any UVFs, 24 (15%) possessed 1 UVF, 2 (1%) possessed 2 UVFs, 18 (11%) possessed 3 UVFs, and 33 (21%) possessed all 4 UVFs tested (Figure 1). A total of 214 UVFs were detected, either alone or in combination. The most commonly found UVF was sfa (33%) followed by cnf (25%), hly (24%), and pap (18%) (Figure 2).
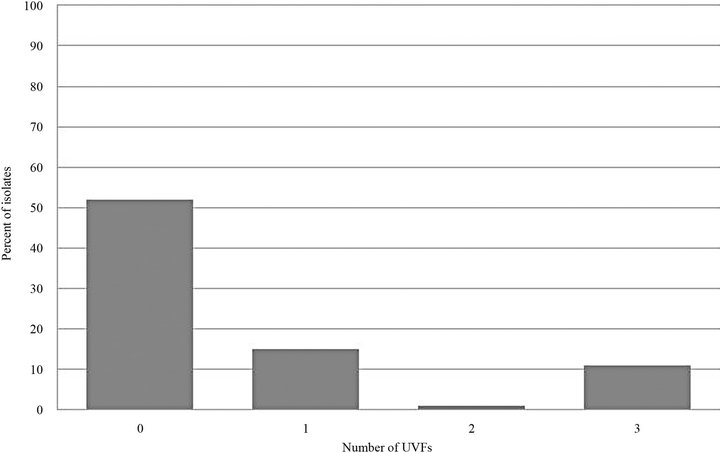
Figure 1. Number of UVFs expressed per isolate.
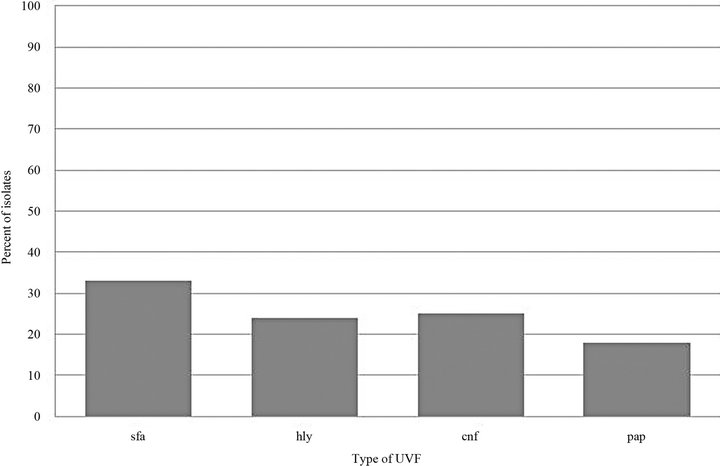
Figure 2. Type of UVF expressed per isolate.
There was a negative correlation between antimicrobial resistance and presence of UVFs. Mean resistance to antimicrobial class by number of UVFs expressed was 0 UVFs = 3.9 ± 3.4 classes, 1 = 1.3 ± 2.1, 2 = 0.0 ± 0.0, 3 = 0.4 ± 0.7, and 4 UVFs = 0.5 ± 1.1 classes. Isolates with all four UVFs were statistically less likely to have antimicrobial resistance (P < 0.001). If three UVFs were present, only the combination of hly, cnf, and sfa was statistically significant (P < 0.001). If sfa was present alone, resistance was also less likely (P < 0.001). When comparing resistance to specific antimicrobial classes, there was a negative correlation between presence of UVFs and resistance (P < 0.001) for all classes of antimicrobials except nitrofuran.
Phylogenetic class B2 was the most common amongst all isolates and represented 42% of the isolates, followed by D (31%), B1 (14%), and A (13%). Compared to all other classes, B2 contained the highest number of UVFs (P < 0.001). There was no statistical difference in the number of UVFs between A, B1, or D. Mean resistance to antimicrobial class by phylogenetic class was A = 5.6 ± 3.3, B1 = 3.4 ± 3.3, B2 = 0.5 ± 1.0, and D = 2.9 ± 3.2. Mean antimicrobial resistance was highest in class A (P < 0.001) and lowest in B2 (P < 0.001). There was no statistically-significant difference between classes B1 and B2.
Although significant differences were found when comparing phylogenetic class as well as number of UVFs with mean antimicrobial resistance, there was no significant interaction between the two (P = 0.15).
4. Discussion
In the study reported here, approximately 48% of the E. coli isolates possessed at least one UVF, which is lower than reported previously (70%) [8].
We chose to evaluate hly, cnf, sfa, and pap because a previous study showed an increased incidence of these UVFs in UPEC when compared to fecal E. coli, suggesting they may play a role in urovirulence [5]. In addition, the combination of these UVFs appeared with the highest frequency in UPEC strains in two studies, and all four factors appeared together 100% and 80% of the time, respectively [7,8]. In our study, only 43% of the isolates that expressed any UVFs expressed all four together. Although pathogenicity islands have been detected linking cnf, hly, and pap as well as cnf and hly in certain E. coli strains, the presence of similar pathogenicity islands did not appear to be present in the E. coli isolates we examined based on the lower incidence of all factors appearing together [17,18].
Several studies have compared UVFs in UPEC with resistance to quinolone (Q), FQ, and TMS [13,19]. All those studies report decreased prevalence of UVFs in resistant isolates. The first study compared ciprofloxacinsusceptible versus resistant E. coli that caused cystitis [19]. Both hly and cnf were present in 31% of susceptible organisms and in none of the resistant organisms. Another study showed similar results when comparing UPEC isolates susceptible vs. resistant, respectively, to Q, FQ, and TMS: pap (Q: 28% vs. 10%, FQ: 26% vs. 11%, TMS: 25% vs. 23%), sfa/foc (Q: 58% vs. 26%, FQ: 57% vs. 11%, TMS: 57% vs. 39%), hly (Q: 55% vs. 13%, FQ: 52% vs. 11%, TMS: 40% vs. 25%), cnf (Q: 42% vs. 10%, FQ: 39% vs. 11%, TMS: 40% vs. 25%) [13]. Another study comparing FQs and UVFs found decreased prevalence of pap, sfa/foc, hly, and cnf in FQ-resistant organisms compared to susceptible organisms [14].
Resistance is also associated with a shift in phylogenetic classes. Our results were similar to previous studies [13,14] in which B2 was the class with the highest antimicrobial susceptibility. Class A was the most resistant class, consistent with previous studies in which A or D was the most common among resistant organisms [13, 14].
Also similar to previous studies [9], B2 was the most common class among isolates that expressed UVFs. The more resistant isolates belonged to A, B1, or D, all of which contained fewer UVFs than group B2. This result suggests there are potentially other UVFs or separate factors besides UVFs that contribute to antimicrobial resistance.
Although most human studies focus on FQs and TMS, we found the same trend for all antimicrobial classes, with the exception of nitrofuran. In our study, all antimicrobial classes showed a negative correlation between presence of UVF and resistance. None of the organisms was resistant to nitrofuran, which made it impossible to determine whether UVF plays a role in resistance to this antimicrobial agent.
The biggest limitation of our study was that we tested only four UVFs. Although they are the most commonly expressed UVFs, other UVFs may play a role in antimicrobial resistance, as one study saw an increase in other UVFs in resistant organisms [14].
In summary, it appears there is an inverse correlation between the presence of hly, sfa/foc, pap, and cnf and antimicrobial resistance amongst UPEC organisms. Additionally, B2 is the most common class amongst UPEC isolates. Class B2 had the lowest mean antimicrobial resistance, whereas class A had the highest mean resistance. Future studies are necessary to determine the potential cause of antimicrobial resistance.
5. Acknowledgements
The authors thank Rupal Brahmbhatt and Randall Kania for technical assistance.
REFERENCES
- C. R. Norris, B. J. Williams, G. V. Ling, C. E. Franti, D. L. Johnson and A. L. Ruby, “Recurrent and Persistent Urinary Tract Infections in Dogs: 383 Cases (1969-1995),” Journal of the American Animal Hospital Association, Vol. 36, No. 6, 2000, pp. 484-492.
- M. A. Seguin, S. L. Vaden, C. Altier, E. Stone and J. F. Levine, “Persistent Urinary Tract Infections and Reinfections in 100 Dogs (1989-1999),” Journal of Veterinary Internal Medicine, Vol. 17, No. 5, 2003, pp. 622-631.
- K. R. Ball, J. E. Rubin, M. Chirino-Trejo and P. M. Downing, “Antimicrobial Resistance and Prevalence of Canine Uropathogens at the Western College of Veterinary Medicine Teaching Hospital, 2002-2007,” Canadian Veterinary Journal, Vol. 49, No. 10, 2008, pp. 985-990.
- G. V. Ling, C. R. Norris, C. E. Franti, P. H. Eisele, D. L. Johnson, A. L. Ruby, et al., “Interrelations of Organism Prevalence, Specimen Collection Method, and Host Age, Sex, and Breed among 8354 Canine Urinary Tract Infections (1969-1995),” Journal of Veterinary Internal Medicine, Vol. 15, No. 4, 2001, pp. 341-347.
- K. Yuri, K. Nakata, H. Katae, S. Yamamoto and A. Hasegawa, “Distribution of Uropathogenic Virulence Factors among Escherichia coli Strains Isolated from Dogs and Cats,” Journal of Veterinary Medical Science, Vol. 60, No. 3, 1998, pp. 287-290. doi:10.1292/jvms.60.287
- J. R. Johnson, N. Kaster, M. A. Kuskowski, G. V. Ling, “Identification of Urovirulence Traits in Escherichia coli by Comparison of Urinary and Rectal E. coli Isolates from Dogs with Urinary Tract Infections,” Journal of Clinical Microbiology, Vol. 41, No. 1, 2003, pp. 337-345. doi:10.1128/JCM.41.1.337-345.2003
- C. Féria, J. Machado, J. D. Correia, J. Gonçalves and W. Gaastra, “Virulence Geneses and P fimbriae PapA Subunit Diversity in Canine and Feline Uropathogenic Escherichia coli,” Veterinary Microbiology, Vol. 82, No. 1, 2001, pp. 81-89. doi:10.1016/S0378-1135(01)00375-3
- N. Drazenovich, G. Ling and J. Foley, “Molecular Investigation of Escherichia coli Strains Associated with Apparently Persistent Urinary Tract Infections in Dogs,” Journal of Veterinary Internal Medicine, Vol. 18, No. 3, 2004, pp. 301-306.
- C. Tramuta, D. Nucera, P. Robino, S. Salvarani and P. Nebbia, “Virulence Factors and Genetic Variability of Uropathogenic Escherichia coli Isolated from Dogs and Cats in Italy,” Journal of Veterinary Science, Vol. 12, No. 1, 2011, pp. 49-55. doi:10.4142/jvs.2011.12.1.49
- H. Ochman, T. S. Whittam, D. A. Caugant and R. K. Selander, “Enzyme Polymorphism and Genetic Population Structure in Escherichia coli and Shigella,” Journal of General Microbiology, Vol. 129, No. 9, 1983, pp. 2715- 2726.
- T. S. Whittam, H. Ochman and R. K. Sleander, “Multilocus Genetic Structure in Natural Populations of Escherichia coli,” Proceedings of the National Academy of Sciences of the USA, Vol. 80, No. 6, 1983, pp. 1751-1755. doi:10.1073/pnas.80.6.1751
- O. Clermont, S. Bonacorsi and E. Bingen, “Rapid and Simple Determination of the Escherichia coli Phylogenetic Group,” Applied and Environmental Microbiology, Vol. 66, No. 10, 2000, pp. 4555-4558. doi:10.1128/AEM.66.10.4555-4558.2000
- E. Moreno, G. Prats, M. Sabaté, T. Pérez, J. Johnson and A. Andreu, “Quinolone, Fluoroquinolone and Trimethoprim/Sulfamethoxazole Resistance in Relation to Virulence Determinants and Phylogenetic Background among Uropathogenic Escherichia coli,” Journal of Antimicrobial Chemotherapy, Vol. 57, No. 2, 2006, pp. 204-211. doi:10.1093/jac/dki468
- A. Takahashi, T. Muratani, M. Yasuda, S. Takahashi, K. Monden, K Ishikawa, H. Kiyota, et al., “Genetic Profiles of Fluoroquinolone-Resistant Escherichia coli Isolates Obtained from Patients with Cystitis: Phylogeny, Virulence Factors, PAIusp Subtypes, and Mutation Patterns,” Journal of Clinical Microbiology, Vol. 47, No. 3, 2009, pp. 791-795. doi:10.1128/JCM.01740-08
- A. W. Bauer, W. M. Kirby, J. C. Sherris and M. Turck, “Antibiotic Susceptibility Testing by a Standardized Single Disk Method,” American Journal of Clinical Pathology, Vol. 45, No. 4, 1966, pp. 493-486.
- A. Stenske, D. A. Bemis, B. E. Gillespie, S. P. Oliver, F. A. Draughon, K. J. Matteson, et al., “Prevalence of Urovirulence Genes cnf, hlyD, sfa/foc, and papGIII in Fecal Escherichia coli from Healthy Dogs and Their Owners,” American Journal of Veterinary Research, Vol. 70, No. 11, 2009, pp. 1401-1406. doi:10.2460/ajvr.70.11.1401
- M. Bingen-Bidois, O. Clermont, S. Bonacorsi, M. Terki, N. Brahimi, C. Loukil, et al., “Phylogenetic Analysis and Prevalence of Urosepsis Strains of Escherichia coli Bearing Pathogenicity Island-Like Domains,” Infection and Immunity, Vol. 70, No. 6, 2002, pp. 3216-3226. doi:10.1128/IAI.70.6.3216-3226.2002
- G. Blum, V. Falbo, A. Caprioli and J. Hacker, “Gene Clusters Encoding the Cytotoxic Necrotizing Factor Type 1, Prs-Fimbriae and α-Hemolysin Form the Pathogenicity Island II of the Uropathogenic Escherichia coli Strain J96,” FEMS Microbiology Letters, Vol. 126, No. 2, 1995, pp. 189-196.
- J. Vila, K. Simon, J. Ruiz, J. Horcajada, M. Velasco, M. Barranco, et al., “Are Quinolone-Resistant Uropathogenic Escherichia coli Less Virulent?” The Journal of Infectious Diseases, Vol. 186, No. 7, 2002, pp. 1039-1042. doi:10.1086/342955