Journal of Geoscience and Environment Protection
Vol.05 No.03(2017), Article ID:75178,12 pages
10.4236/gep.2017.53017
Groundwater Potential Evaluation in a Typical Basement Complex Environment Using GRT Index―A Case Study of Ipinsa-Okeodu Area, near Akure, Nigeria
Igbagbo A. Adeyemo*, Gabriel O. Omosuyi, Bosede T. Ojo, Abiola Adekunle
Department of Applied Geophysics, Federal University of Technology, Akure, Nigeria

Copyright © 2017 by authors and Scientific Research Publishing Inc.
This work is licensed under the Creative Commons Attribution International License (CC BY 4.0).
http://creativecommons.org/licenses/by/4.0/


Received: January 15, 2017; Accepted: March 28, 2017; Published: March 31, 2017
ABSTRACT
This study is aimed at evaluating groundwater potential of Ipinsa-Okeodu area, near Akure, Southwestern Nigeria. A multi-criteria model was developed for achieving this aim; the GRT model which is based on geology of each sounding point, resistivity, and thickness of the aquifer across the study area was successfully used to evaluate the aquifer potential of the area for future groundwater development programme in the area. Geophysical investigation involving vertical electrical sounding was carried out across the study area. A total of one hundred and two (102) vertical electrical soundings (VES) data were acquired using Schlumberger array with maximum half-current electrode separation of 150 m. Three to five geoelectric layers were delineated across the study area. The predominant curve types are KH, H, K and A. The maps of aquifer layer resistivity and aquifer layer thickness were generated and synthesized with the geology of the study area in producing the GRT model map/groundwater potential map. The groundwater potential map shows that the area is characterized by five groundwater potential zones; poor, low, moderate, good and high. The northwestern regions, north central and part of the southwestern regions are high groundwater potential zones, the northern and most part of southeastern zone are of moderate potential, while small portion in the southeastern and northern zones are of low groundwater potential.
Keywords:
GRT-Model, Groundwater Potential Evaluation, Geology, Resistivity, Thickness

1. Introduction
Groundwater is the water stored in subsurface aquifers which are pore spaces or fractures in rocks or sediments. Groundwater is the only viable safe source of water in many remote areas where development of surface water is not economically viable. Groundwater provides a reasonable constant supply of water since it is not completely susceptible to drying up under natural conditions unlike surface water [1] . Groundwater has been of continuous and tremendous use in irrigation, industries and urban centers, as well as in rural communities. It is conveniently available at point of use and possesses excellent quality that requires little or no treatment in most cases. There is inadequate supply of water at the study area, Ipinsa-Okeodu, near Akure Ondo State due to the continuous growth of this residential area, hence there is need for proper hydrogeophysical investigation of the area to enhance groundwater development programme in the area [1] .
In the basement terrain, groundwater development may be primarily restricted to the aquifer in the weathered overburden or complemented by fractured crystalline rocks which are mainly of Precambrian age [2] [3] [4] . The concealed basement rocks may contain faulted areas, incipient joints and fractured systems derived from earlier tectonic events. The delineation of these hydro geologic structures may facilitate the location of groundwater prospect zones in typical basement settings [5] . Fractured crystalline bedrocks remain good sources for drinkable water but sitting of highly productive wells in these rock units remains a challenging and expensive task because fractured developments on regional scale are both heterogeneous and anisotropic. Also fractured and viable aquifers wholly within the fractured bedrock are of rare occurrence because of the typically low storability of fracture systems [6] . The availability of groundwater in these aforementioned rocks is largely due to the development of secondary porosity and permeability resulting from weathering and fracturing. In a typical hard rock setting, the geological stratification normally encountered consists of a hard rock basement overlain by variably thick unconsolidated materials referred to as the overburden or the regolith. The overburden is further stratified into zones of aeration and saturation, separated by the water table [7] .
In the past, groundwater potentials have been evaluated based on consideration of important parameters such as overburden thickness, weathered layer resistivity, bedrock resistivity, aquifer layer resistivity and aquifer layer thickness among others [6] - [13] and each parameter is considered in isolation. However in this study a multi-criteria GRT modelling approach was developed for evaluating groundwater potential in a typical basement complex environment. The GRT model was based on three (3) most important hydrogeophysical parameters; geology, aquifer resistivity, and aquifer thickness. These parameters were synthesized using an existing approach that has been used in environmental studies [14] .
2. Study Area
The study area covers Ipinsa-Okeodu area located in the northeastern boundary of Akure, Ondo State (Figure 1). The area spans within 735,000 and 739,200 m (Easting) and 806,000 and 810,600 m (Northing) based on Universal Traverse Mercatum System (Minna Datum) and it occupies a total area of about 4.7 km2 (Figure 1). The terrain across the study area is moderately to highly undulating with surface elevation ranging between 330 and 430 m above sea level, while depressions zones are observed at the southeastern parts of the study area (Figure 2).
The area falls within the tropical rain forest region, with a climate characterized by wet and dry seasons. The vegetation in the study area is tropical rain forest type; it consists of thick vegetation comprising of varieties evergreen trees that yield tropical hardwoods.
The area is easily accessible through tarred major roads, untarred roads and footpaths.

Figure 1. Simplified geological map of the study area showing the VES points.
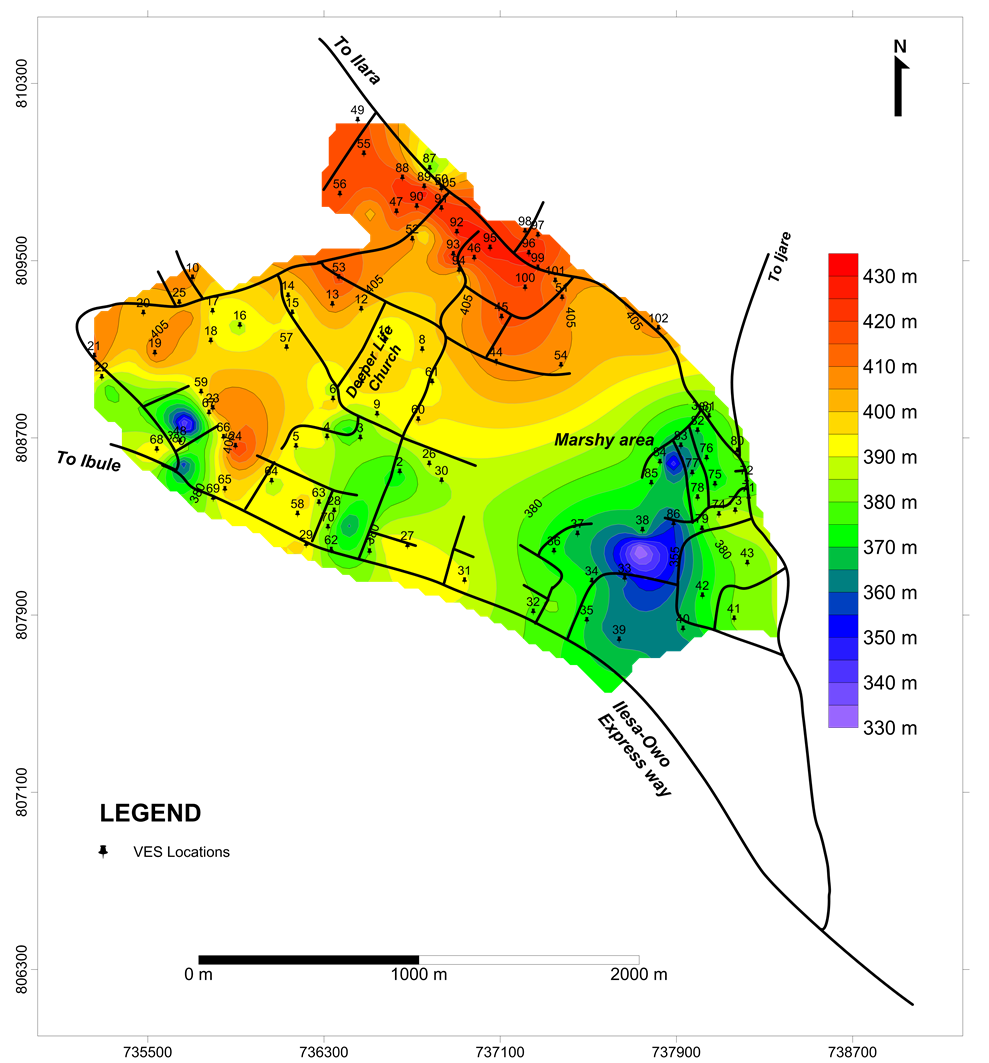
Figure 2. Topographic map of the study area showing the VES points.
The area is underlain by the rocks of Precambrian Basement Complex of southwestern Nigeria (Figure 1). Two lithologic units were identified in the area, namely: undifferentiated Older Granite-Charnockites suites (OGC) and Migmatite-Gneiss-Quartzite complex (MGQ).
3. Methodology
The vertical electrical sounding (VES) field technique using Schlumberger electrode configuration was adopted for this study. One hundred and two (102) VES points were occupied across the study area with a view to understanding the hydrogeophysical characteristics of the area. Analysis and interpretation of the data obtained were made both qualitatively and quantitatively in order to establish the geo-electric/geologic sequence beneath the study area. The qualitative analysis also involved evaluation of sounding curves for hydrogeophysical characteristics, while quantitative analysis involving partial curve matching and computer iterations to determine geoelectric parameters of geoelectric sequence beneath the study area. The results were presented as tables and maps.
4. Results
The curves obtained in the study are the A, H, K, Q, KH, AK, AA, HK, QH, AKH, and HKH. The KH, H and A curve types are the predominant curves in the study area. Three to five geoelectric layers were delineated across the study area which corresponds to four geologic units namely; the top soil, weathered layer, partially weathered basement, partially fractured basement and the presumed fresh basement. The topsoil resistivity varies from 26 to 1888 ohm-m and thickness range of 0.2 and 9.9 m. The weathered layer resistivity varies from 15 to 5603 ohm-m with a thickness range of 0.2 and 36.3 m. The third layer resistivity values range from 25 to 1842 ohm-m and thickness range of 2.0 and 52.3 m. The fourth layer resistivity ranges between 19 and 478 ohm-m and thickness values of 15 to 35 m. The fifth layer resistivity value varies between 369 and 100,000 ohm-m (Table 1).
4.1. GRT Model
The GRT is an acronym formed from the highlighted letters of the three factors considered most relevant to groundwater potential evaluation; underlying Geology beneath each VES point, Resistivity and Thickness of the aquifer layers. These factors are combined in a numerical ranking system in order to quantitatively rate the aquifer potential of each VES location. The system contains two significant parts: weights and ratings and each GRT factor was evaluated with respect to others in order to determine the relative importance of each factor (Table 2).
The basic assumption made in the development of the GRT model includes the following:
1) The Geology of an area depends on the mineral content of the rock present and in turn determines the age of the rock, its degree of weathering and fracturing and consequently its ability to store and transmit water.
2) Resistivity of the aquifer layer depends essentially on the availability of connecting pore spaces in the aquifer layer and presence of conductive fluid such as water within the aquifer layer.
3) Thickness of the aquifer layer determines the possible water column and volume of water within the aquifer layer.
The various parameters adopted in the evolution of the GRT indicator tool include:

Table 1. Geoelectric sounding results.
Note: the (*) asterisk sign indicates the delineated aquifer layer.
Table 2. Indicator weights.
1) Identification of the important indicators influencing groundwater potential.
2) Derivation of indicator weights (Table 2); indicator weights depict the relative importance of the indicator to the evaluation of groundwater potential.
3) Derivation of different ratings for each indicator.
The most significant indicators have weights of 5 and the least weight of two in a five-point scale.
The three (3) parameters were synthesized using the following relationship:
 (1)
(1)
where,
Wt = Weight;
Rt = Rating.
4.2. Geology
The geologic map of the study area (Figure 1) indicates that the study area is underlain by two major rock types with different hydrogeological potential, namely undifferentiated Older Granite-Charnockites suites (OGC) and Migmatite-Gneiss-Quartzite complex (MGQ). The undifferentiated Older Granite- Charnockites suites areas are considered to be poor and moderate groundwater potential zones, while Migmatite-Gneiss-Quartzite complex are noted for its high groundwater potential.
The undifferentiated OGC suites are found in the eastern and southeastern parts of the study area while Migmatite-Gneiss-Quartzite complex are dominant in the western part of the area. Charnockites are assigned a rating of 0.4 in the GRT-model, while the Migmatite-Gneiss-Quartzite was assigned a rating of 0.8, and finally the granitic region were assigned a rating of 0.5. The region with significantly higher rating is considered to be of good groundwater potential.
4.3. Aquifer Layer Resistivity Map
The aquifer layer resistivity map of the study area (Figure 3) shows the variation of resistivity in the aquifer layers across the study area. The aquifer layer resistivity map shows that the area is characterized by five groundwater potential zones; poor, low, moderate, good and high based on their resistivity contrast. Since groundwater flows within aquifer is from higher resistivity to lower resistivity zones [12] , this means that within the aquifer areas with lower resistivity values will be more saturated. The areas with low resistivity value (20 - 150 ohm-m) are
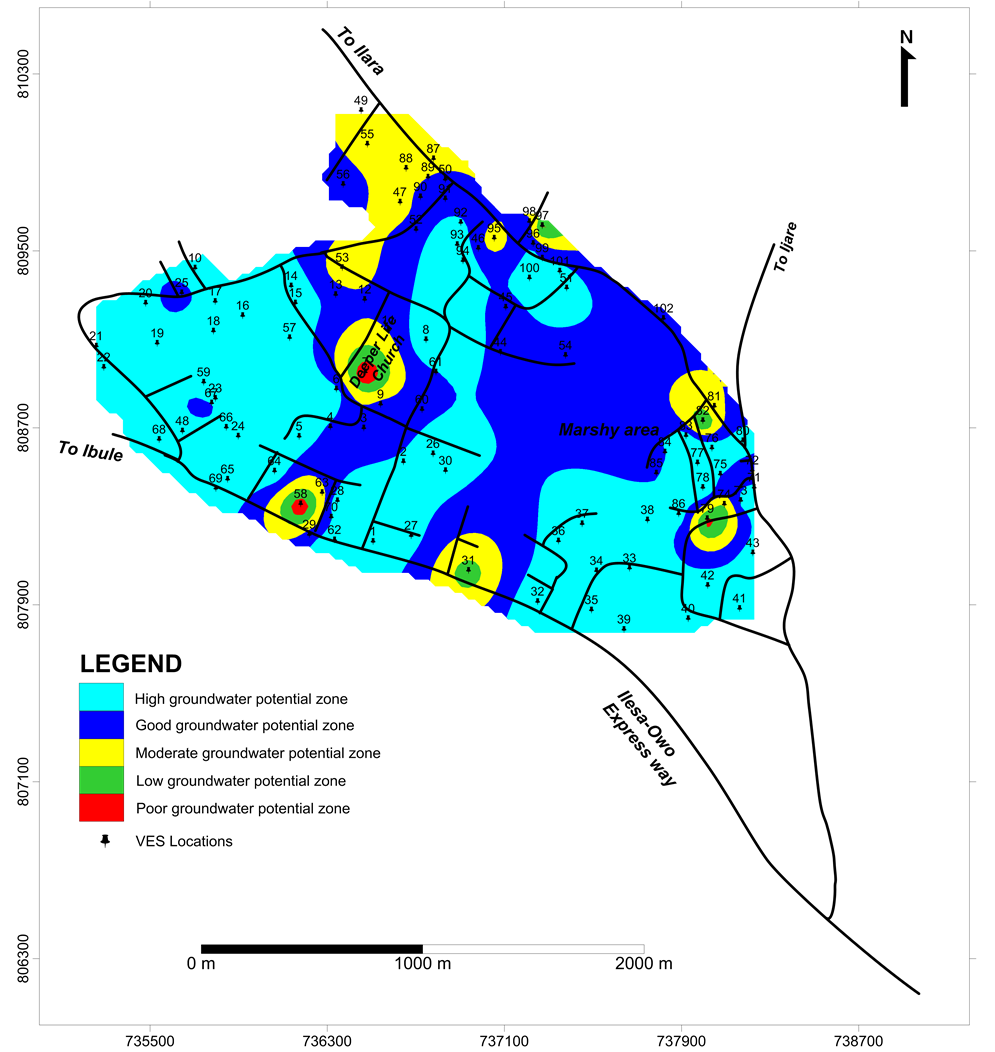
Figure 3. Aquifer layer resistivity map of the study area.
expected to be more saturated with water and they are rated 1.0, and they occupy about half of the study area. Areas with resistivity range of 150 to 350 ohm-m are delineated as good and moderate ground water potentials and are rated 0.8 and 0.6 respectively, and they occupy mainly the north central and southern part of the study area. The areas with high resistivity values ranging from 450 to 540 ohm-m, which occupies part of the north central and southern part of the study area, are considered to be of poor potential and are rated 0.2. Areas with high resistivity value indicate low conductivity, consequently low water saturation. The GRT indicator (Table 2) shows the weight of resistivity to be 3 from maximum of 5, while the rating range is 0.2 to 1.
4.4. Aquifer Layer Thickness Map
The aquifer layer thickness (Figure 4) across the study area varies from 2 to 50 m . Areas with thickness of 2 - 5 m are considered to be of poor groundwater potential and are rated 0.2, and these areas occupy part of the northeastern and a small portion of the southwestern zone. Areas where the aquifer thicknesses are be-
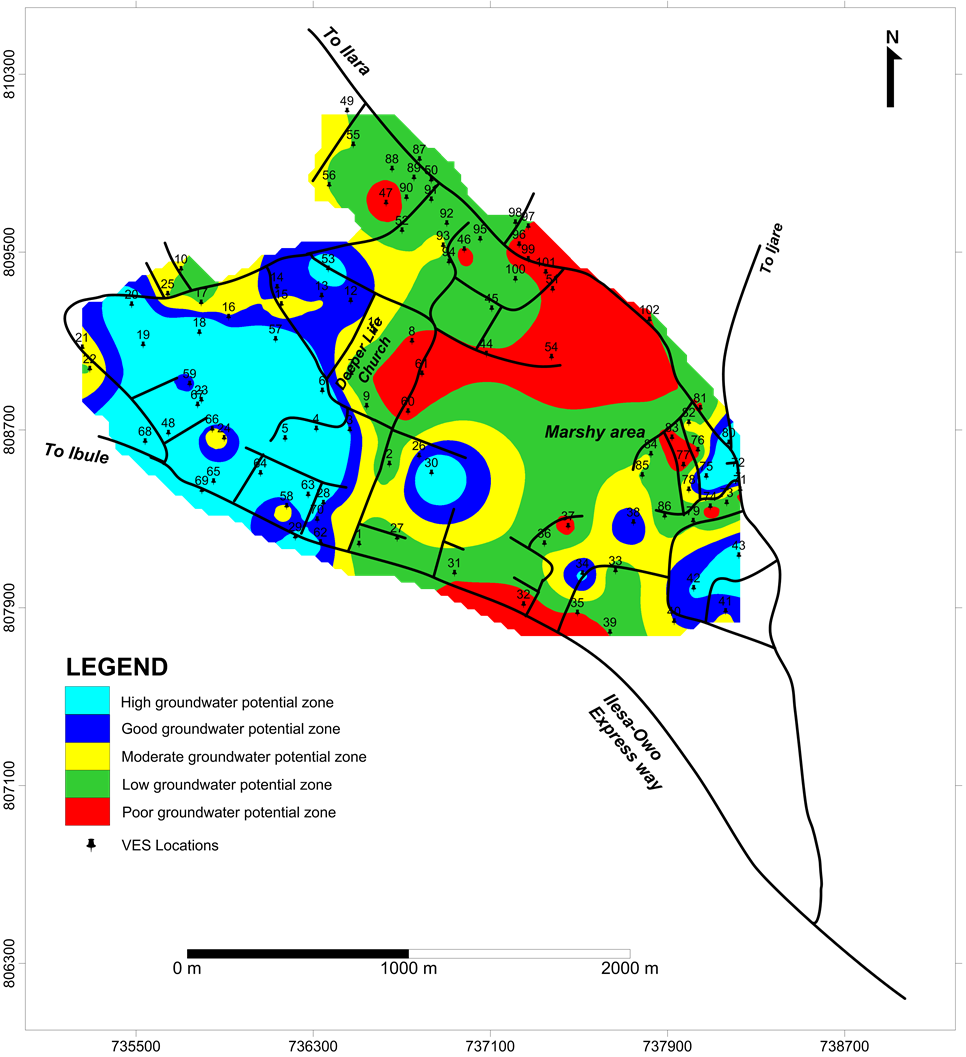
Figure 4. Aquifer layer thickness map of the study area.
tween 10 - 15 m and 15 - 20 m are considered to be of moderate and good groundwater potentials and they are rated 0.6 and 0.8 respectively. Areas where the aquifer thickness is above 20 m are ranked to be high groundwater potential zone and are rated 1.0. Aquifer thickness is weighed 2 from possible 5 in the GRT- model.
4.5. Groundwater Potential Map
The GRT-model map integrates maps of geology, aquifer resistivity and aquifer thickness. It is the direct indicator of groundwater potential in the study area

Figure 5. Groundwater potential map of the study area.
and it shows the spatial variation of the groundwater potential across the study area. The GRT model map/groundwater potential map (Figure 5) delineated five different groundwater potential areas; poor, low, moderate, good and high. The western part of the study area are delineated to be high groundwater potential area (0.7 - 0.95), while the extreme northern parts of the area are characterized by poor and low potentials (0 - 0.3) and the northeastern and central parts of the area are categorized as moderate (0.3 - 0.5) and good (0.5 - 0.7) groundwater potential zones. Generally the Ipinsa-Okeodu area can be considered to be of moderately good potential. Evidence from success rate of groundwater development efforts in the study area confirmed the reliability of this model.
5. Conclusion and Recommendation
This research work presents the result of application of a multi-criteria approach to groundwater potential evaluation at Ipinsa-Okeodu area near Akure, Ondo State, Nigeria. The study adopted vertical electrical sounding techniques using the Schlumberger electrode configuration. The maps of aquifer layer resistivity, aquifer layer thickness and the geology of the study area were generated and integrated in the GRT model map/groundwater potential map. The western parts of the study area are delineated to be high groundwater potential area, followed by the northeastern and central parts of the area which are categorized as moderate and high potentials and finally the extreme northern parts of the area which are characterized by poor and low potentials. In view of the observed reliability of this model it is therefore recommended that groundwater potential evaluation in any geologic setting should always be done using a multi-criteria approach.
Cite this paper
Adeyemo, I.A., Omosuyi, G.O., Ojo, B.T. and Adekunle, A. (2017) Groundwater Potential Evaluation in a Typical Basement Complex Environment Using GRT Index―A Case Study of Ipinsa- Okeodu Area, near Akure, Nigeria. Journal of Geoscience and Environment Protection, 5, 240-251. https://doi.org/10.4236/gep.2017.53017
References
- 1. Akintorinwa, O.J. and Olowolafe, T.S. (2013) Geoelectric Evaluation of Groundwater Prospect within Zion Estate, Akure, Southwest, Nigeria. International Journal of Water Resources and Environmental Engineering, 5, 12-28.
- 2. Olayinka, A.I. and Olorunfemi, M.O. (1992) Determination of Geoelectrical Characteristic in Okene Area and Implication for Boreholes. Journal of Mining and Geology, 28, 403-412.
- 3. Wright, E.P. and Burgess, W.G. (1992) Hydrogeology of Crystalline Basement Aquifers in Africa. Geological Society London Special Publications, 66, 1-27.
https://doi.org/10.1144/GSL.SP.1992.066.01.01 - 4. Omosuyi, G.O., Ojo, J.S. and Enikanselu, P.A. (2003) Geophysical Investigation for Groundwater around Obanla-Obakekere in Akure Area within the Basement Complex of Southwestern Nigeria. Journal of Mining and Geology, 39, 109-116.
- 5. Omosuyi, G.O. (2010) Geoelectric Assessment of Groundwater Prospect and Vulnerability of Overburden Aquifers at Idanre, Southwestern Nigeria. Ozean Journal of Applied Science, 3, 19-28.
- 6. Clark, L. (1985) Groundwater Abstraction from Basement Complex Area of Africa. Quarterly Journal of Engineering Geology and Hydrogeology, 18, 25-34.
https://doi.org/10.1144/GSL.QJEG.1985.018.01.05 - 7. Omosuyi, G.O. and Oseghale, A. (2012) Groundwater Vulnerability Assessment in Shallow Aquifers Using Geoelectric and Hydrogeologic Parameters at Odigbo, Southwestern Nigeria. Journal of Scientific and Industrial Research, 3, 501-512.
- 8. Abiola, O., Enikanselu, P.A. and Oladapo, M.I. (2009) Groundwater Potential and Aquifer Protective Capacity of Overburden Units in Ado-Ekiti, Southwestern Nigeria. International Journal of Physical Sciences, 4, 120-132.
- 9. Adeyemo, I.A., Omosuyi, G.O., Olayanju, G.M. and Omoniyi, G.K. (2014) Hydrogeologic and Geoelectric Determination of Groundwater Flow Pattern in Alaba-Apatapiti Layouts, Akure, Nigeria. The International Journal of Engineering and Science (IJES), 3, 44-52.
- 10. Amadi, A.N., Nwawulu, C.D., Unuevho, C.I. and Ako, T.A. (2011) Evaluation of the Groundwater Potential in Pompo Village, Gidan Kwano, Minna Using Vertical Electrical Resistivity Sounding. British Journal of Applied Science & Technology, 1, 53-66.
https://doi.org/10.9734/BJAST/2011/192 - 11. Kosinski, W.K. and Kelly, W.E. (1981) Geoelectric Soundings for Predicting Aquifer Properties. Groundwater, 19, 163-171.
https://doi.org/10.1111/j.1745-6584.1981.tb03455.x - 12. Mogaji, K.A., Omosuyi, G.O. and Olayanju, G.M. (2011) Groundwater System Evaluation and Protective Capacity of Overburden Material at Ile-Oluji, Southwestern Nigeria. Journal of Geology and Mining Research, 3, 294-304.
- 13. Olayanju, G.M., Ayuk, M.A. and Adelusi, A.O. (2011) Geotechnical Mapping of the Groundwater Regime around the Federal Polytechnic, Ado-Ekiti, Southwestern Nigeria. Journal of Geology and Mining Research, 3, 201-210.
- 14. Chachadi, A.G. (2005) Seawater Intrusion Mapping Using Modified GALDIT Indicator Model-Case Study in Goa. Jalvigyan Sameeksha, 20, 29-45.