Open Journal of Animal Sciences
Vol.3 No.3(2013), Article ID:34704,7 pages DOI:10.4236/ojas.2013.33038
Development of a computer vision system to monitor pig locomotion
![]()
Norsvin, Hamar, Norway; jorgen.kongsro@norsvin.no
Copyright © 2013 Jørgen Kongsro. This is an open access article distributed under the Creative Commons Attribution License, which permits unrestricted use, distribution, and reproduction in any medium, provided the original work is properly cited.
Received 9 April 2013; revised 13 May 2013; accepted 3 June 2013
Keywords: Video image Analysis; Multivariate Image Analysis; Principal Component Analysis; Leg Weakness; Structural Soundness; Pigs
ABSTRACT
Avoiding lameness or leg weakness in pig production is crucial to reduce cost, improve animal welfare and meat quality. Detection of lameness detection by the use of vision systems may assist the farmer or breeder to obtain a more accurate and robust measurement of lameness. The paper presents a low-cost vision system for measuring the locomotion of moving pigs based on motion detection, frame-grabbing and multivariate image analysis. The first step is to set up a video system based on web camera technology and choose a test area. Secondly, a motion detection and data storage system are used to build a processing system of video data. The video data are analyzed measuring the properties of each image, stacking them for each animal and then analyze these stacks using multivariate image analysis. The system was able to obtain and decompose information from these stacks, where components could be extracted, representing a particular motion pattern. These components could be used to classify or score animals according to this pattern, which might be an indicator of lameness. However, further improvement is needed with respect to standardization of herding, test area and tracking of animals in order to have a robust system to be used in a farm environment.
1. INTRODUCTION
Avoiding lameness or leg weakness in pig production is economically important, an animal welfare issue may have a positive effect on the carcass and meat quality. Leg weakness leads to the reduction of longevity of breeding pigs [1], and is caused by a number of factors, both environmental (floors, feeding etc.) and genetical. The characteristics of lameness or lack of structural soundness in pigs have been described by Grøndalen [2]. Lameness or structural soundness is traditionally measured in terms of subjective scoring of animal behaviour [3]. These measurements are usually prone to lack of harmonization and human errors, and may not reflect the true structural soundness of an animal [4].
Vision systems using video image analysis (VIA) could improve the accuracy of structural soundness by automating tedious tasks associated with these measurements [5]. By introducing a vision system capable of sampling the behavior of the animal in a more automated way, more accurate phenotypes used in animal genetics or breeding can be achieved. The estimated values for heritability of leg weakness sometimes vary from low values around 0.10 - 0.15 to mid-level 0.30 - 0.40, often with high standard errors [1,6]. This is often caused by the subjective nature of leg weakness measurements. Lundeheim [6] suggested that a more objective system would probably have a higher heritability than the subjective scores, in this case a moving belt measuring the walking to trotting of pigs by adjusting the belt speed. However, the challenge is to balance the increased cost of equipment, so that it would be paid off by the increased accuracy. Image analysis could help reduce the cost of equipment by novel techniques. Vision systems are becoming more affordable and the quality of video images has become much better compared to the quality in the late 80’s. For example, a webcam can be implemented in a vision system for less than 20 USD per camera unit. Today, most of the costs are associated with the development of software and innovative systems.
In this paper, we measure the locomotion of the pig by herding the pigs individually from one pen to another. The pigs are identified by segmentation and centered, and a binary image is generated for each frame. The frames generated from one pig are organized as a stack of binary images, giving a map image of the pigs’ movement from one pen to another. The novel technique lies in utilizing these binary images and the map image stack, and analyzing the map image using multivariate image analysis (MIA) by principal component analysis (PCA). MIA is typically applied to multi-spectral images such as satellite images or microscopic images etc. [7]. By treating each frame as a wavelength similar to multispectral analysis, the same methods can be applied here, obtaining information for each frame or movement instead of a wavelength. The advantage is that we can obtain both spatial and pixel information using these methods. The author has previously presented a multi-way method to analyse a stack of CT images to assess carcass composition [8].
The objectives of this study were 1) to develop and set up a vision system for evaluation of pig locomotion characterizing structural soundness of pigs by multivariate image analysis, 2) to present a simple application or prototype for classifying animals according to their gait or locomotion.
2. MATERIALS AND METHODS
2.1. Animals
A dataset consisting of 288 Norwegian landrace boars with a body weight ranging from 90 kg and 130 kg were used in this experiment. The landrace boars were sampled from 1.700 landrace boars tested and filmed annually at the Norsvin test station outside of Hamar, Norway. The boars are part of an intensive testing system for selecting animals based on breeding values for several traits. The traits are production, carcass, meat quality, maternal and structural soundness traits. The boars were filmed during a period from June 2011 to June 2012.
2.2. Test Area
The test area was setup in an off-testing pen area for Norsvin boars. The off-testing site consists of 24 pens, 6 by 4 pens with passage ways between them. One of these passage ways was used as a test area during the herding of pigs from their standard pens to their off-testing pens (Figure 1). The pigs were herded individually from their holding pens to the off-testing pens, passing the test area individually.
2.3. Filming
Video was recorded using a web camera (Microsoft OEM Life Cam Cinema from Microsoft Corporation). The web camera was mounted in the ceiling, ceiling height 3.2 meters, yielding a perpendicular view relative to the floor of the pigs (Figure 1). The web camera was

Figure 1. Over view of test area.
connected to a PC running on a Linux Ubuntu operative system. To detect motion and record video, a motion detection software Motion [9]. The software was setup to detect motion during a specific time interval where the animals are herded from their standard pens to the offtest pens. Frame grabbed images were stored on the computer hard drive when motion was detected in significant parts of the video. Brightness, saturation and contrast level were set to fixed levels at 30, 100 and 100, respectively, within a valid range of 0 - 255, to avoid auto-correction in images. The hard drive was setup with web-based file hosting service Dropbox [10] to share the grabbed images from video across the Internet to be accessed in the office outside the test station. The image width and height was 800 by 400 pixels, respectively. Frame rate was set to a maximum of 30 frames per second, however, the webcam delivered 15 frames per second by default.
2.4. Image Processing
The video image analysis (VIA) was done in MATLAB using the Image Processing Toolbox and Statistics Toolbox [11]. An overview of the script is shown in Figure 2. The first step was to import the images from the grabbed frames. The RGB images were cropped to focus on the significant areas of the image (the hall-way). The RGB image was converted to grayscale to reduce computational time and size of the image. The next step was to compute a global threshold to segment the pig from the background. This was done by Otsu method of histogram shape-based image thresholding [12], producing a binary image of the pig. Background noise was filtered out using labeling of the biggest object (pig). To capture only moving pigs, a filter was designed to capture only pig images where the centre point was moving from left to right (walking direction from pen to pen). The images morphologically opened removing all connected components fewer than 50 pixels and closed with a ball struc-
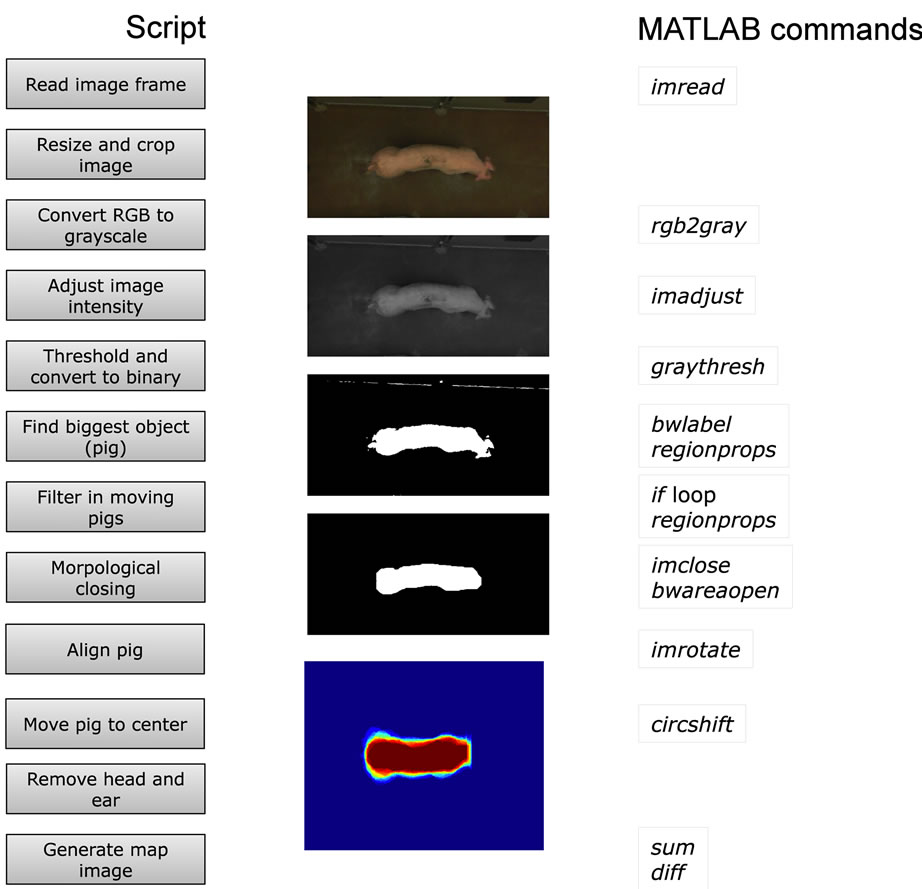
Figure 2. Flow chart of video image analysis and MATLAB script.
turing element of 10 pixels [11] to remove interference from back-ground, tail or feet. The pigs were rotated so that its longitudinal axis was positioned horizontally, and moved to the centre of the field [13]. The position of the head and ear was located using the width of the pig, and the positions were found using the derivative of the width curves [13]. The processed binary images were added on top of each other, giving an image map representing the difference between each of the binary images. The largest values would represent the pixels were the binary pig would appear most frequent. The map image would represent the total movement of pig in a stack of added binary images. A minimum of 15 binary images was set as a threshold to avoid making map images of small movements, and to ensure a complete stride of at least one second (15 frames per second).
2.5. Multivariate Image Analysis
The map images were concatenated in a three-way data array (samples × row × columns). The three-way data array was unfolded by combining the image modes (samples × image). PCA was calculated on the unfolded data array using the MATLAB function princomp. The princomp function centers data by subtracting off column means by default (centering). The unfolded data set was processed using two preprocessing approaches; centering and centering plus scaling. The loading coefficients were refolded back to a three-way data array to produce images which were easier to interpret than the unfolded data matrix.
3. RESULTS
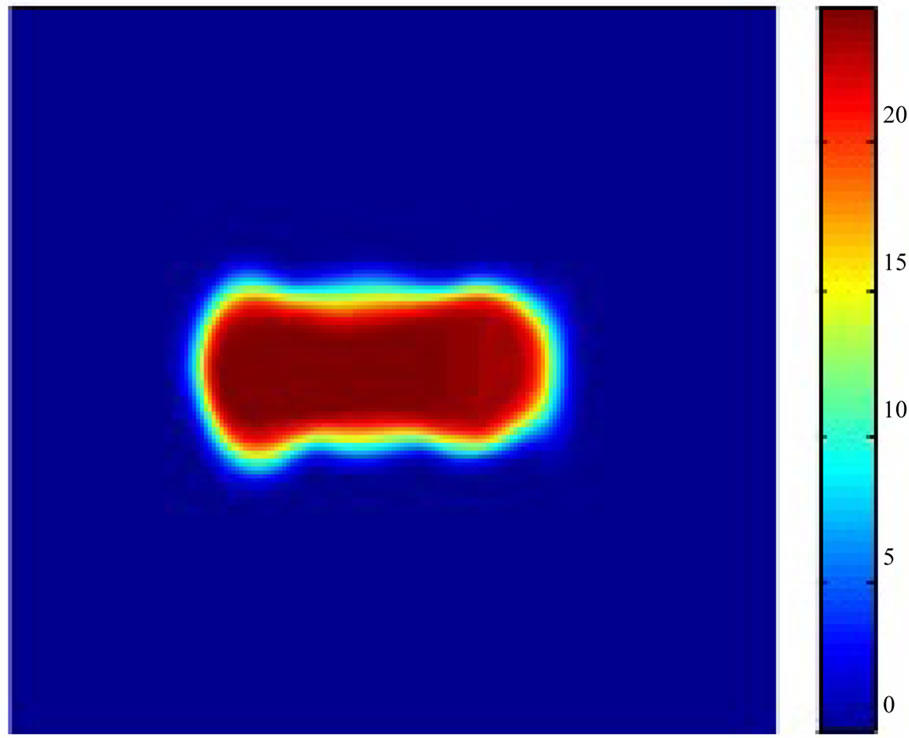
The mean and standard deviation image of the data set of map images are shown in Figure 3. The average pig is displayed according to a scale (Figure 3(a)), where a high number could be interpreted as the probability of a pig appearing in this particular pixel. The standard deviation image displays were the highest variation is present (Figure 3(b)). This would be the hind part and around the shoulders.
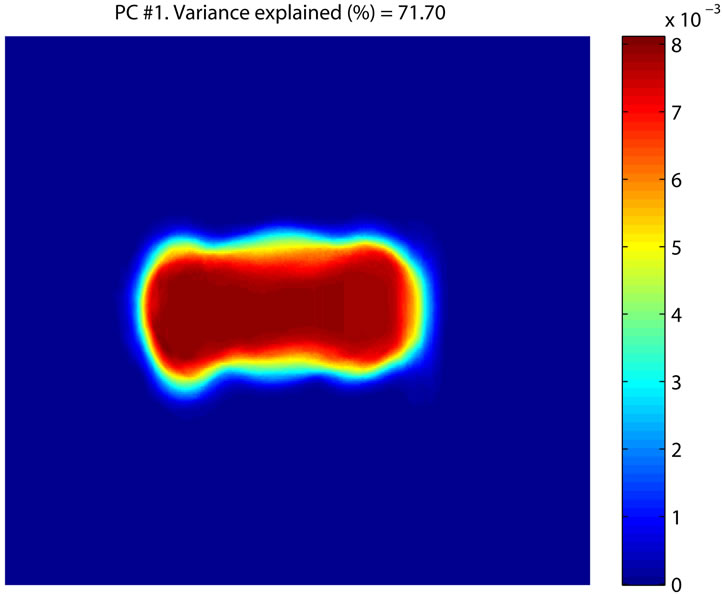
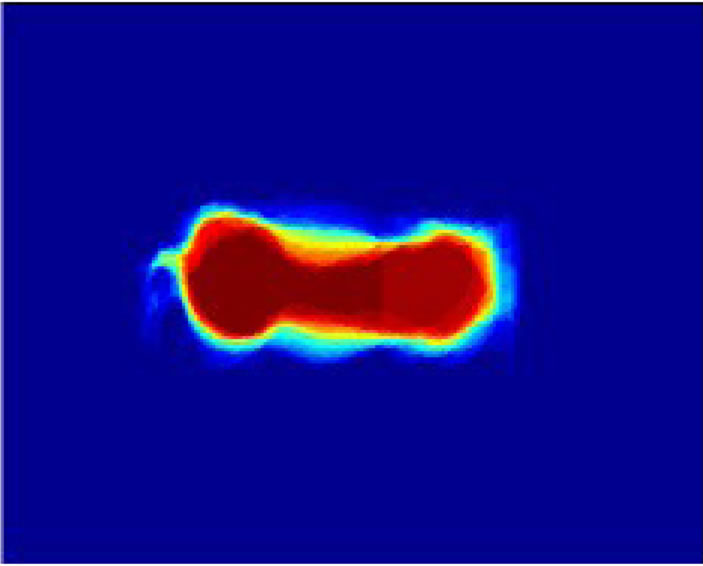
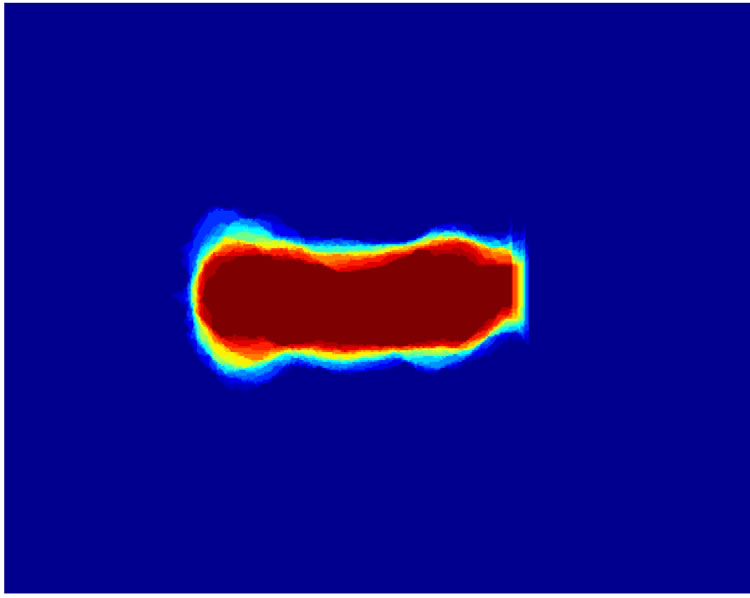
The PCA analysis using centered data only, showed an image almost identical to the mean image in Figure 3(a) for the first component (Figure 4(a)), explaining 71.7 percent of the total variation in the data set. This component may represent the difference between frames in the map image stack, where a large difference represent more motion. A higher score would be a higher degree of movement, and this can be observed in Figure 5, where the pig sample in Figure 5(a) has a general higher movement than the pig in Figure 5(b). The second component using centered data only, explaining 7.54 percent of the variation, represent the diagonal movement be-
 (a)
(a)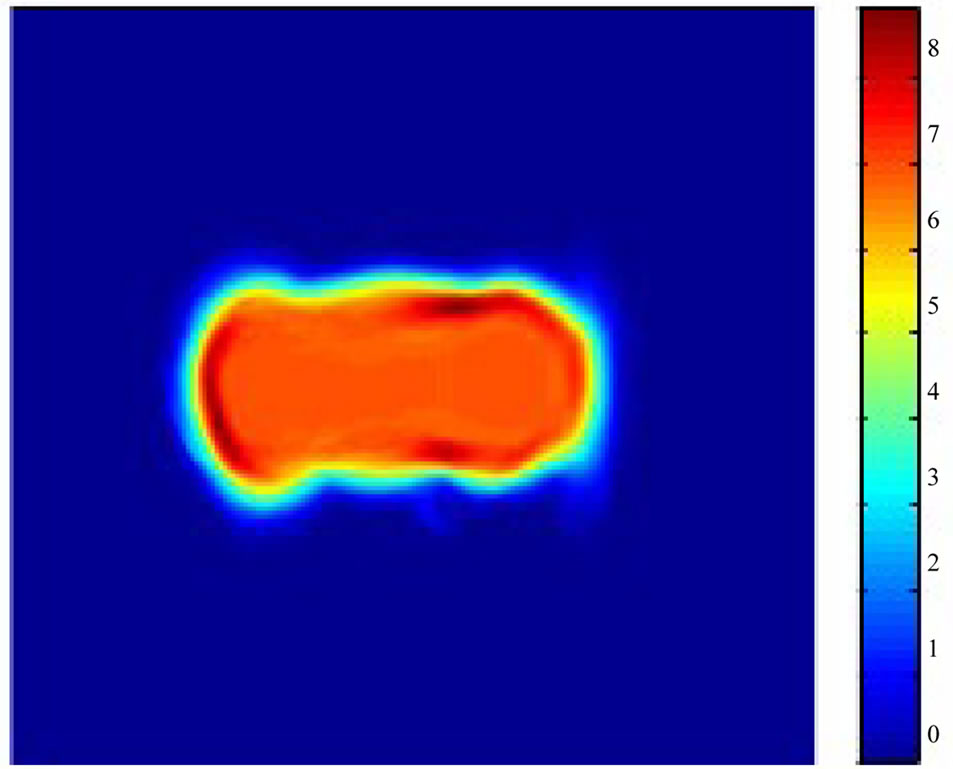 (b)
(b)
Figure 3. Mean and standard deviation pig image.
 (a)
(a) (b)
(b) (c)
(c)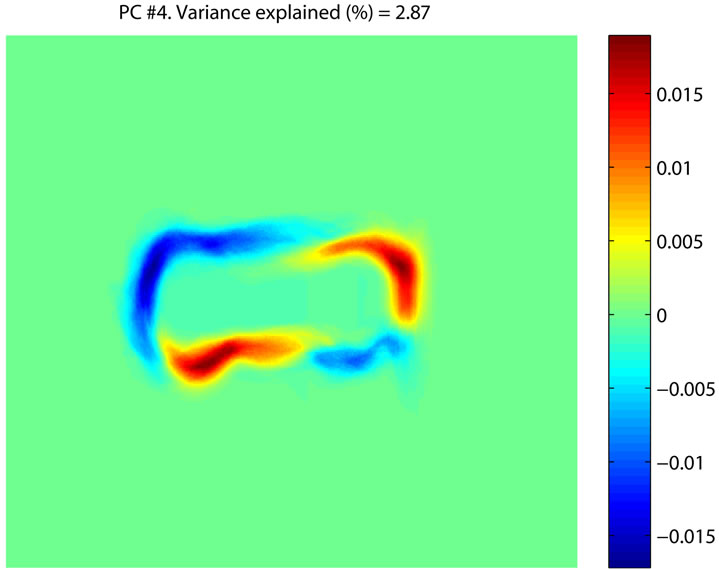 (d)
(d)
Figure 4. Principal (PCA) image component 1 to 4.
 (a)
(a)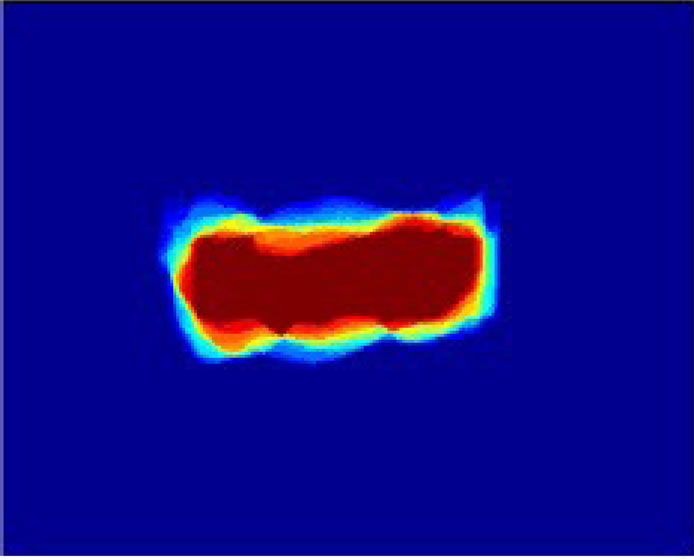 (b)
(b)
Figure 5. Map images of positive (a) and negaTive; (b) score PC1.
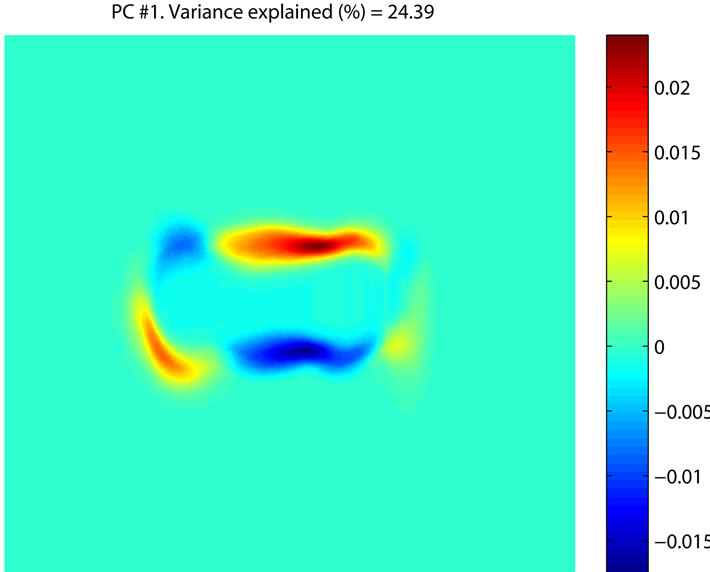
tween the hind part and side of the animal. A pronounced motion on the right side of the hind part and the left side, would give a positive value compared to the opposite giving a negative value. Map image samples representing this component is shown in Figure 6, where Figure 6(a) shows an animal with a positive score and Figure 6(b) an animal with a negative score. Components 3 and 4, representing 3.67 and 2.87 percent of the variation, respectively, represent minor motion patterns which seem to be located around the center body of the animal (PC3) and opposite diagonal movement to PC2 (PC4) (Figures 4(c) and (d)). Moving on to centered and scaled image data, it is shown in Figure 7 that PC2 for centered data is identical for PC1 of centered and scaled data, PC3 and PC2 for scaled, and so forth. After scaling, this diagonal motion pattern represents 24.39 percent of the variation in the scaled data set. Figure 7 shows the map image samples of the first component in the scaled data analysis, which is identical to the second component for the centered data only. The second component in the scaled PCA explained 14.53 percent of the variation, showing positive values around the circumference of the animal, and negative values in the center body identical to the third component for the centered data. Figure 8 shows map image samples from an animal with positive score (Figure 8(a)) and an animal with a negative score (Figure
 (a)
(a)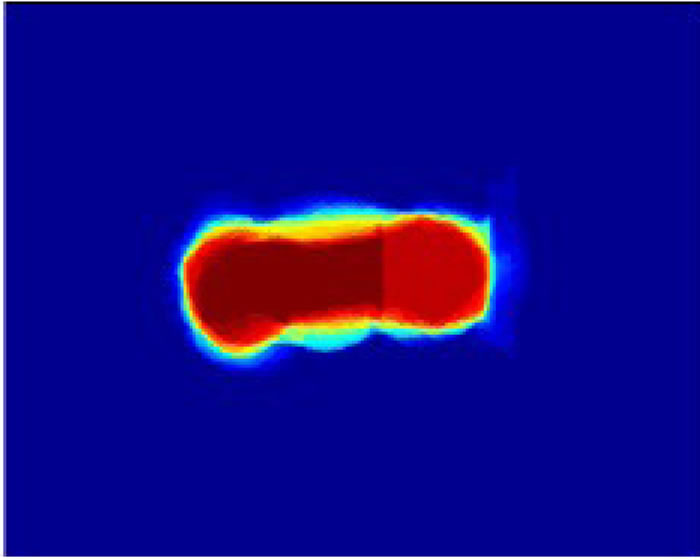 (b)
(b)
Figure 6. Map images of positive (a) and negative; (b) score PC2.
8(b)). The animal in Figure 8(a) seem to have motion related to its circumference, while the animal in 8b is moving within the body core presented in Figure 4(b). The 3rd component for scaled data is identical to the 2nd component for centered data. The 4th component of the scaled data show positive values in the neck part and negative values in the hind part (Figure 7(d)).
4. DISCUSSION
The system presented in this paper is a first step or prototype towards making a full application. To increase the robustness of the system, pigs need to be herded in a more standardized way, making it easier to detect true motion pattern. Uncertainties related to herding were the biggest challenge in the system presented in this paper. Several images where not rotated and centered correctly, which was caused by uneven movement during herding. Many of the animals stopped and turned around during herding from one pen to another, and this challenge may be solved by choosing a different test area or passage way for filming. Pigs are very difficult to herd in a standardized way, due to their curious, almost childlike behavior. However, 1.700 landrace boars were filmed in the period from June 2011 to June 2012, and from these animals we could select 288 animals that were moving
 (a)
(a)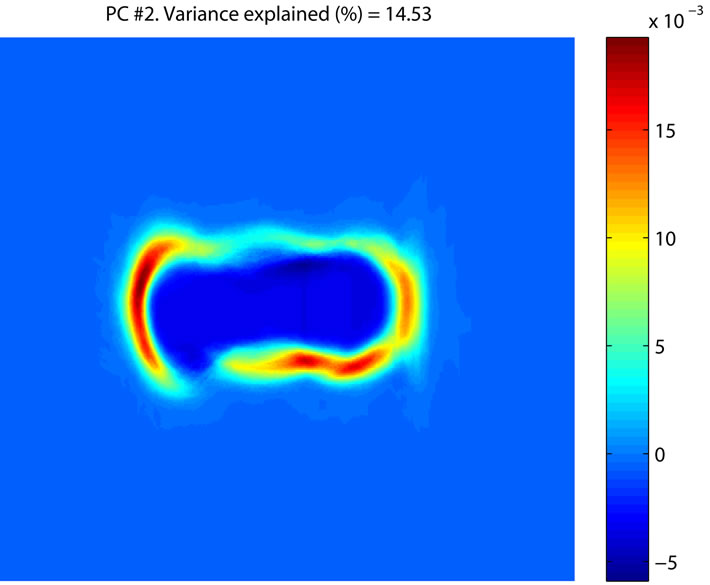 (b)
(b)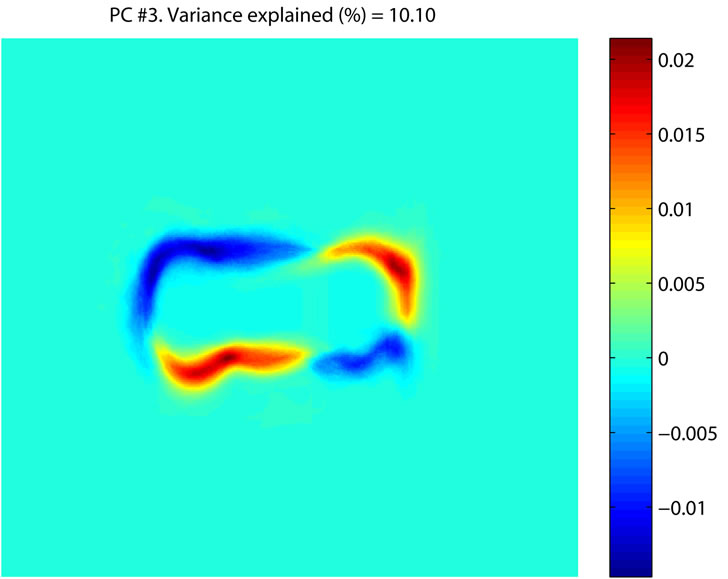 (c)
(c)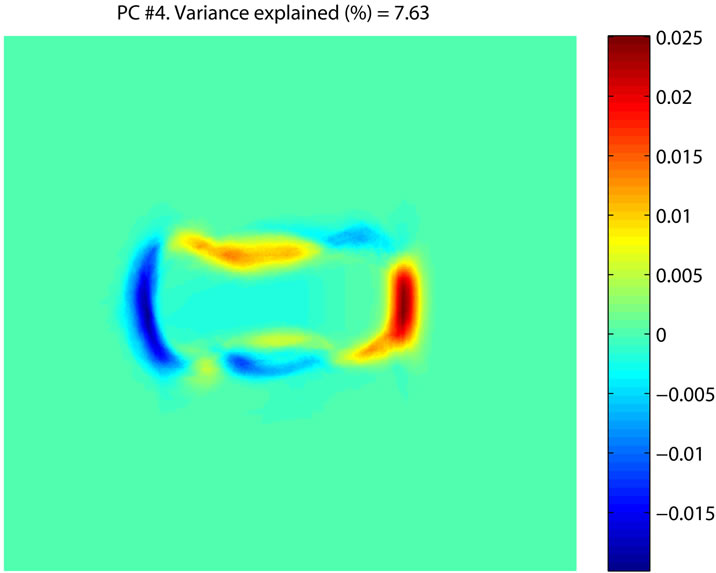 (d)
(d)
Figure 7. PCA image component 1 to 4. Scaled data.
 (a)
(a)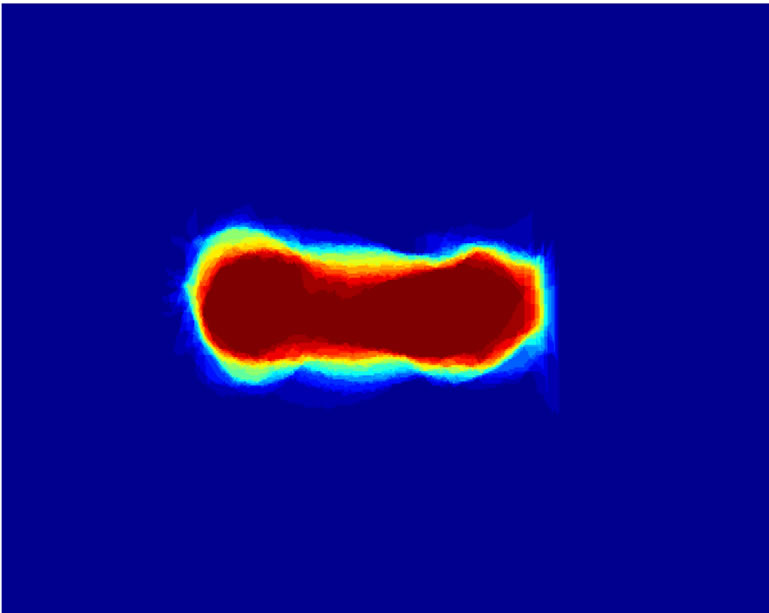 (b)
(b)
Figure 8. Map images of positive (a) and negative; (b) score PC2. Scaled data.
satisfactorily through the test area. The first months during summer 2011, we had problems making the pigs move in a standardized way, but during fall 2011, we were able to get better images from the video of movement. It was very important to keep focus on herding, otherwise the pigs stopped, turned around or started searching for items or food close to the nearby pens. The images from the principal component analysis show that gait patterns can be extracted from a stack of motion frames during pig locomotion. Scaling of data removed the first component was related to general movement, however the first component might be important to visualize the general movement of the animal, relating it to the possibility of lameness. Scaling might not be a good idea if one wants to obtain this general information of movement. The variation explained by the 2nd component (diagonal movement) was lower in the un-scaled data analysis, however, scaling might sometimes inflate the noise level, and the true level of explained variation might be misinterpreted. The first component in the unscaled data set seems to represent a general motion component very similar to the mean image presented in Figure 3. This component might be interesting to include in an application where general movement is an indicator for lameness. From the results, it was shown that a higher degree of movement on component 1, increased the variation in the diagonal movement in component 2. If this diagonal movement combined with an increase in general movement is an indicator for lameness, one could construct an application using the scores from component 2 to give an alert when animals reach a certain level of diagonal movement (Figure 9). The stockman or operator can get a signal or message when an animal shows an abnormal movement or behavior, and then further investigate this particular animal. A future application should also be calibrated against subjective scores of lameness, or with pathological exams, i.e. CT scans of joints. This would give a model system for predicting lameness in pigs using video image analysis. The tracking of animals or ID is also a challenge in a farm environment, however this can be solved by radio frequency tags (RFID) or computer vision, connecting the electronic or vision ID system with the pig locomotion vision system.
5. CONCLUSION
The described system for monitoring pig locomotion shows that it is possible to extract information from stacks of images grabbed from video filming of moving pigs. The system was set up as a low-cost system in a farm environment. By decomposing the image stack of frames and by the use of multivariate image analysis such as principal component analysis (PCA), one can obtain components which are related to particular motion patterns in pig locomotion. In conclusion, these patterns can be related to the individual score for each animal, which makes it possible to classify or score animals based on a particular motion pattern. This pattern can be related or calibrated against subjective lameness evaluation by trained operators or pathological exams, such as CT scans of joints. Future applications should focus on im-
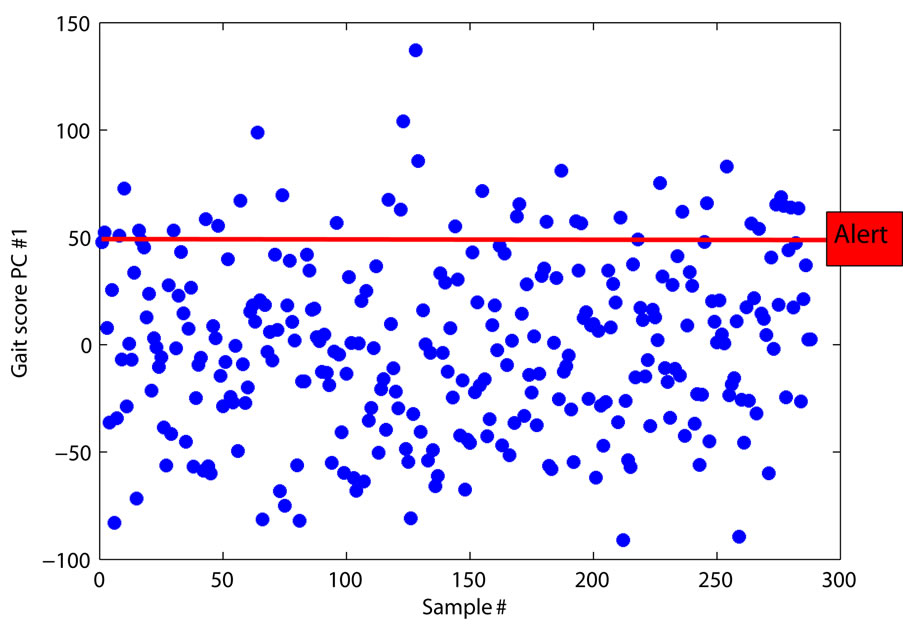
Figure 9. Possible application for VIA. Abnormal gaitalert.
proving herding and test areas, and tracking of animals to obtain their ID using electronic tagging and/or vision systems.
6. ACKNOWLEDGEMENTS
The author gratefully acknowledges the team at the Norsvin Delta boar test station and field technician Lars Terje Bogevik for the practical work during set up of the web camera system. The Norwegian Research Council is gratefully acknowledged for providing financial support for this research as part of the Robust Pig project.
REFERENCES
- Fukawa, K. and Kusuhara, S. (2000) The genetic and non-genetic aspects of leg weakness and osteochondrosis in pigs. Asian Australasian Journal of Animal Sciences, 14, 114-122.
- Grondalen, T. (1974) Incidence and realtionship to skeletal lesion, feed level, protein and mineral supply, exercise and exterior conformation. Acta Veterinaria Scandinavica, 15, 555.
- Aydin, A., Cangar, O., Eren Ozcan, S., Bahr, C. and Berckmans, D. (2010) Application of a fully automatic analysis tool to assess the activity of broiler chickens with different gait scores. Computers and Electronics in Agriculture, 73, 194-199. doi:10.1016/j.compag.2010.05.004
- Calabotta, D. and Kornegay, E. (1982) Restricted energy intake and elevated calcium and phosphorus intake for gilts during growth. II. Gait characteristics analyzed from 16-MM motion picture photography. Journal of Animal Science, 55, 1395-1404.
- Deshazer, J.A., Moran, P., Onyango, C.M., Randall, J.M. and Schofield, C.P. (1988) Imaging systems to improve stockmanship in pig production. AFRC Institute of Engineering Research, Silsoe.
- Lundeheim, N. (1987) Genetic analysis of osteochondrosis and leg weakness in the swedish pig progeny testing scheme. Acta Agriculturae Scandinavica, 37, 159-173. doi:10.1080/00015128709436552
- Huang, J., Wium, H., Qvist, K.B. and Esbensen, K.H. (2003) Multi-way methods in image analysis—Relationships and applications. Chemometrics and Intelligent Laboratory Systems, 66, 141-158. doi:10.1016/S0169-7439(03)00030-3
- Johansen, J., Egelandsdal, B., Roe, M., Kvaal, K. and Aastveit, A.H. (2007) Calibration models for lamb carcass composition analysis using Computerized Tomography (CT) imaging. Chemometrics and Intelligent Laboratory Systems, 87, 303-311. doi:10.1016/j.chemolab.2007.03.009
- Lavrsen, K. (2012) Motion, a software motion detector. http://www.lavrsen.dk/foswiki/bin/view/Motion/WebHome
- Dropbox (2012) Dropbox Inc. http://www.dropbox.com
- MATLAB Version 7.14 (2012) Image Processing Toolbox Version 8.0, Statistics Toolbox 8.0, 1984-2011 The MathWorks, Inc.
- Otsu, N. (1979) A threshold selection method from gray-level histograms. IEEE Transactions on Systems, Man, and Cybernetics, 9, 62-66.
- Wang, Y., Yang, W., Winter, P. and Walker, L. (2008) Walk-through weighing of pigs using machine vision and an artificial neural network. Biosystems Engineering, 100, 1117-1251. doi:10.1016/j.biosystemseng.2007.08.008