Open Journal of Civil Engineering, 2011, 1, 7-12
doi:10.4236/ojce.2011.12002 Published Online December 2011 (http://www.SciRP.org/journal/ojce)
Copyright © 2011 SciRes. OJCE
Flexible Pavement Analysis Considering Temperature
Profile and Anisotropy Behavior in Hot Mix Ashalt Layer
Joonho Choi1, Youngguk Seo2, Sung-Hee Kim3*, Samuel Beadles4
1Postdoctor al R ese arch Fellow, Georgia Institute of Technology, Atlanta, USA
2Pavement Research Group, Korea Expressway Corporation, Seongnam-si, South Korea
3Assistant Professor, Civil and Construction Engineering, Southern Polytechnic State Universit y, Marietta, USA
4Civil and Construction Engineering, Southern Polytechnic State University, Marietta, USA
E-mail: Joonho@gatech.edu, seoyg89@hotmail.com, {*skim4, sbeadles}@spsu.edu
Received September 20, 2011; revised October 31, 2011; accepted November 14, 2011
Abstract
A three Dimensional finite element model (FEM) incorporating the anisotropic properties and temperature
profile of hot mix asphalt (HMA) pavement was developed to predict the structural responses of HMA
pavement subject to heavy loads typically encountered in the field. In this study, ABAQUS was adopted to
model the stress and strain relationships within the pavement structure. The results of the model were veri-
fied using data collected from the Korean Highway Corporation Test Road (KHCTR). The results demon-
strated that both the base course and surface course layers follow the anisotropic behavior and the incorpora-
tion of the temperature profile throughout the pavement has a substantial effect on the pavement response
predictions that impact pavement design. The results also showed that the anisotropy level of HMA and base
material can be reduced to as low as 80% and 15% as a result of repeated loading, respectively.
Keywords: Anisotropic Behavior, Finite Element Method, Aggregate Base, HMA
1. Introduction
Existing FEMs that model the behavior of layers in
HMA pavement rely on simplifying assumptions about
the variations of the properties within the pavement.
Specifically, existing models assume linear and isotropic
variations within the layers of the pavement and use the
annual maximum or minimum pavement temperature to
recommend a suitable asphalt binder performance grade.
These assumptions are made in order to reduce the com-
putational complexity involved in modeling the behavior
of HMA pavement. A number of researchers, however,
have shown that the pavement materials exhibit nonlin-
ear, anisotropic behavior [1-4]. Researchers also men-
tioned that the structural or load-carrying capacity of the
pavement varies with temperature for HMA layer and it
is necessary to predict the temperature distribution within
the HMA layers to accurately determine in situ strength
characteristics of flexible pavement [5].
This paper deals with the predictions of the pavement
critical responses using three dimensional FEM analysis
technique. The FEM developed using ABAQUS in this
study incorporates the anisotropic properties of the HMA
and base layers with temperature profile variations through
the HMA layer. The approach was also validated by
comparing measured pavement responses with the pre-
dictions of the three dimensional finite element analysis
results.
2. Anisotropic Behavior of Granular
Materials
Inherent anisotropy in granular materials exists even be-
fore the pavement is subjected to traffic due to the effects
of compaction and gravity [6]. Stresses due to construc-
tion operations and traffic are anisotropic and new parti-
cle contacts are formed due to breakage and slippage of
particles, which induces further anisotropy [6]. To more
accurately investigate the effect of stress-dependency of
granular materials on pavement response and surface
deflection predictions, researchers developed a method to
fully characterize the stress-sensitive and cross-anisot-
ropic properties of unbound aggregate bases, which are
resilient moduli in the vertical and radial directions, Ey
and Ex; shear modulus in vertical direction, Gxy; Pois-
son’s ratio for strain in the vertical direction due to a
J. CHOI ET AL.
8
horizontal direct stress, υxy; and Poisson’s ratio for
strain in any horizontal direction due to a horizontal di-
rect stress, υxx [2,4].
As expressed in Equations (1) through (3), the modulus
of the unbound aggregate base was modeled using an
Uzan type stress-dependent model with a cross- anisot-
ropic approach based on the recent studies that empha-
sized the importance of accounting not only for stress
dependency but also the anisotropy in order to properly
model the unbound aggregate modulus properties and the
stress state distributions in the layer [2,4].
23
1
kk
yaa
I
Ek
PP
 
 
 
oct
τ
(1)
x
y
E
E
n (2)
xy
y
G
E
m (3)
In Equatipns (1), (2), and (3), Ey is the vertical
modulus, Ex is the horizontal modulus, Gxy is the shear
modulus, I is the first stress invariant (bulk stress), τoct is
the octahedral shear stress, Pa is the atmospheric pres-
sure, and ki are material model parameters obtained from
regression analyses of the laboratory modulus test data.
To consider the anisotropic behavior of HMA layer,
the horizontal and shear moduli ratio was approximated
and used as an input for the FEM analysis.
3. Field Response Test
The KHCTR has been regarded as the most realistic re-
search tool to evaluate the performance of pavements
influenced by many complex variables such as construc-
tion, traffic, climatic, materials, etc. Test road in Korea
was first constructed in December 2002 and opened to
traffic in March 2004. Road research institute at the Ko-
rea Highway Corporation (KHC) played a leading role in
the construction and operation of this test road, and con-
ducted a wide range of field tests to better characterize
the response and performance of highway pavements
[7,8]. The KHCTR is located between the Yeo-ju junc-
tion on Interstate 50 and the Gam-gok interchange on
Interstate 45, and it goes almost parallel to the Interstate
45. This two-lane, 7.7 km-long highway was composed
of 25 concrete and 33 asphalt sections as illustrated in
Figure 1.
With projected AADT (Average Annual Daily Traffic)
of 57,520 in year 2011 and a load distribution factor of
0.8, the traffic volume for a 10-year design life was esti-
mated to be 44.7 million 80-kN ESALs (Equivalent Single
Axle Loads) for all pavement sections. The AASHTO
interim design guide was adopted for the structural de-
sign of both pavement types. Detailed information on
design and construction of the KHCTR can be found
elsewhere [9].
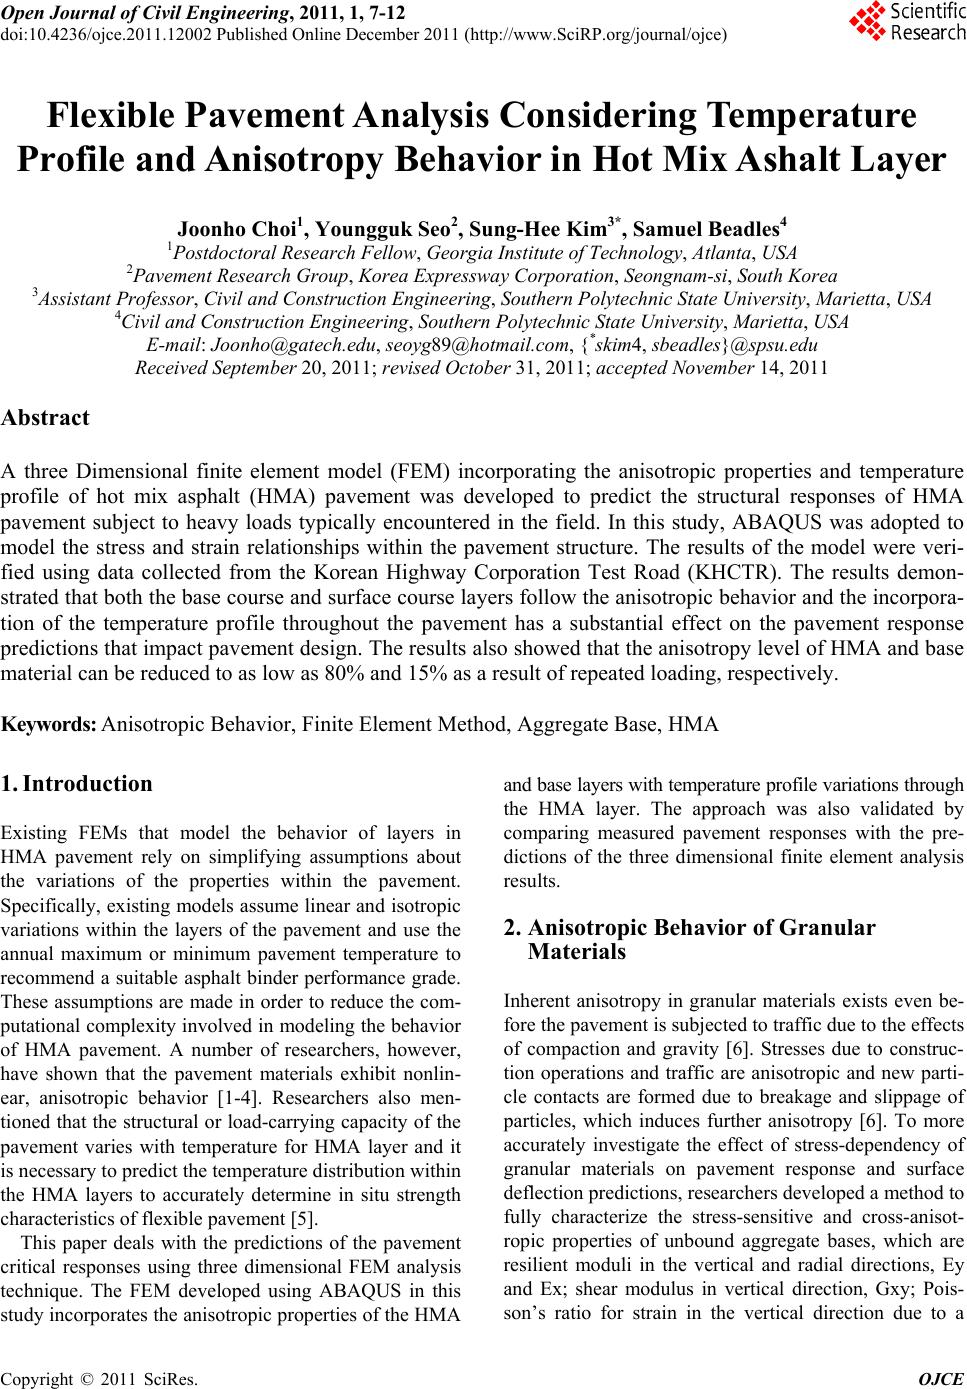
Approximately 1900 sensors were installed at KHCTR
to obtain stress and strain responses and to monitor
moisture and temperature variations at different locations
of sections during construction. Most of asphalt sections
were instrumented with 636 sensors that include strain
gauges, soil pressure cells and thermal couples. Figure 2
illustrates a sensor layout for one of asphalt sections, A5,
where strain gauges were placed in longitudinal and
transverse directions to quantify the anisotropic levels in
HMA layers. In Figure 2, ASTM 19 is the 19-mm dense
graded HMA used for surface layer, BB5 is the 25-mm
dense graded HMA used for intermediate layer, and BB3
is the 25-mm dense graded HMA used for base layer.
Thermocouples were also embedded from the surface to
the bottom of asphalt layer and those measurements were
considered as inputs for the FEM described in subse-
quent sections.
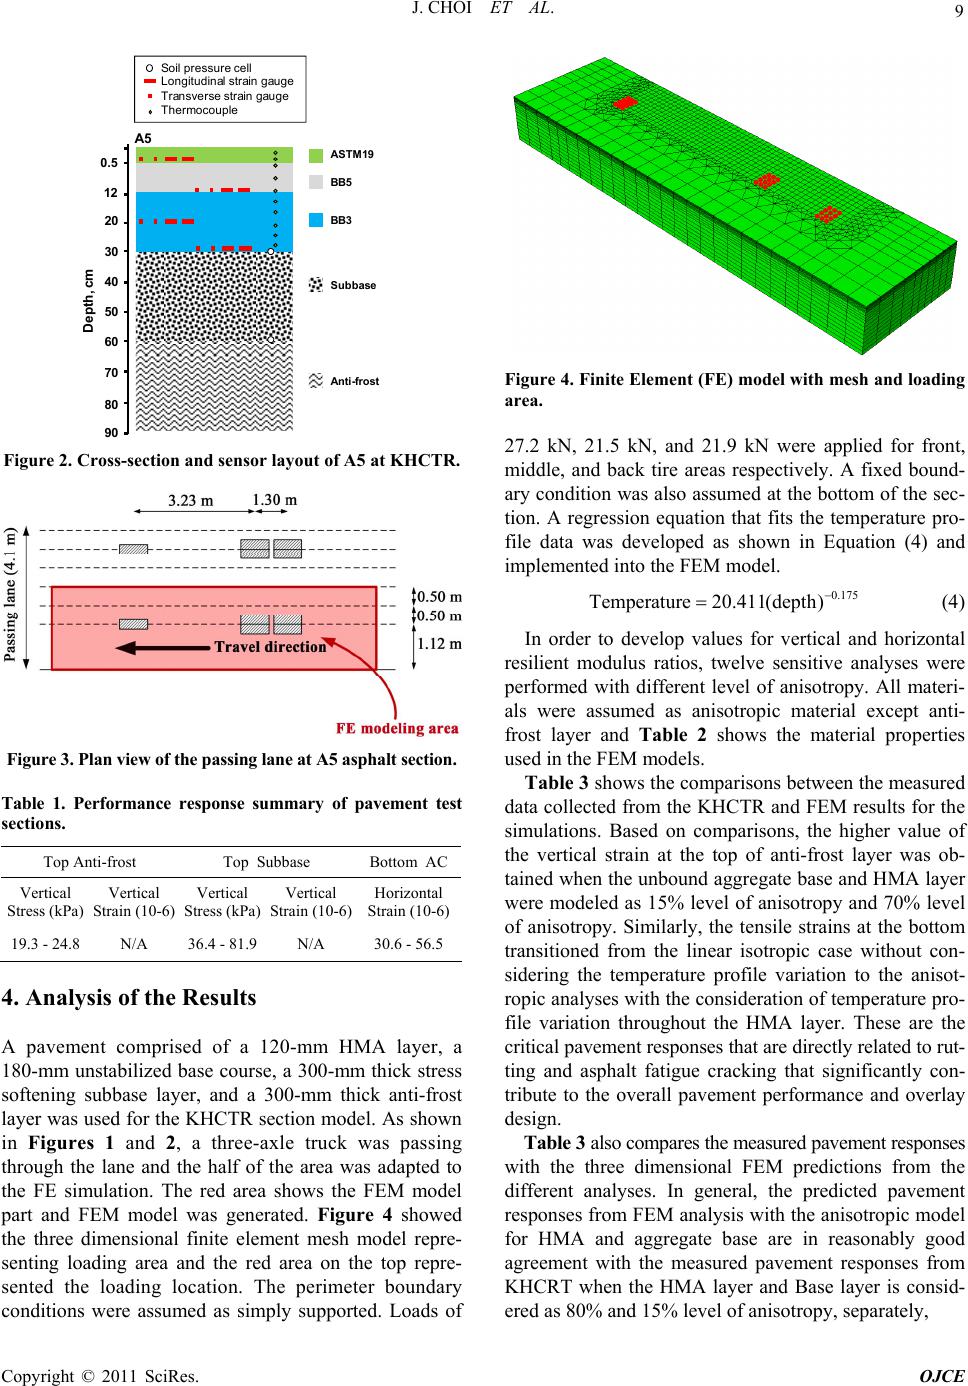
A series of moving load tests was performed at A5
with a dump truck. A three-axle dump truck (single tire
front and dual tire rear tandem) with a 12R22.5 type ra-
dial tire was utilized as a load source all along. This test
vehicle was operated by the same highly trained driver to
minimize natural sway in a moving vehicle. The planar
configuration of tire and axle is seen in Figure 3. During
testing, air pressures for tires of each axle were main-
tained at levels: 1076 kPa (1st axle), 828 kpa (2nd axle),
and 1076 kpa (3rd axle). These pressure levels have been
determined by averaging field survey data collected at
countrywide weighing stations in Korea.
The test results conducted was selected for the imple-
mentation of FEM developed in this study. The full-scale
pavement test results were shown in Table 1. First and
second values in the table were the minimum and maxi-
mum from the experiments, respectively.
Yeo-ju JC
Interstate 45
25 PCC Sections 33 AC Sect ions
Gam-gok IC
KHC Tes t Roa d
Figure 1. Plan view of KHCTR.
Copyright © 2011 SciRes. OJCE
9
J. CHOI ET AL.
Subbase
ASTM 19
BB5
BB3
Anti-f r o s t
A5
.5
12
30
20
40
90
50
60
70
80
Depth, cm
Soil pressur e cell
Longitudinalstrain gauge
Tra nsverse strain ga uge
Thermocouple
0.5
Figure 2. Cross-section and sensor layout of A5 at KHCTR.
Figure 3. Plan view of the passing lane at A5 asphalt section.
Table 1. Performance response summary of pavement test
sections.
Top Anti-frost Top Subbase Bottom AC
Vertical
Stress (kPa)
Vertical
Strain (10-6)
Vertical
Stress (kPa)
Vertical
Strain (10-6)
Horizontal
Strain (10-6)
19.3 - 24.8 N/A 36.4 - 81.9 N/A 30.6 - 56.5
4. Analysis of the Results
A pavement comprised of a 120-mm HMA layer, a
180-mm unstabilized base course, a 300-mm thick stress
softening subbase layer, and a 300-mm thick anti-frost
layer was used for the KHCTR section model. As shown
in Figures 1 and 2, a three-axle truck was passing
through the lane and the half of the area was adapted to
the FE simulation. The red area shows the FEM model
part and FEM model was generated. Figure 4 showed
the three dimensional finite element mesh model repre-
senting loading area and the red area on the top repre-
sented the loading location. The perimeter boundary
conditions were assumed as simply supported. Loads of
Figure 4. Finite Element (FE) model with mesh and loading
area.
27.2 kN, 21.5 kN, and 21.9 kN were applied for front,
middle, and back tire areas respectively. A fixed bound-
ary condition was also assumed at the bottom of the sec-
tion. A regression equation that fits the temperature pro-
file data was developed as shown in Equation (4) and
implemented into the FEM model.
0.175
Temperature 20.411(depth)
(4)
In order to develop values for vertical and horizontal
resilient modulus ratios, twelve sensitive analyses were
performed with different level of anisotropy. All materi-
als were assumed as anisotropic material except anti-
frost layer and Table 2 shows the material properties
used in the FEM models.
Table 3 shows the comparisons between the measured
data collected from the KHCTR and FEM results for the
simulations. Based on comparisons, the higher value of
the vertical strain at the top of anti-frost layer was ob-
tained when the unbound aggregate base and HMA layer
were modeled as 15% level of anisotropy and 70% level
of anisotropy. Similarly, the tensile strains at the bottom
transitioned from the linear isotropic case without con-
sidering the temperature profile variation to the anisot-
ropic analyses with the consideration of temperature pro-
file variation throughout the HMA layer. These are the
critical pavement responses that are directly related to rut-
ting and asphalt fatigue cracking that significantly con-
tribute to the overall pavement performance and overlay
design.
Table 3 also compares the measured pavement responses
with the three dimensional FEM predictions from the
different analyses. In general, the predicted pavement
responses from FEM analysis with the anisotropic model
for HMA and aggregate base are in reasonably good
agreement with the measured pavement responses from
KHCRT when the HMA layer and Base layer is consid-
red as 80% and 15% level of anisotropy, separately, e
Copyright © 2011 SciRes. OJCE
J. CHOI ET AL.
10
Table 2. Anisotropic material properties.
Simulation Layer Thickness Vertical ResilienPoisson’s Ratioent Horizontal
Poisson's Ratio Shear Stress
Number Type (m) t Vertical Horizontal Resili
Modulus (MPa)Modulus (MPa) (MPa)
HMA 0.12 2760 0.35 1930 0.245 1930
Base 0.18 517 0.35 78 0.05 78
Subbase
HMA: 70%
Base: 15%
2760 1930 0. 1930
se
HMA: 70%
2760 1930 0. 1930
se
HMA: 70%
2760 2210 0. 2210
se
HMA: 80%
2760 2210 0. 2210
se
HMA: 80%
2760 2210 0. 2210
se
HMA: 80%
2760 2480 0. 2480
se
HMA: 90%
2760 2480 0. 2480
se
HMA: 90%
2760 2480 0. 2480
se
Base: 50%
0.30 241 0.35 36 0.05 36
Anti-frost 0.30 69 0.40 - - -
HMA 0.12 0.35 245
Base 0.18 517 0.35 155 0.11 155
Subba0.30 241 0.35 72 0.11 72
Base: 30%
Anti-frost 0.30 69 0.40 - - -
HMA 0.12 0.35 245
Base 0.18 517 0.35 259 0.18 259
Subba0.30 241 0.35 121 0.18 121
Base: 50%
Anti-frost 0.30 69 0.40 - - -
HMA 0.12 0.35 28
Base 0.18 517 0.35 78 0.05 78
Subba0.30 241 0.35 36 0.05 36
Base: 15%
Anti-frost 0.30 69 0.40 - - -
HMA 0.12 0.35 28
Base 0.18 517 0.35 155 0.11 155
Subba0.30 241 0.35 72 0.11 72
Base: 30%
Anti-frost 0.30 69 0.40 - - -
HMA 0.12 0.35 28
Base 0.18 517 0.35 259 0.18 259
Subba0.30 241 0.35 121 0.18 121
Base: 50%
Anti-frost 0.30 69 0.40 - - -
HMA 0.12 0.35 32
Base 0.18 517 0.35 78 0.05 78
Subba0.30 241 0.35 36 0.05 36
Base: 15%
Anti-frost 0.30 69 0.40 - - -
HMA 0.12 0.35 32
Base 0.18 517 0.35 155 0.11 155
Subba0.30 241 0.35 72 0.11 72
Base: 30%
Anti-frost 0.30 69 0.40 - - -
HMA 0.12 0.35 32
Base 0.18 517 0.35 259 0.18 259
Subba0.30 241 0.35 121 0.18 121
Anti-frost 0.30 69 0.40 - - -
HMA: 80%
Anti-frost 0.30 69 0.40 - - -
Copyright © 2011 SciRes. OJCE
J. CHOI ET AL. 11
Table 3. results withrent anisotropievel.
Top Anti-frost Top Base Bottom AC
FEM diffec l
Bottom Subbase Top Subbase Bottom Base
Anisotropy Vl VVealVealVertical
Level ertical Vertica
Stress
(kPa)
Strain
(10–6)
ertical Vertical
Stress
(kPa)
Strain
(10–6)
rtical Vertic
Stress
(kPa)
Strain
(10–6)
rtical Vertic
Stress
(kPa)
Strain
(10–6)
ical Vert
Stress
(kPa)
Strain
(10–6)
Horizontal
Strain
(10–6)
HMA: 70%
Base: 15% 23.5 300 26.5 120 40.2 180 46.8 100 68.5 140 59
HMA: 70%
Base: 30% 17.8 240 20.4 100 36.9 166 45.9 109 76.6 155 36
22.8 285 25.6 116 38.3 168 44.4 98 64.3 132 54
17.1 225 19.4 99 34.1 153 42.0 100 68.6 140 32
(Te
Variation Not 21.8 272 24.4 111 35.9 157 41.4 92 59.3 122 90
19.3
–24.
36.4
–81.
30.6
–56.
HMA: 70%
Base: 50% 14.2 190 16.1 95 33.4 154 44.0 110 81.5 159 19
HMA: 80%
Base: 15%
HMA: 80%
Base: 30% 17.4 230 19.8 102 35.4 159 43.8 104 72.3 147 34
HMA: 80%
Base: 50% 13.9 185 15.8 92 32.2 148 42.1 106 77.3 152 18
HMA: 90%
Base: 15% 22.1 276 24.8 112 36.7 160 42.3 93 60.7 125 50
HMA: 90%
Base: 30%
HMA: 90%
Base: 50% 13.7 181 15.5 90 31.1 144 40.5 102 73.7 146 18
Isotropic,
mperature
Considered)
Exp 8 9 5
ith the temperature profile consideration throughout the
ect of anisotropic behavior of HMA
performance, and the level of anisotropy of HMA and
Kim, D. N. Little and E. Tutumluer, “Validated
dicting Field Performance of Aggregate
Transportation Research Record 1873,
2003.
13, TRB, National Research Council, Washington
, Vol. 133, No. 10, 2007, pp. 582-
w
pavement. This indirectly shows that anisotropic model-
ing and temperature variation consideration of HMA and
base layers provide a much more realistic approximation
of the measured responses. With better and more accu-
rate predictions of these responses, a more structurally
adequate pavement can be designed.
. Conclusions 5
he synergistic effT
and base layers considering the temperature variation
throughout the HMA layer was investigated by perform-
ing a three dimensional finite element analyses. The re-
sults from the ABAQUS finite element models clearly
showed that anisotropic model of both the asphalt and
aggregate base layers gave the most realistic predictions
when compared to measured values for pavement re-
sponses. Substantially higher critical pavement responses
were predicted with the increased anisotropic level of
HMA and base layer. Horizontal strain is a critical
pavement response, which is directly related to fatigue
aggregate base impacts the stress and strain distributions.
With better and more accurate predictions of these re-
sponses, a structurally more adequate pavement can be
designed.
6. References
] S. H.[1
Model for Pre
Base Courses,
[2] S. H. Kim, D. N. Little and E. Masad, “Simple Methods
to Estimate Inherent and Stress-Induced Anisotropic
Level of Aggregate Base,” Transportation Research Re-
cord 19
DC, 2005, pp. 24-31.
[3] S. H. Kim, D. N. Little and E. Tutumluer, “Effect of
Gradation on Nonlinear Stress-Dependent Behavior of a
Sandy Flexible Pavement Subgrade,” Journal of Trans-
portation Engineering
589. doi:10.1061/(ASCE)0733-947X(2007)133:10(582)
[4] E. Tutumluer, D. N. Little and S. H. Kim, “Validated
Copyright © 2011 SciRes. OJCE
J. CHOI ET AL.
12
,
, Vol. 132, No. 2, 2006, pp. 162-167.
Model for Predicting Field Performance of Aggregate
Base Courses,” Transportation Research Record 1837,
TRB, National Research Council, Washington DC, 2003
pp. 41-49.
[5] B. K. Diefenderfer, I. L. Al-Qadi and S. D. Diefenderfer,
“Model to Predict Pavement Temperature Profile: De-
velopment and Validation,” Journal of Transportation
Engineering
doi:10.1061/(ASCE)0733-947X(2006)132:2(162)
[6] J. J. Dong and Y. W. Pan, “Micromechanics Model for
Elastic Stiffness of Non-Spherical Granular Assembly,”
International Journal for Numerical and Ana
Methods in Geomechanics, Vol. 23, 1999, pp. 1075
l
-1100.
ytical
doi:10.1002/(SICI)1096-9853(199909)23:11<1075::AID-
NAG24>3.0.CO;2-S
[7] Y. Seo, “Distress Ev
olution in Highway Flexible Pave-
Full Scale in Situ Evaluation of Strain Char-
poration, “A Study on the Construc-
ments: A 5-Year Study at the KHC Test Road,” ASTM
Journal of Testing and Evaluation, Vol. 38, No. 1, 2010,
pp. 32-41.
[8] Y. Seo, “A
acteristics at Highway Flexible Pavement Sections,”
ASTM Journal of Testing and Evaluation, Vol. 38, No. 4,
2010, pp. 390-399.
[9] Korea Highway Cor
tion and Management of Korea Highway Test Road,”
Final Report, 2002.
Copyright © 2011 SciRes. OJCE