Paper Menu >>
Journal Menu >>
 J. Serv. Sci. & Management, 2008, 1: 255-258 Published Online December 2008 in SciRes (www.SciRP.org/journal/jssm) Copyright © 2008 SciRes JSSM 1 The Evaluation of Enterprises’ Sustainable Superiority Degree of Technical Innovation Based on DEA Method Bing Jiang, Lu Yang & Jun Fang School of Management, Hefei University of Technology, 230009, China Email: bing-jiang@sohu.com, yanglu_suosuome@tom.com, ice1029@gmail.com Received August 31 st , 2008; received November 20 th , 2008; accepted December 5 th , 2008. ABSTRACT The paper at first expounds two new concepts of sustainability degree and superiority degree, and founds a method of DEA of relative efficiency index to rank all decision-making-units having been identified efficient. On the basis of them, the definition and arithmetic are given to analyze them. Then seven input and output techno-innovation indexes which belong to six automobile listed companies from 2002 to 2005 are used to evaluate enterprises’ sustainability degree and superiority degree by vertical and horizontal calculation based on DEA method. At last, we get general conclusions about enterprises’ sustainable superiority degree by weighting calculation. Keywords: technical innovation, DEA, relative efficiency, sustainable superiority evaluation 1. Introduction DEA model (Data Envelopment Analysis) is one of ma- thematical programming approaches to analyze decision- making-units’ (DMUs) relative efficiency. To some enterprises’ inputs and outputs which are observed in a period of time, we apply DEA model and acquire not only vertical evaluation of enterprises’ sustainable innovation based on time as DMU, but also horizontal relative evaluation of enterprises’ innovation performance based on enterprises as DMU. However, in traditional DEA model, DMU can only be examined as “effective” or “ineffective” but can not be ranged by their weights. Furthermore, each DMU’ weight is computed from the most beneficial angle, which, obviously, will give birth to that most of DMU even all will be described as effective. Consequently, the traditional DEA model will affect the further comparable analysis. The purpose of this paper is to calculate degree of technical innovation sustainability and superiority according to the definition of relative efficiency index and to present a concept of sustainable superiority degree. In this paper, we apply the ideal DMU and obtain a standard weights vector as referenced ones, on the basis of these, the values of relative efficiency index are available. We select six listed companies in automobile industry as our research objects, and the analysis data are based on seven indexes, which reflect the innovations and originate from the 2002-2005 years’ reports of relating companies. 2. DEA Model Based On Relative Efficiency Indexes 2.1. The Basic Principle of Traditional DEA Model Technical innovation in a specific enterprise can be described by a group of innovation indexes of input- output. We use vector A j to stand for input of decision- making-unit j (DMUj) and vector B j for its output, i.e.: A j =(a 1j , a 2j , ..., a mj ) T ,B j =(b 1j , b 2j , ..., b sj ) T . The dual programming model of DMUj can be constructed as below: D: min V D =y s.t. miyasxa ijij n jij ,,2,1, 0 1 L==+ ∑ = skbtxb kjkj n jkj ,,2,1, 0 1 L==− ∑ = (1) x jnj ,,2,1,0 L = ≥ ; s i mi ,,2,1,0 L = ≥ ; t k sk ,,2,1,0 L = ≥ Where x j stands for the jth DMU’ decision-making variable; s i for the slack variable of the ith input index; t k for the surplus variable of the kth output index; and y for the input proportional variable. If non-Archimedes infinitesimal quantity is applied, then the equation will appear to: : ε D min V D )()( 11 ∑∑ == +−= s kk m ii tsy εε s.t. miyasxa ijij n jij ,,2,1, 0 1 L==+ ∑ = skbtxb kjkj n jkj ,,2,1, 0 1 L==− ∑ = (2)  256 Bing Jiang, Lu Yang & Jun Fang Copyright © 2008 SciRes JSSM x j nj,,2,1,0 L = ≥ ; s i mi ,,2,1,0L = ≥ ; t k sk ,,2,1,0L=≥ On the assumption that optimum solutions of equation (2) are x j* (j=1,2,…, n), s i* (i=1,2,…, m), t k* (k=1,2,…, s), y * , some effective judgment rules will go like this: (1) y * =1,and s i* =0(i=1,2,…, m)﹑t k* =0(k=1,2,…, s), then DMUj 0 is DEA effective, and its economic significance means the optimal innovative efficiency and constant return to scale simultaneously. (2) y * =1, we can conclude that DMUj 0 is DEA ineffective. Its economic significance means it is not simultaneous to reach optimal innovative efficiency and constant return to scale. 2.2. DEA Model Based on Relative Efficiency Index To overcome the deficiency of traditional model which is unable to discriminate the differences among different efficient units, we apply ideal DMU. To each input index, if minimum input vectors are made of minimums of all DMU on the assumption, then A min =(a 1min , a 2min ,…, a mmin ); likewise, if maximum output vectors are made of maximum of all DMU, we mark B max =(b 1max , b 2max ,…, b smax ), then we can say (A min , B max ) stand for innovation activity related to ideal DMU. We add the ideal DMU to DEA model, and under the thought of using DEA method to calculate weight, an efficient index model can be constructed as below: miv sku Av Bu nj Av Bu ts Av Bu h i k T T j T j T T T , , , …=≥ …=≥ ≤ …=≤ = ,10 ,10 1 ,1,1.. max min max min max max (3) The model is used to obtain a series of weights v 1 , v 2 ,…, v m ; u 1 , u 2 ,…, u m , which can optimize the efficiency indexes of ideal DMU if all observed DMU’ indexes meet the inequality: h j ≤1. We take these weights as referenced weights to calculate the relative efficiency indexes of other units. Because of their inferior efficiencies to the ideal DMU, we can tell the difference between excellent DMU and bad ones easily. Charnes-Cooper transformation is used, ordered: t=1/ (v T A min ), ω T =tv T , µ T =tu T , There were: h max = (u T B max ) /(v T A min )=t(u T B max )=µ T B max But: h j =(u T B j )/(v T A j )= t(u T B j )/t(v T A j )= µ T B j /ω T A j ≤1, j=1,2,…, n After transforming, it becomes an equal model of linear programming: max µ T B max s.t. µ T B j ≤ω T A j j =1,2,…, n µ T B max ≤ω T A min (4) ω T A min =1 ω k ≥0,k=1,2,…, m;µ i ≥0,i=1,2,…, s We call h *max (h *max =µ *T B max ) as efficient index of ideal DMU and h *j (h *j =(µ *T B j )/(ω *T A j ))as relative efficient index of ideal DMU. Consequently, all DMU can be ranked based on its relative efficiency index. 3. Sustainable Superiority Degree of Technical Innovation in Enterprises Sustainability degree of technical innovation is a new concept that is mainly used to describe stability and durative of technical innovation process in an enterprise when it is considered as the main unit of technical innovation activities. It isn’t only a matter of time, but also refers to development of the technical innovation activities in enterprise and furtherance of the innovative spirit in corporate culture. Technical innovation, which plays a role of encouraging and promoting innovations in other departments, is the inexhaustible motive force for sustainable development of enterprises. The relation between techno-innovation and techno-innovation sustainability just likes the relation between qualitative change and quantitative change, techno-innovation is the unity of gradual change and abrupt change. On one hand, techno-innovation can lay a solid foundation and offer technical supports for innovations in other areas gradually and also the guidance for future development. On the other hand, when technical innovation is promoted to a certain phase, it will break through the outdated formation and captures the new technology primacy, which is the demonstration of techno-innovation sustainability. Continuous technical innovation presents a premise to techno-innovation sustainability, and in turn, techno-innovation sustainability provides assurance for techno-innovation. Superiority degree is used to describe the degree of primacy for a techno-innovation performance in a certain domain. To an enterprise, higher sustainable superiority means larger market share and more powerful competitive advantage. Technical innovation is the only access for the enterprise to be the leader in a market, and then, the innovation performance depends on its superiority. According to the description above, sustainable superiority degree of technical innovation could be defined as bellow: Sustainability degree of technical innovation describes how techno-innovation performance keeps going with the time changing, measured by the slope of linear regression model which uses enterprises’ vertical efficiency indexes as the vertical axis and years as the horizontal axis. The least  The Evaluation of Enterprises’ Sustainable Superiority Degree of Technical Innovation Based on DEA Method 257 Copyright © 2008 SciRes JSSM square estimator is applied to calculate the parameter of linear regression model, the formula appears to be: mjxxyyxxb n ijijjij n i j ijj ,…=−−−= ∑∑ == ,2,1)(/))((1 1 2 1 (5) Where, y ij stands for vertical efficiency index of the j enterprise in year x i , n means how many years. Superiority degree of technical innovation represents relative level of technical innovation performance among all observed enterprises. If I we use the sum of differences between horizontal efficiency indexes of each year and average relative efficient index as the measurement. The formula is as follows: mjHHb n i i ijj ,,2,1)(2 1 …=−= ∑ = − (6) Where, H ij stands for horizontal efficiency indexes of the j enterprise in year i. Sustainable superiority degree of technical innovation represents comprehensive performance of an enterprise considering both the time and its counterparts. We use the method of normalized weighted average of sustainability and superiority degree of technical innovation to calculate them: b=w 1 b1+w 2 b2,weight w 1 and w 2 can be evaluated based on your preference. If you pay more importance to growing character, weight w 1 should be higher; or smaller. 4. Empirical Study We select six automobile listed companies as our research objects, and apply DEA model as mentioned above to analyze the indicator of innovation input-output during 2002 to 2005 from vertical and horizontal two aspects. On the vertical aspect, we take each year as DMU and then learn how is technical innovation performance and returns to scale changing with time, which, in fact, reflects the superiority characteristic of techno-innovation; in contrast, On the horizontal aspect, we use individual enterprise as DMU and relatively rank each enterprise with their techno-innovation efficiency and returns to the scale, which, correspondently reflects the primacy of innovative enterprise among its counterparts. To the convenience of building the model, we categorize the data to two typies: data of each year for all companies (vertical section) as in table 1, and data of each company for all years( transect). Table 1. The values of techno-innovation indexes of each enterprise in four years (vertical section) DFAC JAC indexes\years 2002 2003 2004 2005 2002 2003 2004 2005 ratio of technical staffs (%) 22.8 21 20.1 20.84 10.58 11.57 8.2 9.24 ratio of expenditure in technical development in the main business income (%) 0.09 5.71 0.07 0.01 0.12 0.28 0.55 0.53 net profits of fixed assets (10million) 179.48 207.95 110.82 132.83 22.99 68.21 117.16 140.88 main business income (10million) 443.08 700.06 585.14 610.01 198.94 344.3 545.01 806.89 income taxes (10million) 9.23 10.39 5.5 8.1 1.53 2.97 8.09 12.99 return on total assets (%) 10.86 9.32 9.66 6.55 6.49 7.28 8.28 8.54 rate of net profit (%) 12.13 8.81 10.76 7.64 4.47 3.85 3.8 3.98 CHANGHE YXMC indexes\years 2002 2003 2004 2005 2002 2003 2004 2005 ratio of technical staffs (%) 10.69 12.62 12.62 13.6 7.78 6.4 6.2 7.33 ratio of expenditure in technical development in the main business income (%) 0.44 1.56 0.67 1.53 0.24 0.35 1.1 0.16 net profits of fixed assets (10million) 88.87 86.35 95.37 96.34 29.6 29.36 32.12 31.34 main business income (10million) 332.85 437.3 415.05 313.87 101.98 87.65 79.87 79.53 income taxes (10million) 1.96 2.79 1.49 1.4 0.38 0.63 0 0.02 return on total assets (%) 2.64 2.19 1.31 -1.32 4.14 1.93 -11.84 -5.68 rate of net profit (%) 2.61 1.94 1.22 -1.53 5.22 2.54 -18.47 -8.71 ANKAI JMC indexes\years 2002 2003 2004 2005 2002 2003 2004 2005 ratio of technical staffs (%) 12.16 14.14 12.2 9.46 11.98 11.53 11.54 11.97 ratio of expenditure in technical development in the main business income (%) 0.23 0.57 0.92 0.26 1.32 1.56 1.6 1.11 net profits of fixed assets (10million) 30.41 32.87 28.07 31.13 166.82 155.47 145.42 130.55 main business income (10million) 44.59 48.8 73.25 91.53 337.91 427.09 509.49 577.07 income taxes (10million) 0.11 0.07 0 0 0.48 2.33 4.84 6.79 return on total assets (%) 1.01 -4.09 1.82 0.87 2.75 8.01 11.8 9.36 rate of net profit (%) 2.3 -8.14 2.71 1.11 2.98 6.71 8.81 6.7 The origin of the data: Shanghai stock exchange; Shenzhen stock exchange; China finance online and so on 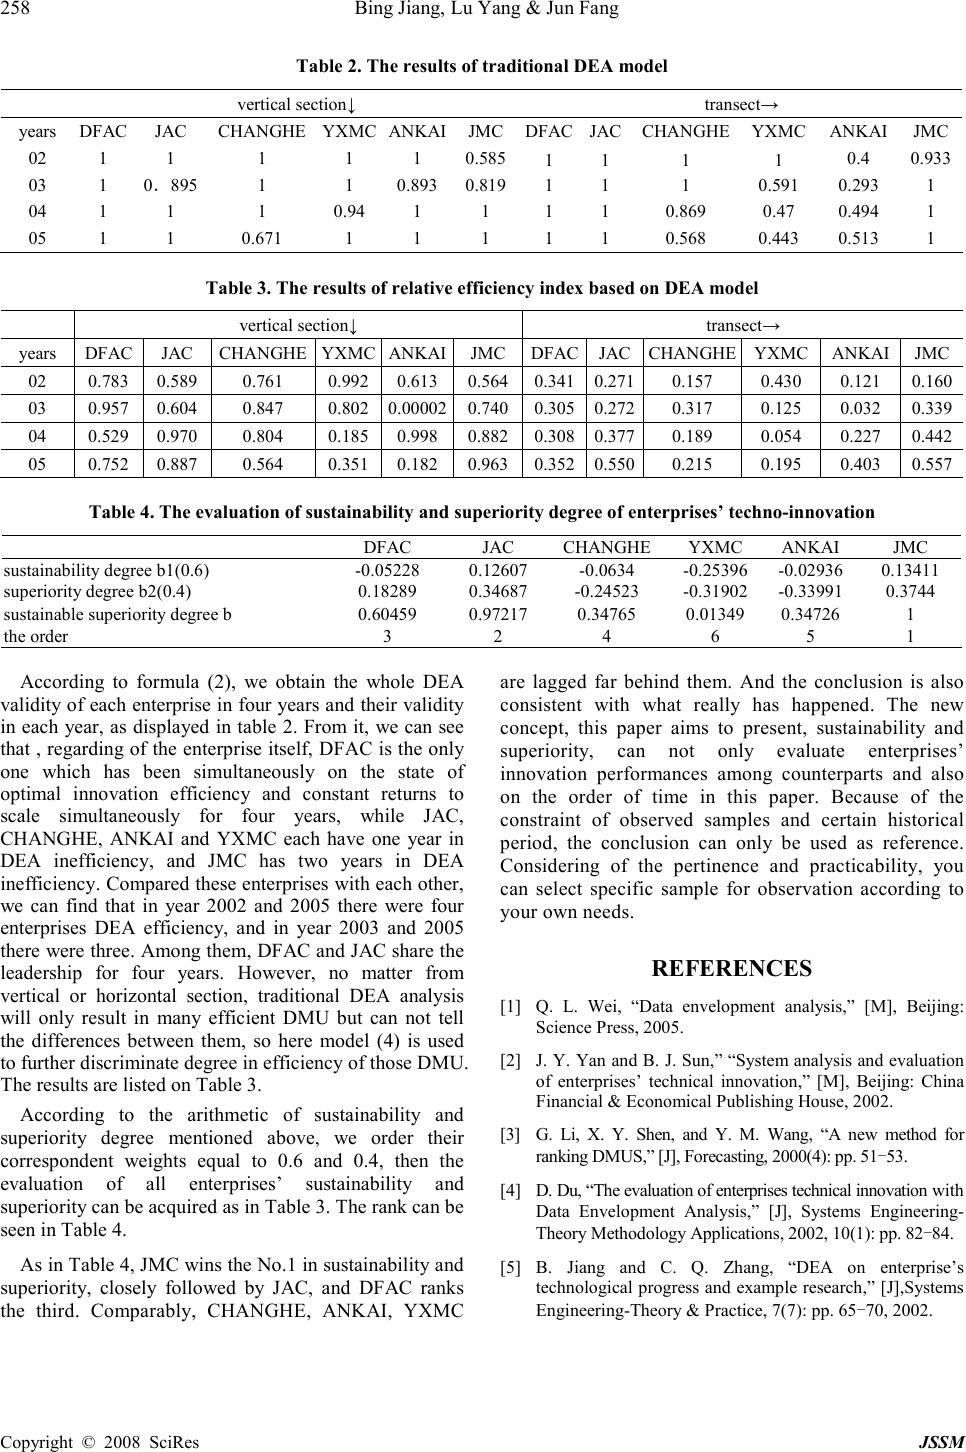 258 Bing Jiang, Lu Yang & Jun Fang Copyright © 2008 SciRes JSSM Table 2. The results of traditional DEA model vertical section↓ transect→ years DFAC JAC CHANGHE YXMC ANKAI JMC DFAC JAC CHANGHE YXMC ANKAI JMC 02 1 1 1 1 1 0.585 1 1 1 1 0.4 0.933 03 1 0.895 1 1 0.893 0.819 1 1 1 0.591 0.293 1 04 1 1 1 0.94 1 1 1 1 0.869 0.47 0.494 1 05 1 1 0.671 1 1 1 1 1 0.568 0.443 0.513 1 Table 3. The results of relative efficiency index based on DEA model vertical section↓ transect→ years DFAC JAC CHANGHE YXMC ANKAI JMC DFAC JAC CHANGHE YXMC ANKAI JMC 02 0.783 0.589 0.761 0.992 0.613 0.564 0.341 0.271 0.157 0.430 0.121 0.160 03 0.957 0.604 0.847 0.802 0.00002 0.740 0.305 0.272 0.317 0.125 0.032 0.339 04 0.529 0.970 0.804 0.185 0.998 0.882 0.308 0.377 0.189 0.054 0.227 0.442 05 0.752 0.887 0.564 0.351 0.182 0.963 0.352 0.550 0.215 0.195 0.403 0.557 Table 4. The evaluation of sustainability and superiority degree of enterprises’ techno-innovation DFAC JAC CHANGHE YXMC ANKAI JMC sustainability degree b1(0.6) -0.05228 0.12607 -0.0634 -0.25396 -0.02936 0.13411 superiority degree b2(0.4) 0.18289 0.34687 -0.24523 -0.31902 -0.33991 0.3744 sustainable superiority degree b 0.60459 0.97217 0.34765 0.01349 0.34726 1 the order 3 2 4 6 5 1 According to formula (2), we obtain the whole DEA validity of each enterprise in four years and their validity in each year, as displayed in table 2. From it, we can see that , regarding of the enterprise itself, DFAC is the only one which has been simultaneously on the state of optimal innovation efficiency and constant returns to scale simultaneously for four years, while JAC, CHANGHE, ANKAI and YXMC each have one year in DEA inefficiency, and JMC has two years in DEA inefficiency. Compared these enterprises with each other, we can find that in year 2002 and 2005 there were four enterprises DEA efficiency, and in year 2003 and 2005 there were three. Among them, DFAC and JAC share the leadership for four years. However, no matter from vertical or horizontal section, traditional DEA analysis will only result in many efficient DMU but can not tell the differences between them, so here model (4) is used to further discriminate degree in efficiency of those DMU. The results are listed on Table 3. According to the arithmetic of sustainability and superiority degree mentioned above, we order their correspondent weights equal to 0.6 and 0.4, then the evaluation of all enterprises’ sustainability and superiority can be acquired as in Table 3. The rank can be seen in Table 4. As in Table 4, JMC wins the No.1 in sustainability and superiority, closely followed by JAC, and DFAC ranks the third. Comparably, CHANGHE, ANKAI, YXMC are lagged far behind them. And the conclusion is also consistent with what really has happened. The new concept, this paper aims to present, sustainability and superiority, can not only evaluate enterprises’ innovation performances among counterparts and also on the order of time in this paper. Because of the constraint of observed samples and certain historical period, the conclusion can only be used as reference. Considering of the pertinence and practicability, you can select specific sample for observation according to your own needs. REFERENCES [1] Q. L. Wei, “Data envelopment analysis,” [M], Beijing: Science Press, 2005. [2] J. Y. Yan and B. J. Sun,” “System analysis and evaluation of enterprises’ technical innovation,” [M], Beijing: China Financial & Economical Publishing House, 2002. [3] G. Li, X. Y. Shen, and Y. M. Wang, “A new method for ranking DMUS,” [J], Forecasting, 2000(4): pp. 51-53. [4] D. Du, “The evaluation of enterprises technical innovation with Data Envelopment Analysis,” [J], Systems Engineering- Theory Methodology Applications, 2002, 10(1): pp. 82-84. [5] B. Jiang and C. Q. Zhang, “DEA on enterprise’s technological progress and example research,” [J],Systems Engineering-Theory & Practice, 7(7): pp. 65-70, 2002. |