Paper Menu >>
Journal Menu >>
 J. Biomedical Science and Engineering, 2010, 3, 380-389 JBiSE doi:10.4236/jbise.2010.34053 Published Online April 2010 (http://www.SciRP.org/journal/jbise/). Published Online April 2010 in SciRes. http://www.scirp.org/journal/jbise Pruned fuzzy K-nearest neighbor classifier for beat classification Muhammad Arif1, Muhammad Usman Akram2, Fayyaz-ul-Afsar Amir Minhas3 1Department of Computer Science and Engineering, Air University, Islamabad, Pakistan; 2Software Engineer, Elixir technologies Pakistan (Pvt) Ltd, Islamabad, Pakistan; 3Department of Computer and Information Sciences, Pakistan Institute of Engineering and Applied Sciences, Islamabad, Pakistan. Email: arif@mail.au.edu.pk; usman.akram232@gmail.com; fayyazafsar@gmail.com Received 18 January 2010; revised 30 January 2010; accepted 7 February 2010. ABSTRACT Arrhythmia beat classification is an active area of research in ECG based clinical decision support sys- tems. In this paper, Pruned Fuzzy K-nearest neighbor (PFKNN) classifier is proposed to classify six types of beats present in the MIT-BIH Arrhythmia database. We have tested our classifier on ~ 103100 beats for six beat types present in the database. Fuzzy KNN (FKNN) can be implemented very easily but large number of training examples used for classification can be very time consuming and requires large stor- age space. Hence, we have proposed a time efficient Arif-Fayyaz pruning algorithm especially suitable for FKNN which can maintain good classification accuracy with appropriate retained ratio of train- ing data. By using Arif-Fayyaz pruning algorithm with Fuzzy KNN, we have achieved a beat classifi- cation accuracy of 97% and geometric mean of sensi- tivity of 94.5% with only 19% of the total training examples. The accuracy and sensitivity is comparable to FKNN when all the training data is used. Principal Component Analysis is used to further reduce the dimension of feature space from eleven to six without compromising the accuracy and sensitivity. PFKNN was found to robust against noise present in the ECG data. Keywords: Arrhythmia; ECG; K-Nearest Neighbor; Pruning; Fuzzy; Classification 1. INTRODUCTION Arrhythmias result due to improper pacing of the car- diac muscle or any discrepancy in the electrical con- duction network of the heart [1]. Detection of these pathologically significant arrhythmias is an impera- tive task in the diagnosis of cardiac diseases. Electro- cardiograph (ECG) can be used as a non-invasive di- agnostic tool for the detection of these disorders. With the development in computing and sensor technology, standalone automated ECG based decision support sys- tems are an active area of research. A clinical decision support system includes ECG acquisition, pre-proc- essing and noise removal (baseline variation, electronic and electromyographic noise etc.), ECG Delineation (for detection and delineation of P, QRS and T waves of ECG), feature extraction and beat classification. A variety of methods exist in the literature for QRS delineation [2] which rely upon derivative based meth- ods, use of digital filters and filter-banks etc. One of the most promising approaches for QRS detection and delineation has been proposed by Martínez et al. [3] as it offers very high detection and delineation accu- racy. It uses wavelet domain analysis for performing QRS detection and delineation which is particularly suited to the ECG signal due to the non-stationary nature of the signal. ECG beat classification, being an integral part of any ECG based automatic decision support system, has been studied by a number of researchers. Different feature extraction methods for beat classification in- clude use of Fourier Transform [4], multi-resolution analysis [5], wavelet transform [6-9], independent component analysis [10], morphological analysis [11] etc. For the purpose of beat classification, literature re- ports a variety of classifiers such as Backpropagation Neural Networks [8], Learning Vector Quantization and Probabilistic Neural Networks [6], Fuzzy Inference Sys- tems [12], Nearest Neighbor classifiers [13] etc. In our previous work [9], we have used features ex- tracted from two-level wavelet decomposition of an ECG signal. The wavelet decomposition was performed through algorithm a’trous using the wavelet proposed by Martínez et al. [3] for QRS delineation. This wavelet offers inherent noise suppression and eliminates the need of re-evaluation of wavelet coefficients for beat classifi- 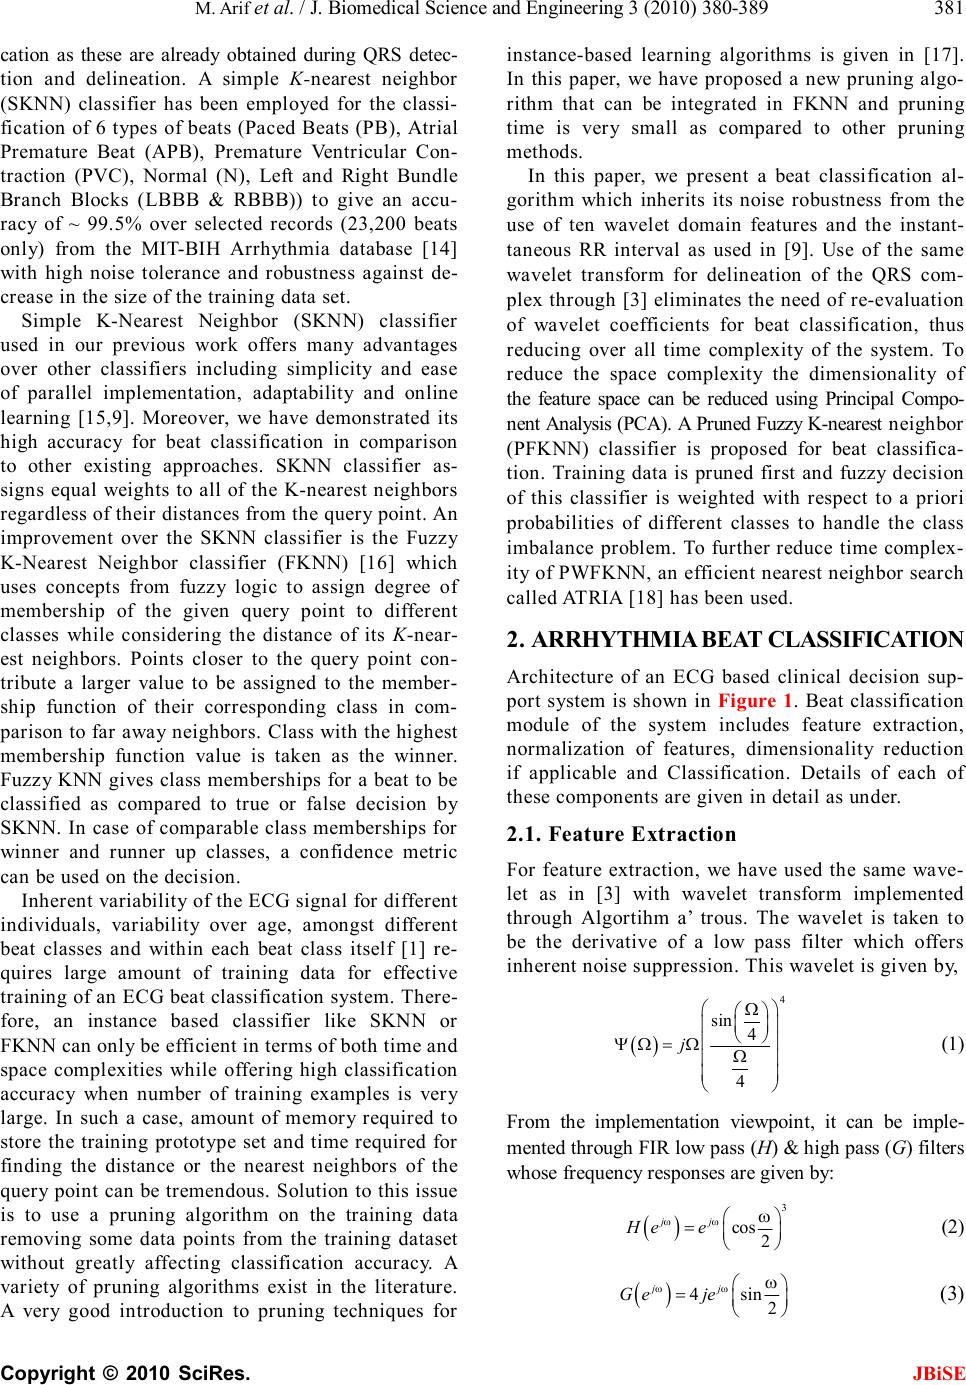 M. Arif et al. / J. Biomedical Science and Engineering 3 (2010) 380-389 Copyright © 2010 SciRes. JBiSE 381 cation as these are already obtained during QRS detec- tion and delineation. A simple K-nearest neighbor (SKNN) classifier has been employed for the classi- fication of 6 types of beats (Paced Beats (PB), Atrial Premature Beat (APB), Premature Ventricular Con- traction (PVC), Normal (N), Left and Right Bundle Branch Blocks (LBBB & RBBB)) to give an accu- racy of ~ 99.5% over selected records (23,200 beats only) from the MIT-BIH Arrhythmia database [14] with high noise tolerance and robustness against de- crease in the size of the training data set. Simple K-Nearest Neighbor (SKNN) classifier used in our previous work offers many advantages over other classifiers including simplicity and ease of parallel implementation, adaptability and online learning [15,9]. Moreover, we have demonstrated its high accuracy for beat classification in comparison to other existing approaches. SKNN classifier as- signs equal weights to all of the K-nearest neighbors regardless of their distances from the query point. An improvement over the SKNN classifier is the Fuzzy K-Nearest Neighbor classifier (FKNN) [16] which uses concepts from fuzzy logic to assign degree of membership of the given query point to different classes while considering the distance of its K-near- est neighbors. Points closer to the query point con- tribute a larger value to be assigned to the member- ship function of their corresponding class in com- parison to far away neighbors. Class with the highest membership function value is taken as the winner. Fuzzy KNN gives class memberships for a beat to be classified as compared to true or false decision by SKNN. In case of comparable class memberships for winner and runner up classes, a confidence metric can be used on the decision. Inherent variability of the ECG signal for different individuals, variability over age, amongst different beat classes and within each beat class itself [1] re- quires large amount of training data for effective training of an ECG beat classification system. There- fore, an instance based classifier like SKNN or FKNN can only be efficient in terms of both time and space complexities while offering high classification accuracy when number of training examples is very large. In such a case, amount of memory required to store the training prototype set and time required for finding the distance or the nearest neighbors of the query point can be tremendous. Solution to this issue is to use a pruning algorithm on the training data removing some data points from the training dataset without greatly affecting classification accuracy. A variety of pruning algorithms exist in the literature. A very good introduction to pruning techniques for instance-based learning algorithms is given in [17]. In this paper, we have proposed a new pruning algo- rithm that can be integrated in FKNN and pruning time is very small as compared to other pruning methods. In this paper, we present a beat classification al- gorithm which inherits its noise robustness from the use of ten wavelet domain features and the instant- taneous RR interval as used in [9]. Use of the same wavelet transform for delineation of the QRS com- plex through [3] eliminates the need of re-evaluation of wavelet coefficients for beat classification, thus reducing over all time complexity of the system. To reduce the space complexity the dimensionality of the feature space can be reduced using Principal Compo- nent Analysis (PCA). A Pruned Fuzzy K-nearest neighbor (PFKNN) classifier is proposed for beat classifica- tion. Training data is pruned first and fuzzy decision of this classifier is weighted with respect to a priori probabilities of different classes to handle the class imbalance problem. To further reduce time complex- ity of PWFKNN, an efficient nearest neighbor search called ATRIA [18] has been used. 2. ARRHYTHMIA BEAT CLASSIFICATION Architecture of an ECG based clinical decision sup- port system is shown in Figure 1. Beat classification module of the system includes feature extraction, normalization of features, dimensionality reduction if applicable and Classification. Details of each of these components are given in detail as under. 2.1. Feature Extraction For feature extraction, we have used the same wave- let as in [3] with wavelet transform implemented through Algortihm a’ trous. The wavelet is taken to be the derivative of a low pass filter which offers inherent noise suppression. This wavelet is given by, ( ) 4 sin 4 4 Ω ΨΩ=Ω Ω j (1) From the implementation viewpoint, it can be imple- mented through FIR low pass (H) & high pass (G) filters whose frequency responses are given by: ( ) 3 cos 2 ωω ω = jj Hee (2) ( ) 4sin 2 ωω ω = jj Geje (3) 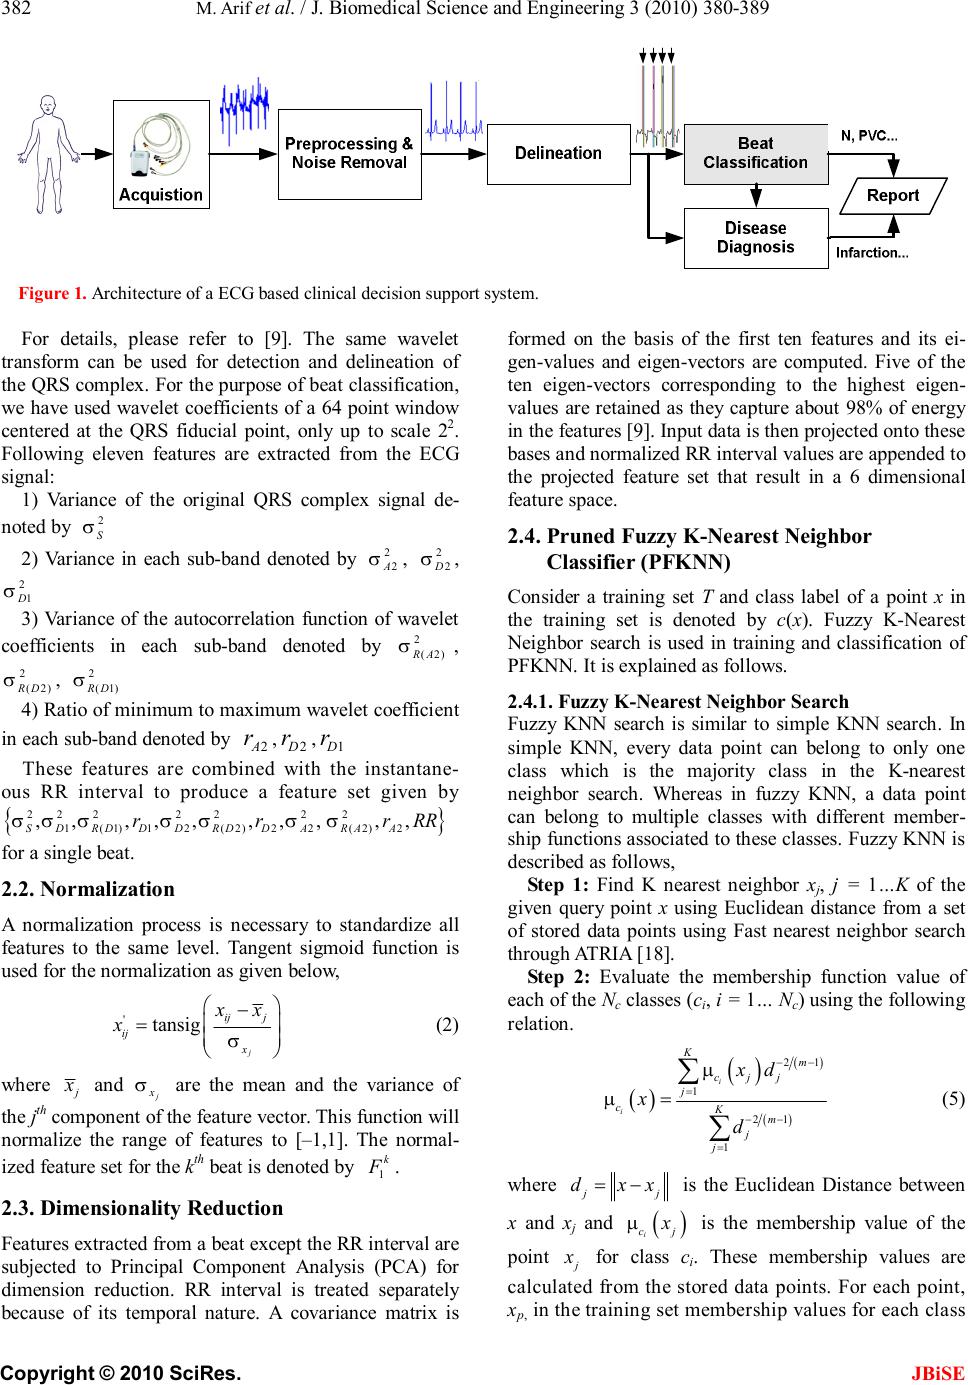 M. Arif et al. / J. Biomedical Science and Engineering 3 (2010) 380-389 Copyright © 2010 SciRes. JBiSE 382 Figure 1. Architecture of a ECG based clinical decision support system. For details, please refer to [9]. The same wavelet transform can be used for detection and delineation of the QRS complex. For the purpose of beat classification, we have used wavelet coefficients of a 64 point window centered at the QRS fiducial point, only up to scale 22 . Following eleven features are extracted from the ECG signal: 1) Variance of the original QRS complex signal de- noted by 2 σ S 2) Variance in each sub-band denoted by 2 2 σ A , 2 2 σ D , 2 1 σ D 3) Variance of the autocorrelation function of wavelet coefficients in each sub-band denoted by 2 (2) σ RA , 2 (2) σRD , 2 (1) σ RD 4) Ratio of minimum to maximum wavelet coefficient in each sub-band denoted by 2 A r , 2 D r , 1 D r These features are combined with the instantane- ous RR interval to produce a feature set given by { } 2222222 1(1)12(2)22(2)2 ,,,,,,,, ,,σσσσσσσ SDRDDDRDDARAA rrrRR for a single beat. 2.2. Normalization A normalization process is necessary to standardize all features to the same level. Tangent sigmoid function is used for the normalization as given below, 'tansig σ − = j ijj ij x xx x (2) where j x and σ j x are the mean and the variance of the jth component of the feature vector. This function will normalize the range of features to [–1,1]. The normal- ized feature set for the kth beat is denoted by 1 k F . 2.3. Dimensionality Reduction Features extracted from a beat except the RR interval are subjected to Principal Component Analysis (PCA) for dimension reduction. RR interval is treated separately because of its temporal nature. A covariance matrix is formed on the basis of the first ten features and its ei- gen-values and eigen-vectors are computed. Five of the ten eigen-vectors corresponding to the highest eigen- values are retained as they capture about 98% of energy in the features [9]. Input data is then projected onto these bases and normalized RR interval values are appended to the projected feature set that result in a 6 dimensional feature space. 2.4. Pruned Fuzzy K-Nearest Neighbor Classifier (PFKNN) Consider a training set T and class label of a point x in the training set is denoted by c(x). Fuzzy K-Nearest Neighbor search is used in training and classification of PFKNN. It is explained as follows. 2.4.1. Fuzzy K-Nearest Neighbor Search Fuzzy KNN search is similar to simple KNN search. In simple KNN, every data point can belong to only one class which is the majority class in the K-nearest neighbor search. Whereas in fuzzy KNN, a data point can belong to multiple classes with different member- ship functions associated to these classes. Fuzzy KNN is described as follows, Step 1: Find K nearest neighbor xj, j = 1…K of the given query point x using Euclidean distance from a set of stored data points using Fast nearest neighbor search through ATRIA [18]. Step 2: Evaluate the membership function value of each of the Nc classes (ci, i = 1… Nc) using the following relation. () ( ) ( ) ( ) 21 1 21 1 µ µ −− = −− = = ∑ ∑ i i Km cjj j cKm j j xd x d (5) where =− jj dxx is the Euclidean Distance between x and xj and ( ) µi cj x is the membership value of the point j x for class ci. These membership values are calculated from the stored data points. For each point, xp, in the training set membership values for each class  M. Arif et al. / J. Biomedical Science and Engineering 3 (2010) 380-389 Copyright © 2010 SciRes. JBiSE 383 are as follows, ( )( ) 0.510.49 0.49 µ += = i i pi cp i k ifcxc K xkelse K (6) where ki is the number of points from the original train- ing set among the K nearest neighbors of xp that belong to the same class as xp itself. The parameter m is used to control the effective mag- nitude of distance of the prototype neighbors from the query point and it can be selected through cross valida- tion along with K. If m is taken to be infinity then the classifier reduces to a SKNN classifier. Step 3: The class label of the query point x, c (x), is chosen as follows: () () ( ) argmax i oc i cxx µ= (7) 2.4.2. Proposed Pruning Method It involves pruning of the training data set T to obtain the prototype set P. Following steps explain our proposed Arif-Fayyaz Pruning Algorithm. Step 1: Start with an empty prototype set, φ = P and training set T. Step 2: Find K-Nearest Neighbors, xj, j = 1…K, of each training point, x, such that ( ) ( ) ≠ j cxcx and add them to the prototype set P. This gives us the border points of different clusters in the data. Step 3: Classify each training point using the prototype set P through FKNN explained in Subsection 3.1. If the training point is misclassified, add it to the prototype set P and re-evaluate class weights and membership values of prototype set P. This is done in order to accommodate any clusters which may have been missed in Step 2. Step 4: For each ith class in the training set, Initialize a set W (i), i = 1, 2,…, N c Pruned, where NcPruned is the number of prototypes in P for ith class. For each train- ing point in the class, find the winner from the pruned set of same class. After all the training points are fin- ished, remove the entire prototype from set P whose W (i) is an empty set. The prototype set P obtained after Step 4 will be a pruned set of prototypes obtained from the training set T. In the next step, class weights are calculated to deal with the data imbalance problem. Incremental Policy in the Pruned Set using Arif-Fayyaz Pruning Method Once pruned prototype is set for a certain training data points, it is very easy and efficient to include any new data points available in the later time without effecting already pruned prototype set. New training data point can become member of pruned prototype set if it is mis- classified with the existing pruned prototype set. 2.4.3. Classification Using PFKNN Classification involves calculation of the membership function values of an unknown query point using FKNN from the stored prototype training data set P obtained after pruning and assigning its class label. 3. DESCRIPTION OF DATABASE The MIT-BIH Arrhythmia Database is used in this paper for beat classification using PFKNN. It contains two- channel ambulatory ECG recordings from 47 subjects studied by the BIH Arrhythmia Laboratory between 1975 and 1979. ECG recordings were digitized at the sampling rate of 360 Hz with 11-bit resolution. We have used the annotations of the cardiologist originally pro- vided by the database. We have used six types of beats (Paced Beats (PB), Atrial Premature Beat (APB), Pre- mature Ventricular Contraction (PVC), Normal (N), Left and Right Bundle Branch Blocks (LBBB & RBBB)) from the MIT-BIH Arrhythmia database. Number of beats is plotted in Figure 2 for all six beat types. It can be seen in the figure that Normal beats dominate the database and rest of the beats are also not equally repre- sented. 4. Results & Discussion In this section, results of classification of the six types of cardiac rhythms are presented. 4.1. Performance Metrics Following performance metrics are used to evaluate the performance of classifier, 1) Mean & Standard Deviation of Positive Predictive Values (PPV) of each class over five runs with ran dom selection of training and testing data. With TPc and FPc representing the number of true and false 3616 2495 8067 74716 7247 7058 0 10000 20000 30000 40000 50000 60000 70000 80000 PB APB LBBBNRBBB PVC Beat Type Number of Beats Figure 2. Distribution of beats in the database.  M. Arif et al. / J. Biomedical Science and Engineering 3 (2010) 380-389 Copyright © 2010 SciRes. JBiSE 384 positives for a given class c, its PPV is defined by, =+ c c cc TP PPV TPFP (9) 2) Mean & Standard Deviation of Sensitivity Values (Se) of each class over five runs with random selection of training and testing data. If FN c is the number of false negatives for a class c its Sensitivity is defined by, =+ c c cc TP Se TPFN (10) 3) Mean & Standard Deviation of Total Accuracy (A) of each class over five runs with random selection of training and testing data. Total Accuracy is define by, 1 =− error test N AN (11) where Nerror is the number of misclassifications and Ntest is the total number of testing beats for all classes. 4) Mean & Standard Deviation of the Geometric Mean of Sensitivity values (G) over five runs with ran- dom selection of training and testing data. G is given by, 1 6 6 1= = ∏k c k GSe (12) This measure is used to assess the performance of dif- ferent classifiers while dealing with the class imbalance problem. Performance measure for analyzing the performance of pruning algorithms is defined as retained ratio, R, given as below, No. of points in the prototype set (afte r pruning) No. of points in the training set (befor e pruning) =R (13) We have also tested noise robustness of the classification by adding uniform Gaussian noise of different intensity levels to the ECG signals and analyzed the results. The level of noise in the signal is quantized through the Sig- nal to Noise ratio given by, 2 2 10log σ σ = s dB e SNR (14) where 2 σ s and 2 σ e are the power of the signal and noise respectively. 4.2. Comparison of Different Pruning Algorithms In ECG based beat classification problem, number of training beats can grow very large and an efficient prun- ing method is required. Pruning of data for different classes is a difficult task when the separation boundary is nonlinear and complex and representation of classes is sparsely clustered. Checkerboard data is an example of multi-modal two class problem as shown in Figure 3(a) and Spiral data corresponds to two class separable pro- blem having complex separation boundary as shown in Figure 3(b). In this section, our proposed Arif-Fayyaz pruning algorithm is compared with the other pruning algorithms. We have used the implementation of Wilson et al. [17] of different pruning algorithms. For the com- parison 10 fold cross validation results are presented with K = 1 and m = ∞ (FWKNN being used as SKNN) over two different data sets. In Table 1, different pruning methods are compared with our proposed Arif-Fayyaz pruning method. The accuracy of the proposed pruning approach is compara- ble to other approaches over these data sets. We have compared different algorithms in terms of Pruning Time, Accuracy after pruning and Retained fraction R. All al- gorithms were run on PIV 2.26 GHz PC with 512 Mb RAM. In the first row of Table 1, result of simple KNN is presented without any pruning. The maximum accuracy achieved in two data sets is 98.33% and 99.97% for checkerboard and spiral data respectively by retaining all the training examples. Our proposed Arif-Fayyaz prun- ing method has achieved the accuracy of 97.54% and 99.83% respectively while retaining only 19.86% and 7.72% training examples. Other pruning methods are 0123456 0 1 2 3 4 5 6 (a) -3-2-1 01 2 3 -3 -2 -1 0 1 2 3 (b) Figure 3. (a) Top: Checkerboard data; (b) Bottom: Spiral data.  M. Arif et al. / J. Biomedical Science and Engineering 3 (2010) 380-389 Copyright © 2010 SciRes. JBiSE 385 Table 1. Comparison of different pruning algorithm for checkerboard and spiral data. Spiral (Ntotal = 2760, dimension = 2) Checkerboard (Ntotal = 3600, dimension = 2) Time (seconds) Accuracy (%) R × 100 (%) Time (seconds) Accuracy (%) R × 100 (%) KNN 0.95 98.33 100.00 1.61 99.97 100.00 Proposed Method 0.32 97.54 19.86 0.32 99.83 7.72 CNN [19] 0.95 95.38 8.83 1.55 98.33 3.70 SNN [20] 13.35 96.80 10.61 10.47 99.44 3.57 IB2 [21] 0.94 95.38 8.83 1.53 98.33 3.70 IB3 [21] 1.18 94.91 10.70 1.70 98.66 4.37 DEL [22] 3.13 91.71 6.64 14.16 97.49 2.24 DROP1 [22] 2.69 89.82 7.34 4.78 93.84 2.83 DROP2 [22] 2.62 96.07 15.62 12.31 99.13 5.90 DROP3 [22] 2.66 96.65 15.49 12.31 99.22 5.91 DROP4 [22] 2.65 96.47 15.54 12.32 99.22 5.91 DROP5 [22] 3.58 96.73 6.78 14.90 99.39 1.63 ENN [23] 1.02 98.00 98.59 1.62 99.94 99.95 RENN [23] 1.02 97.96 98.58 1.62 99.94 99.95 All KNN [24] 0.94 98.00 98.26 1.61 99.94 99.95 EL Grow [25] 2.20 64.04 0.45 3.69 85.54 0.32 Explore [25] 3.00 67.46 0.60 4.73 87.22 0.33 ELH [17] 2.64 91.42 5.86 4.72 96.07 2.01 better than our proposed method in retained ratio but our method outperform other methods in term of pruning time which is very important in case of large training set. Moreover, classification accuracy of Arif-Fayyaz prun- ing method is almost similar to simple KNN without pruning. If we look at the table, only ENN is better than Arif-Fayyaz pruning method in terms of accuracy but the retained ratio of ENN is very high (more than 98% in both cases). Explore method offers least retained ratio but its classification accuracy is very poor. Incremental policy of Arif-Fayyaz pruning algorithm is very simple and straightforward. These results clearly indicate the advantage in terms of computational complexity of using Arif-Fayyaz pruning method. Our proposed approach offers a suitable and manage- able reduction factor and faster pruning. Our proposed Arif-Fayyaz pruning method is used in the rest of paper for pruning. 4.3. Classification Results of PFKNN Firstly, we present the result of fuzzy KNN with pa- rameter values of k = 5 and m = 1.5. No pruning or class weights are used. We have divided total number of beats into two sets; training set include 50% of total number of beats (51600 beats) and 50% testing beats (51599 beats). Beats are selected randomly for training and testing sets. Classification results for FKNN based classification are given in Table 2 with 11 features as explained in Subsection 2.1. Effect of noise on classification accuracy in terms of SNR as explained in Subsection 3.1 is also illustrated in Table 2. Overall accuracy is dropped by only 1% for SNR equals to 20 dB. This shows good ro- bustness of FKNN against Gaussian noise. In PFKNN, our proposed Arif-Fayyaz pruning method is used to prune the training data set of 51600 beats and pruned feature set is used to classify the testing set of 51599 beats of six classes. Results of classification with and without noise are illustrated in Table 3. Overall ac- curacy and geometric mean of sensitivity G are given in the 9th column as A (G) and retained ration R is given in the last column of the table. It can be observed from Table 3 that with only 19% retained ratio of the training feature set, overall accuracy is dropped by only 0.3% and geometric mean of sensitivity G is dropped by only 0.2%. Hence our proposed PFKNN method offers ad- vantage in terms of space and computational complexity. Principal Component Analysis (PCA) is used to reduce the number of features. Considering the eigen-values of the resultant principal components, six principal components are selected and 11-dimensional feature space is pro- jected on six-dimensional space. Table 4 shows overall accuracy, geometric mean of sensitivity and retained ratio considering no noise and different level of noise. It can be observed from the Table 4 that with the same overall accuracy and geometric mean of sensitivity it can further reduce the computational complexity of the classifier.  M. Arif et al. / J. Biomedical Science and Engineering 3 (2010) 380-389 Copyright © 2010 SciRes. JBiSE 386 Table 2. Beat classification using fuzzy KNN. Effect of noise Without PCA Feature Reduction (Ntrain = 51600, Ntest = 51599) with FKNN, k = 5, m = 1.5 SNR (dB) PB APB LBBB Normal RBBB PVC Overall Accuracy (G) PPV 99.93 ± 0.05 83.11 ± 1.11 94.65 ± 0.35 98.55 ± 0.05 98.30 ± 0.14 94.58 ± 0.26 No Noise SEN 99.95 ± 0.00 83.47 ± 1.15 94.53 ± 0.47 98.54 ± 0.05 98.59 ± 0.19 94.36 ± 0.28 97.63 ± 0.02 (94.74) PPV 99.91 ± 0.06 83.51 ± 0.68 94.45 ± 0.42 98.48 ± 0.06 98.20 ± 0.04 94.96 ± 0.44 40 SEN 99.91 ± 0.10 82.83 ± 1.30 94.48 ± 0.21 98.54 ± 0.04 98.63 ± 0.16 94.09 ± 0.49 97.59 ± 0.04 (94.56) PPV 99.89 ± 0.07 82.38 ± 1.18 94.60 ± 0.31 98.47 ± 0.05 98.11 ± 0.13 94.38 ± 0.43 35 SEN 99.97 ± 0.05 82.42 ± 0.55 94.14 ± 0.20 98.48 ± 0.08 98.59 ± 0.20 94.26 ± 0.31 97.52 ± 0.06 (94.45) PPV 99.82 ± 0.09 81.56 ± 1.43 93.65 ± 0.40 98.37 ± 0.08 97.99 ± 0.23 93.99 ± 0.21 30 SEN 99.95 ± 0.05 82.36 ± 0.74 93.57 ± 0.24 98.34 ± 0.09 98.47 ± 0.16 93.54 ± 0.36 97.31 ± 0.04 (94.18) PPV 99.91 ± 0.06 81.38 ± 0.89 93.00 ± 0.70 98.21 ± 0.08 97.74 ± 0.22 93.65 ± 0.71 25 SEN 99.90 ± 0.05 80.79 ± 1.27 93.06 ± 0.27 98.23 ± 0.03 98.44 ± 0.18 92.90 ± 0.27 97.11 ± 0.07 (93.65) PPV 99.85 ± 0.05 78.53 ± 1.23 91.55 ± 0.16 97.74 ± 0.04 96.92 ± 0.33 92.49 ± 0.37 20 SEN 99.81 ± 0.15 77.78 ± 0.64 90.12 ± 0.46 97.88 ± 0.08 97.77 ± 0.29 92.19 ± 0.21 96.45 ± 0.10 (92.27) Table 3. Beat classification using pruned fuzzy KNN. Effect of Noise Without PCA Feature Reduction (Ntrain = 51600, Ntest = 51599) with PFKNN, k = 5, m = 1.5 SNR (dB) PB APB LBBB Normal RBBB PVC A (G) R PPV 99.93 ± 0.05 78.61 ± 0.68 93.66 ± 0.23 98.51 ± 0.06 97.51 ± 0.33 94.46 ± 0.52 No Noise SEN 99.86 ± 0.07 83.49 ± 0.98 94.60 ± 0.32 98.17 ± 0.03 98.65 ± 0.14 93.72 ± 0.50 97.32 ± 0.05 (94.58) 0.19 PPV 99.88 ± 0.06 78.77 ± 0.94 93.65 ± 0.52 98.54 ± 0.04 97.55 ± 0.25 94.07 ± 0.52 40 SEN 99.89 ± 0.10 83.50 ± 0.35 94.62 ± 0.27 98.12 ± 0.08 98.70 ± 0.18 94.03 ± 0.31 97.32 ± 0.06 (94.64) 0.19 PPV 99.91 ± 0.03 77.90 ± 1.48 93.21 ± 0.29 98.48 ± 0.04 97.51 ± 0.13 93.63 ± 0.26 35 SEN 99.94 ± 0.04 83.42 ± 0.74 94.30 ± 0.17 98.02 ± 0.08 98.49 ± 0.23 93.67 ± 0.49 97.17 ± 0.08 (94.47) 0.19 PPV 99.93 ± 0.06 78.12 ± 1.63 93.18 ± 0.56 98.39 ± 0.043 97.42 ± 0.14 93.63 ± 0.46 30 SEN 99.82 ± 0.08 83.35 ± 0.94 93.89 ± 0.48 98.04 ± 0.06 98.53 ± 0.07 93.07 ± 0.45 97.12 ± 0.04 (94.28) 0.19 PPV 99.88 ± 0.06 77.31 ± 0.95 91.83 ± 0.31 98.20 ± 0.03 97.06 ± 0.29 92.75 ± 0.38 25 SEN 99.88 ± 0.09 82.57 ± 0.55 92.44 ± 0.21 97.77 ± 0.04 98.31 ± 0.17 92.86 ± 0.21 96.76 ± 0.04 (93.79) 0.20 PPV 99.82 ± 0.09 74.05 ± 0.75 89.83 ± 0.23 97.79 ± 0.12 96.34 ± 0.37 91.87 ± 0.26 20 SEN 99.83 ± 0.08 78.29 ± 1.24 90.77 ± 0.55 97.40 ± 0.06 97.76 ± 0.34 91.40 ± 0.73 96.12 ± 0.09 (92.28) 0.23 Table 4. Beat classification using pruned fuzzy KNN with reduced feature space using PCA. Effect of Noise With PCA Feature Reduction (Ntrain = 51600, Ntest = 51599) with PCA & PFKNN SNR (dB) PB APB LBBB Normal RBBB PVC A (G) R PPV 99.92 ± 0.05 78.88 ± 0.85 93.56 ± 0.3 98.54 ± 0.08 97.62 ± 0.21 93.92 ± 0.32 No Noise SEN 99.91 ± 0.08 84.46 ± 1.14 94.24 ± 0.4 98.13 ± 0.09 98.78 ± 0.14 93.78 ± 0.2 97.31 ± 0.10 (94.74) 0.19 PPV 99.96 ± 0.03 78.88 ± 1.98 93.39 ± 0.22 98.52 ± 0.07 97.57 ± 0.27 93.55 ± 0.56 40 SEN 99.85 ± 0.14 83.28 ± 1.25 94.70 ± 0.22 98.14 ± 0.09 98.69 ± 0.18 93.55 ± 0.56 97.29 ± 0.03 (94.53) 0.19 PPV 99.92 ± 0.05 78.75 ± 1.39 93.33 ± 0.23 98.52 ± 0.05 97.39 ± 0.09 93.70 ± 0.36 35 SEN 99.87 ± 0.06 83.98 ± 0.62 94.08 ± 0.25 98.06 ± 0.05 98.61 ± 0.19 94.05 ± 0.42 97.23 ± 0.05 (94.62) 0.19 PPV 99.91 ± 0.05 78.14 ± 1.52 92.92 ± 0.52 98.41 ± 0.07 97.49 ± 0.32 93.62 ± 0.43 30 SEN 99.91 ± 0.12 82.80 ± 1.01 93.94 ± 0.46 98.02 ± 0.08 98.51 ± 0.33 93.39 ± 0.55 97.12 ± 0.20 (94.25) 0.20 PPV 99.86 ± 0.06 77.02 ± 0.80 91.76 ± 0.21 98.26 ± 0.05 97.01 ± 0.32 93.11 ± 0.13 25 SEN 99.89 ± 0.07 81.49 ± 1.14 93.04 ± 0.28 97.80 ± 0.05 98.39 ± 0.21 92.90 ± 0.37 96.82 ± 0.06 (93.71) 0.21 PPV 99.89 ± 0.10 72.67 ± 0.63 89.89 ± 0.48 97.78 ± 0.09 96.11 ± 0.22 91.80 ± 0.65 20 SEN 99.73 ± 0.12 78.65 ± 0.86 90.36 ± 0.18 97.31 ± 0.08 97.83 ± 0.26 91.53 ± 0.75 96.04 ± 0.08 (92.28) 0.23  M. Arif et al. / J. Biomedical Science and Engineering 3 (2010) 380-389 Copyright © 2010 SciRes. JBiSE 387 4.4. Analysis of Results Main advantage of using fuzzy KNN over simple KNN is the membership value of each class for a particular query beat. Hence it gives a much more informed deci- sion by inclusion of a higher level decision process. To accomplish this, we can first normalize the firing strengths of each class and then use the following classi- fication rule: If the normalized firing strength of the runner-up class lies within a certain threshold of that of the winner class then we can assume the winning class label to be doubtful and take the runner-up class label in to consideration as well. Mathematically the winner class label is considered to be doubtful if, ( ) ( ) () i winnerrunnerup c i xx x µµ θ µ − − ≤ ∑ (15) where θ is the threshold value and it is user specific. If we take winner and runner-up classes into consideration when inequality Eq.15 is satisfied, we can consider the beat classification as correct if winner or runner-up be- longs to correct class. Following this strategy, overall accuracy versus threshold value is plotted in Figure 4. We can observe from the figure that accuracy increases with the relaxation of threshold value. Table 5 illustrates the time and space complexity of standard FKNN algorithm and our proposed PFKNN algorithm with fast nearest neighbor search using ATRIA. It can be seen from the table that PFKNN is very time efficient with small retained ratio. Overall accuracy and geometric mean of sensitivity of standard FKNN and PFKNN are also comparable. Hence, it highlights the effectiveness of using PFKNN. 00.1 0.2 0.3 0.4 0.5 0.6 0.7 0.8 0.9 1 0.972 0.974 0.976 0.978 0.98 0.982 0.984 0.986 0.988 0.99 0.992 θ A Best-of-Two Classiifcation Results Figure 4. Plot of overall accuracy a versus threshold value. Table 5. Time and space complexity for standard FKNN and PFKNN. Type of Algorithm Classification Time (Seconds) Retained Ratio R Overall Accuracy Geometric Mean Sensitivity Standard FKNN 1116 1.0 97.63 94.74 PFKNN (With 11 Features) 353 0.19 97.32 94.58 PFKNN (With 6 Features) 303 0.19 97.31 94.74 Table 6. Comparison of beat classification techniques. Method Number of Beat Types Number of Features Database Size Accuracy (%) Osowski et al [26] 7 18 7,185 Beats 96.06 Guler et al [27] 5 24 450 Beats 97.78 Guler et al [28] 4 19 450 Beats 96.94 Minami et al [4] 3 5 700 Beats 98 Al-Fahoum et al [6] 4 6 1590 Beats 97.5 Dokur et al [29] 5 15 1,000 Beats 97 Prasad et al [5] 12 25 105,423 Beats 96.77 Chen et al [8] 7 30 23,200 Beats 99.7 Yu et al [30] 6 11 23,200 Beats 99.65 Yu et al [31] 8 17 9,800 Beats 98.7 PFKNN (Proposed) without PCA 6 11 23,200 Beats 99.30 PFKNN (Proposed) with PCA 6 6 23,200 Beats 99.25 PFKNN (Proposed) without PCA 6 11 104,700 Beats 97.35 ± 0.04 PFKNN (Proposed) with PCA 6 6 104,700 Beats 97.30 ± 0.04  M. Arif et al. / J. Biomedical Science and Engineering 3 (2010) 380-389 Copyright © 2010 SciRes. JBiSE 388 Many researchers have compared their methods with the other existing methods present in the literature. Table 6 shows the comparison of the proposed approach with other methods in the literature. In our view, a fair com- parison of methods is not possible as most of the re- searchers have focused on different set of beat types and tested their methods on selected number of records pre- sent in the MIT-BIH database. From the table, we can observe that accuracy of our method is comparable to other methods although we have tested our method on whole set of six beat types present in the MIT-BIH data- base. Moreover, our feature set is very small (only six) and exhibits good time and space complexity. While using a limited set of 23200 beats, our accuracy is dropped by only 0.5% as compared to [30]. 5. CONCLUSIONS Pruned fuzzy KNN (PFKNN) classifier is proposed for arrhythmia beat classification that can offer reduced computational complexity and simple incremental policy. A new pruning algorithm is proposed especially suited for KNN based classifiers that can prune the data effi- ciently in less computational time without compromising the accuracy of the classifier. PCA is used to further re- duce the feature set to only six features per beat. Results have proved that PFKNN can offer better computational complexity than FKNN without compromising the clas- sification accuracy. Hence PFKNN is a suitable option for online implementation of such clinical decision sup- port system for Arrhythmia beat classification that de- mands less space and time complexity. Because of sim- plicity of the proposed classifier it is very easy to incre- ment further training data of similar beat types or new beat types. REFERENCES [1] Garcia, T.B. and Miller, G.T. (2004) Arrhythmia recogni- tion: The art of interpretation. Jones and Barlett Publish- ers, the United States of America. [2] Kohler, B.U., Hennig, C. and Orglmeister, R. (2002) The principles of software QRS detection. IEEE Magazine of Engineering in Medicine and Biology, 21(1), 42-57. [3] Martinez, J.P., Almeida, R., Olmos, S., Rocha, A.P. and La-guna, P. (2004) A wavelet-based ECG delineator: Eva- luation on standard databases. IEEE Transactions on Biomedical Engineering, 51(4), 570-581. [4] Minami, K., Nakajima, H. and Toyoshima, T. (1999) Real-time discrimination of ventricular tachyarrhythmia with fourier-transform neural network. IEEE Transac- tions on Biomedical Engineering, 46(2), 179-185. [5] Prasad, G.K. and Sahambi, J.S. (2003) Classification of ECG arrhythmias using multi-resolution analysis and neural networks. Conference on Convergent Technologies for Asia-Pacific region, 1, 227-231. [6] Al-Fahoum, A.S. and Howitt, I. (1999) Combined wave- let transform and radial basis neural networks for the classifying life threatening cardiac arrhythmias. Medical & Biological Engineering & Computing, 37, 566-573. [7] Addison, P.S., Watson, J.N., Clegg, G.R., Holzer, M., Sterz, F. and Robertson, C.E. (2000) A Novel wavelet based analysis reveals hidden structure in ventricular fib- rillation. IEEE Engineering in Medicine and Biology, 19(4), 383-392. [8] Chen,Y.-H. and Yu, S.N. (2007) Subband features based on higher order statistics for ECG beat classification. 29th Annual International Conference of IEEE Engi- neering in Medicine and Biology Society, Lyon, January 1, 2001. [9] Afsar, F.A. and Arif, M. (2008) Robust electrocardiogram (ECG) beat classification using discrete wavelet trans- form. Physiological Measurement, 29, 555-570. [10] Yu, S.N. and Chou, K.T. (2007) A switchable scheme for ECG beat classification based on independent component analysis. Expert System Applications, 33(4), 824-829. [11] Bortolan, G., Bortolan, G., Jekova, I., Jekova, I. and Christov, I. (2005) Comparison of four methods for pre- mature ventricular contraction and normal beat clustering. Computers in Cardiology, 2005, 921-924. [12] Exarchos, T.P., Tsipouras, M.G., Exarchos, C.P., Papa- loukas, C., Fotiadis, D.I. and Michalis, L.K. (2007) A methodology for the automated creation of fuzzy expert systems for ischemic and arrhythmic beat classification based on a set of rules obtained by a decision tree. Artifi- cial Intelligence in Medicine, 40, 187-200. [13] Christov, I., Jekova, I. and Bortolan, G. (2005) Premature ventricular contraction classification by the Kth nearest- neighbours rule. Physiological Measurement, 1, 123. [14] Mark, R. and Moody, G. (1988) MIT-BIH arrhythmia database directory. Second Edition, MIT Press, Cambridge. [15] Duda, R., Hart, P. and Stork, D. (2001) Pattern classifica- tion. Second Edition, John Wiley and Sons, Inc, New York. [16] Keller, J.M., Gray, M.R. and Givens, J.A. (1985) A fuzzy k-nearest neighbor algorithm. IEEE Transactions on Sys- tems, Man and Cybernetics, SMC-15(4), 580. [17] Wilson, D.R. and Martinez, T.R. (2000) Reduttion tech- niques for instance based learning algorithms. Machine Learning, 38(3), 257-286. [18] Merkwirth, C., Parlitz, U. and Lauterborn, W. (2000) Fast nearest-neighbor searching for nonlinear signal process- ing. Physical Review E, 62(2), 2089-2097. [19] Hart, P.E. (1968) The condensed nearest neighbor rule. IEEE Transactions on Information Theory, 14, 515-516. [20] Ritter, G.L., Woodruff, H.B., Lowry, S.R. and Isenhour, T.L. (1975) An algorithm for a selective nearest neighbor de- cision rule. IEEE Transactions on Information Theory, 21(6), 665-669. [21] Aha, D.W., Kibler, D. and Albert, M.K. (1991) Instance- based learning algorithms. Machine Learning, 6, 37-66. [22] Wilson, D.R. and Martinez, T.R. (1997) Improved het- ero-geneous distance functions. Journal of Artificial In- telligence Research (JAIR), 6(1), 1-34. [23] Wilson, D.L. (1972) Asymptotic properties of nearest neighbor rules using edited data. IEEE Transactions on Systems, Man, and Cybernetics, 2(3), 408-421. [24] Tomek, I. (1976) An experiment with the edited near- est-neighbor rule. IEEE Transactions on Systems, Man, and Cybernetics, 6(6), 448-452. [25] Cameron-Jones, R.M. (1995) Instance selection by en-  M. Arif et al. / J. Biomedical Science and Engineering 3 (2010) 380-389 Copyright © 2010 SciRes. JBiSE 389 coding length heuristic with random mutation hill climb- ing. Proceedings of the Eighth Australian Joint Confer- ence on Artificial Intelligence, 99-106. [26] Osowski, S. and Tran, H.L. (2001) ECG beat recognition using fuzzy hybrid neural network. IEEE Transactions on Biomedical Engineering, 48(11), 1265-1271. [27] Güler, İ. and Übeylı, E.D. (2005a) ECG beat classifier designed by combined neural network model. Pattern recognition, 38, 199-208. [28] Güler, İ. and Übeylı, E.D. (2005b) A modified mixture of experts network structure for ECG beats classification with diverse features. Engineering Applied Artificial In- telligence, 18, 845-856. [29] Dokur, Z., Olmez, T. and Yazgan, E. (1999) Comparison of discrete wavelet and fourier transforms for ECG beat classification. Electronics Letters, 35(18), 1502-1504. [30] Yu, S.-N. and Chen, Y.-H. (2007) Electrocardiogram beat classification based on wavelet transformation and prob- abilistic neural network. Pattern Recognition Letters, 28(10), 1142-1150. [31] Yu, S.-N. and Chou, K.-T. (2008) Selection of significant independent components for ECG beat classification. Expert Systems with Applications, 36(2), 2088-2096. |