Paper Menu >>
Journal Menu >>
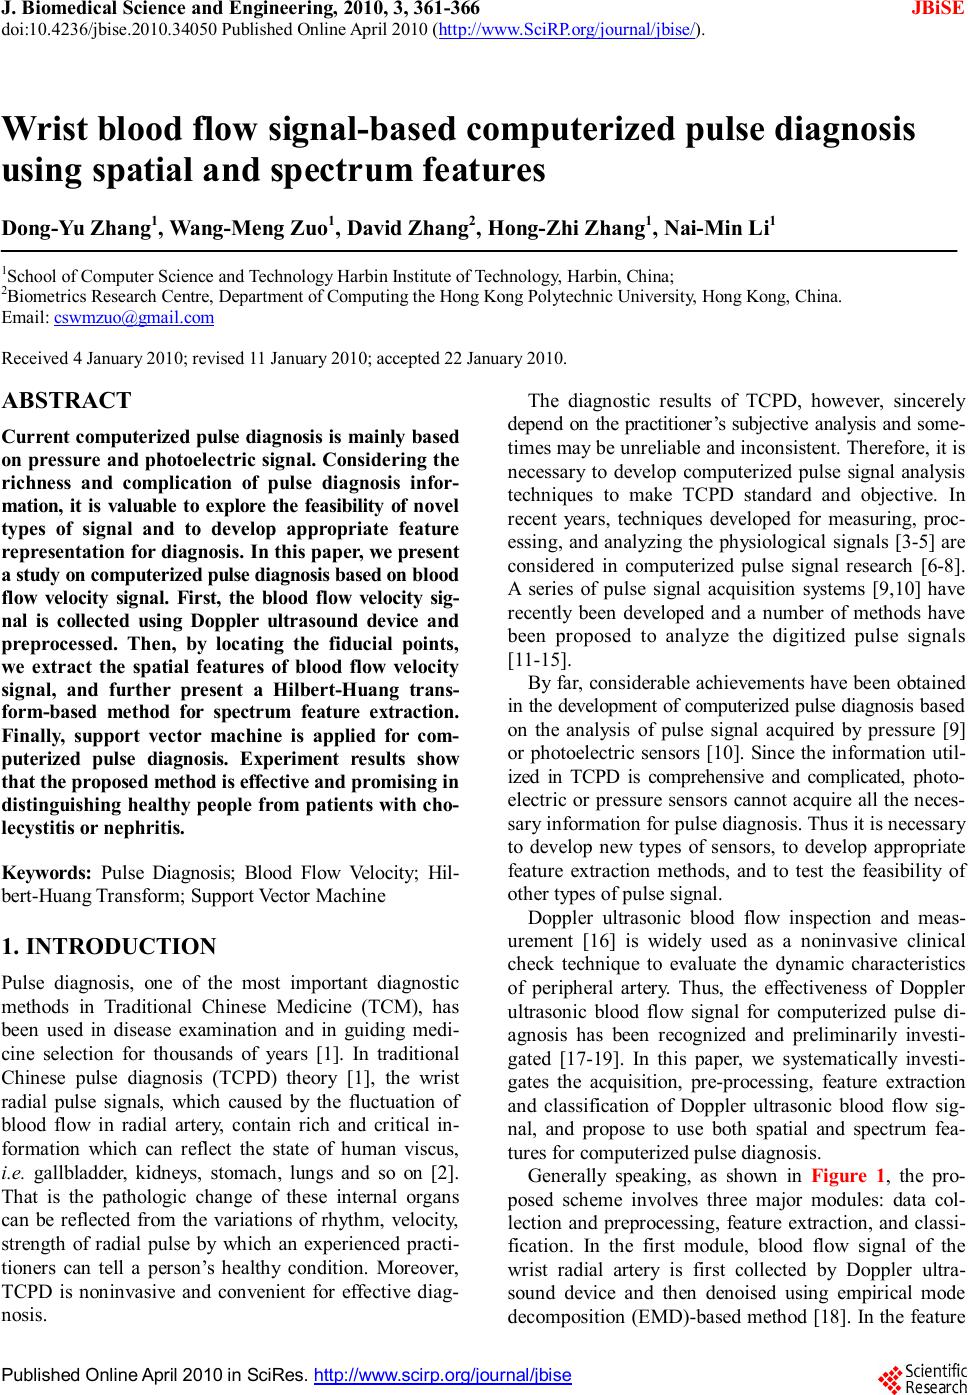 J. Biomedical Science and Engineering, 2010, 3, 361-366 JBiSE doi:10.4236/jbise.2010.34050 Published Online April 2010 (http://www.SciRP.org/journal/jbise/). Published Online April 2010 in SciRes. http://www.scirp.org/journal/jbise Wrist blood flow signal-based computerized pulse diagnosis using spatial and spectrum features Dong-Yu Zhang1, Wang-Meng Zuo1, David Zhang2, Hong-Zhi Zhang1, Nai-Min Li1 1School of Computer Science and Technology Harbin Institute of Technology, Harbin, China; 2 Biometrics Research Centre, Department of Computing the Hong Kong Polytechnic University, Hong Kong, China. Email: cswmzuo@gmail.com Received 4 January 2010; revised 11 January 2010; accepted 22 January 2010. ABSTRACT Current computerized pulse diagnosis is mainly based on pressure and photoelectric signal. Considering the richness and complication of pulse diagnosis infor- mation, it is valuable to explore the feasibility of novel types of signal and to develop appropriate feature representation for diagnosis. In this paper, we present a study on computerized pulse diagnosis based on blood flow velocity signal. First, the blood flow velocity sig- nal is collected using Doppler ultrasound device and preprocessed. Then, by locating the fiducial points, we extract the spatial features of blood flow velocity signal, and further present a Hilbert-Huang trans- form-based method for spectrum feature extraction. Finally, support vector machine is applied for com- puterized pulse diagnosis. Experiment results show that the proposed method is effective and promising in distinguishing healthy people from patients with cho- lecystitis or nephritis. Keywords: Pulse Diagnosis; Blood Flow Velocity; Hil- bert-Huang Transform; Support Vector Machine 1. INTRODUCTION Pulse diagnosis, one of the most important diagnostic methods in Traditional Chinese Medicine (TCM), has been used in disease examination and in guiding medi- cine selection for thousands of years [1]. In traditional Chinese pulse diagnosis (TCPD) theory [1], the wrist radial pulse signals, which caused by the fluctuation of blood flow in radial artery, contain rich and critical in- formation which can reflect the state of human viscus, i.e. gallbladder, kidneys, stomach, lungs and so on [2]. That is the pathologic change of these internal organs can be reflected from the variations of rhythm, velocity, strength of radial pulse by which an experienced practi- tioners can tell a person’s healthy condition. Moreover, TCPD is noninvasive and convenient for effective diag- nosis. The diagnostic results of TCPD, however, sincerely depend on the practitioner’s subjective analysis and some- times may be unreliable and inconsistent. Therefore, it is necessary to develop computerized pulse signal analysis techniques to make TCPD standard and objective. In recent years, techniques developed for measuring, proc- essing, and analyzing the physiological signals [3-5] are considered in computerized pulse signal research [6-8]. A series of pulse signal acquisition systems [9,10] have recently been developed and a number of methods have been proposed to analyze the digitized pulse signals [11-15]. By far, considerable achievements have been obtained in the development of computerized pulse diagnosis based on the analysis of pulse signal acquired by pressure [9] or photoelectric sensors [10]. Since the information util- ized in TCPD is comprehensive and complicated, photo- electric or pressure sensors cannot acquire all the neces- sary information for pulse diagnosis. Thus it is necessary to develop new types of sensors, to develop appropriate feature extraction methods, and to test the feasibility of other types of pulse signal. Doppler ultrasonic blood flow inspection and meas- urement [16] is widely used as a noninvasive clinical check technique to evaluate the dynamic characteristics of peripheral artery. Thus, the effectiveness of Doppler ultrasonic blood flow signal for computerized pulse di- agnosis has been recognized and preliminarily investi- gated [17-19]. In this paper, we systematically investi- gates the acquisition, pre-processing, feature extraction and classification of Doppler ultrasonic blood flow sig- nal, and propose to use both spatial and spectrum fea- tures for computerized pulse diagnosis. Generally speaking, as shown in Figure 1, the pro- posed scheme involves three major modules: data col- lection and preprocessing, feature extraction, and classi- fication. In the first module, blood flow signal of the wrist radial artery is first collected by Doppler ultra- sound device and then denoised using empirical mode decomposition (EMD)-based method [18]. In the feature 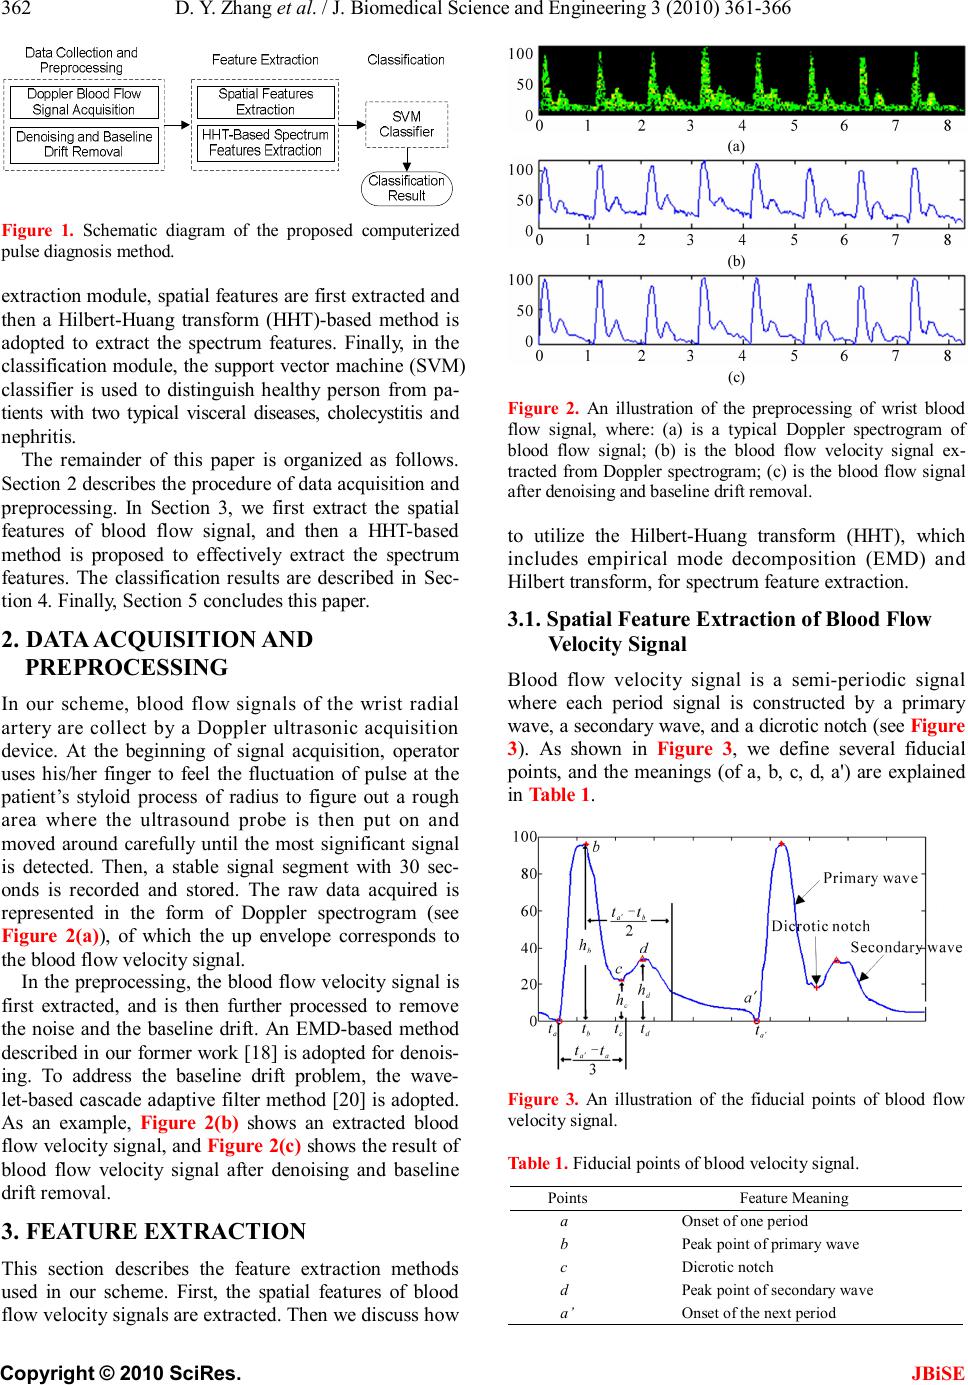 D. Y. Zhang et al. / J. Biomedical Science and Engineering 3 (2010) 361-366 Copyright © 2010 SciRes. JBiSE 362 Figure 1. Schematic diagram of the proposed computerized pulse diagnosis method. extraction module, spatial features are first extracted and then a Hilbert-Huang transform (HHT)-based method is adopted to extract the spectrum features. Finally, in the classification module, the support vector machine (SVM) classifier is used to distinguish healthy person from pa- tients with two typical visceral diseases, cholecystitis and nephritis. The remainder of this paper is organized as follows. Section 2 describes the procedure of data acquisition and preprocessing. In Section 3, we first extract the spatial features of blood flow signal, and then a HHT-based method is proposed to effectively extract the spectrum features. The classification results are described in Sec- tion 4. Finally, Section 5 concludes this paper. 2. DATA ACQUISITION AND PREPROCESSING In our scheme, blood flow signals of the wrist radial artery are collect by a Doppler ultrasonic acquisition device. At the beginning of signal acquisition, operator uses his/her finger to feel the fluctuation of pulse at the patient’s styloid process of radius to figure out a rough area where the ultrasound probe is then put on and moved around carefully until the most significant signal is detected. Then, a stable signal segment with 30 sec- onds is recorded and stored. The raw data acquired is represented in the form of Doppler spectrogram (see Figure 2(a)), of which the up envelope corresponds to the blood flow velocity signal. In the preprocessing, the blood flow velocity signal is first extracted, and is then further processed to remove the noise and the baseline drift. An EMD-based method described in our former work [18] is adopted for denois- ing. To address the baseline drift problem, the wave- let-based cascade adaptive filter method [20] is adopted. As an example, Figure 2(b) shows an extracted blood flow velocity signal, and Figure 2(c) shows the result of blood flow velocity signal after denoising and baseline drift removal. 3. FEATURE EXTRACTION This section describes the feature extraction methods used in our scheme. First, the spatial features of blood flow velocity signals are extracted. Then we discuss how (a) (b) (c) Figure 2. An illustration of the preprocessing of wrist blood flow signal, where: (a) is a typical Doppler spectrogram of blood flow signal; (b) is the blood flow velocity signal ex- tracted from Doppler spectrogram; (c) is the blood flow signal after denoising and baseline drift removal. to utilize the Hilbert-Huang transform (HHT), which includes empirical mode decomposition (EMD) and Hilbert transform, for spectrum feature extraction. 3.1. Spatial Feature Extraction of Blood Flow Velocity Signal Blood flow velocity signal is a semi-periodic signal where each period signal is constructed by a primary wave, a secondary wave, and a dicrotic notch (see Figure 3). As shown in Figure 3, we define several fiducial points, and the meanings (of a, b, c, d, a') are explained in Table 1. Figure 3. An illustration of the fiducial points of blood flow velocity signal. Table 1. Fiducial points of blood velocity signal. Points Feature Meaning a Onset of one period b Peak point of primary wave c Dicrotic notch d Peak point of secondary wave a’ Onset of the next period 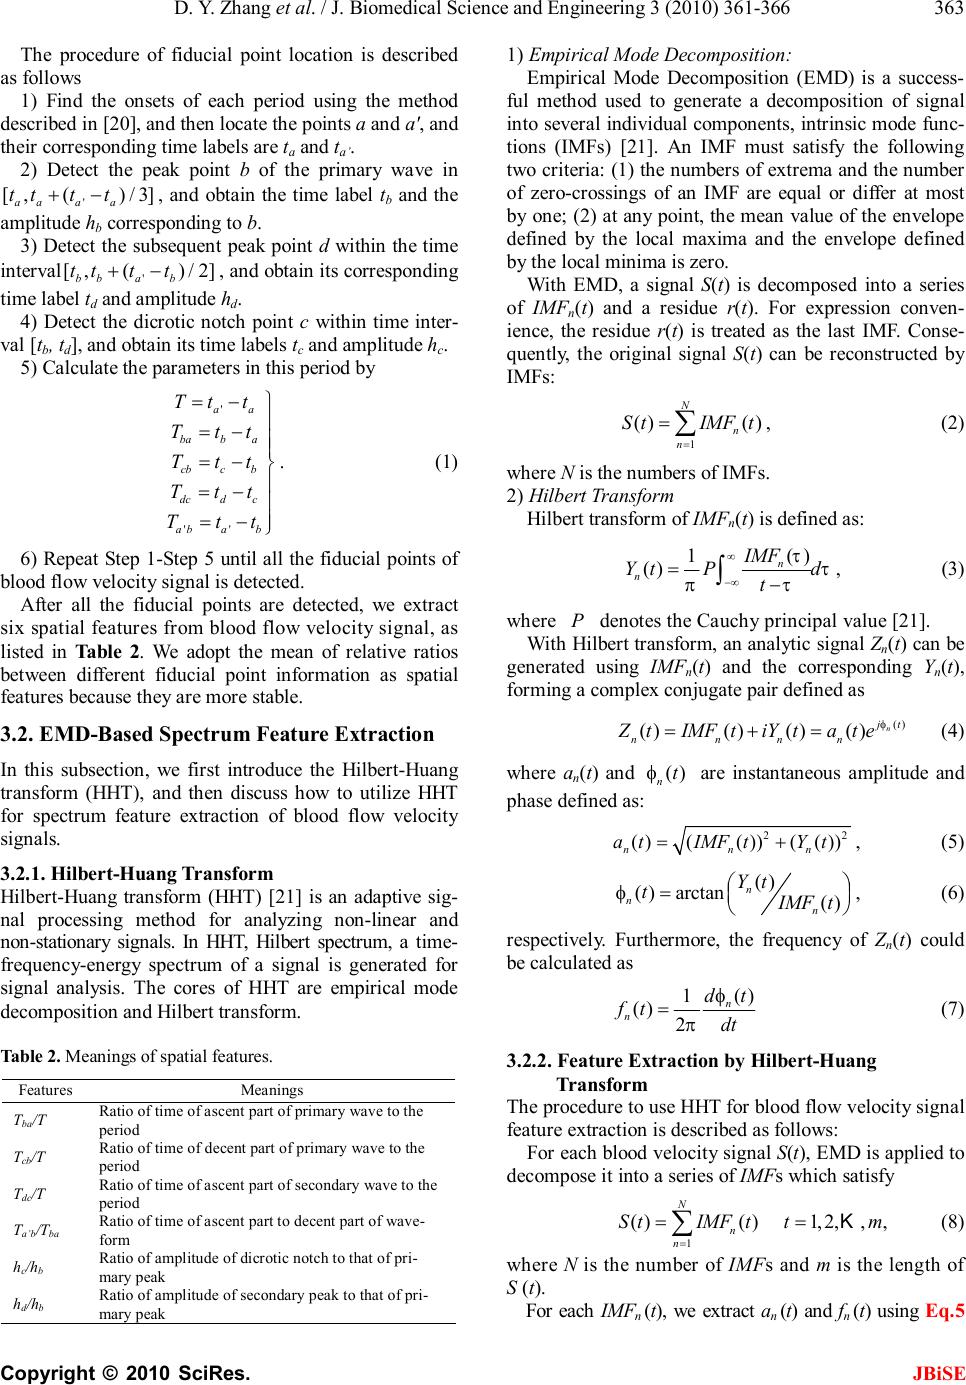 D. Y. Zhang et al. / J. Biomedical Science and Engineering 3 (2010) 361-366 Copyright © 2010 SciRes. JBiSE 363 The procedure of fiducial point location is described as follows 1) Find the onsets of each period using the method described in [20], and then locate the points a and a', and their corresponding time labels are ta and ta’. 2) Detect the peak point b of the primary wave in ' [,()/3] aaaa tttt+− , and obtain the time label tb and the amplitude hb corresponding to b . 3) Detect the subsequent peak point d within the time interval ' [,()/2] bbab tttt+−, and obtain its corresponding time label td and amplitude hd. 4) Detect the dicrotic notch point c within time inter- val [tb, td], and obtain its time labels tc and amplitude hc. 5) Calculate the parameters in this period by ' '' aa baba cbcb dcdc abab Ttt Ttt Ttt Ttt Ttt =− =− =− =− =− . (1) 6) Repeat Step 1-Step 5 until all the fiducial points of blood flow velocity signal is detected. After all the fiducial points are detected, we extract six spatial features from blood flow velocity signal, as listed in Table 2. We adopt the mean of relative ratios between different fiducial point information as spatial features because they are more stable. 3.2. EMD-Based Spectrum Feature Extraction In this subsection, we first introduce the Hilbert-Huang transform (HHT), and then discuss how to utilize HHT for spectrum feature extraction of blood flow velocity signals. 3.2.1. Hilbert-Huang Transform Hilbert-Huang transform (HHT) [21] is an adaptive sig- nal processing method for analyzing non-linear and non-stationary signals. In HHT, Hilbert spectrum, a time- frequency-energy spectrum of a signal is generated for signal analysis. The cores of HHT are empirical mode decomposition and Hilbert transform. Table 2. Meanings of spatial features. Features Meanings Tba/T Ratio of time of ascent part of primary wave to the period Tcb/T Ratio of time of decent part of primary wave to the period Tdc/T Ratio of time of ascent part of secondary wave to the period Ta’b/Tba Ratio of time of ascent part to decent part of wave- form hc/hb Ratio of amplitude of dicrotic notch to that of pri- mary peak hd/hb Ratio of amplitude of secondary peak to that of pri- mary peak 1) Empirical Mode Decomposition: Empirical Mode Decomposition (EMD) is a success- ful method used to generate a decomposition of signal into several individual components, intrinsic mode func- tions (IMFs) [21]. An IMF must satisfy the following two criteria: (1) the numbers of extrema and the number of zero-crossings of an IMF are equal or differ at most by one; (2) at any point, the mean value of the envelope defined by the local maxima and the envelope defined by the local minima is zero. With EMD, a signal S (t) is decomposed into a series of IMFn(t) and a residue r(t). For expression conven- ience, the residue r(t) is treated as the last IMF. Conse- quently, the original signal S (t) can be reconstructed by IMFs: 1 ()() N n n StIMFt = =∑, (2) where N is the numbers of IMFs. 2) Hilbert Transform Hilbert transform of IMFn(t) is defined as: () 1 () n n IMF YtPd t ∞ −∞ =− ∫τ τ πτ , (3) where P denotes the Cauchy principal value [21]. With Hilbert transform, an analytic signal Zn(t) can be generated using IMFn(t) and the corresponding Yn(t), forming a complex conjugate pair defined as () ()()()() n jt nnnn ZtIMFtiYtate=+= φ (4) where an(t) and () n t φ are instantaneous amplitude and phase defined as: 22 ()(())(()) nnn atIMFtYt =+, (5) () ()arctan () n nn Yt t IMFt = φ, (6) respectively. Furthermore, the frequency of Zn(t) could be calculated as () 1 () 2n n dt ft dt =φ π (7) 3.2.2. Feature Extraction by Hilbert-Huang Transform The procedure to use HHT for blood flow velocity signal feature extraction is described as follows: For each blood velocity signal S(t), EMD is applied to decompose it into a series of IMFs which satisfy 1 ()()1,2,,, N n n StIMFttm = == ∑K (8) where N is the number of IMFs and m is the length of S (t). For each IMFn (t), we extract an (t) and f n (t) using Eq.5 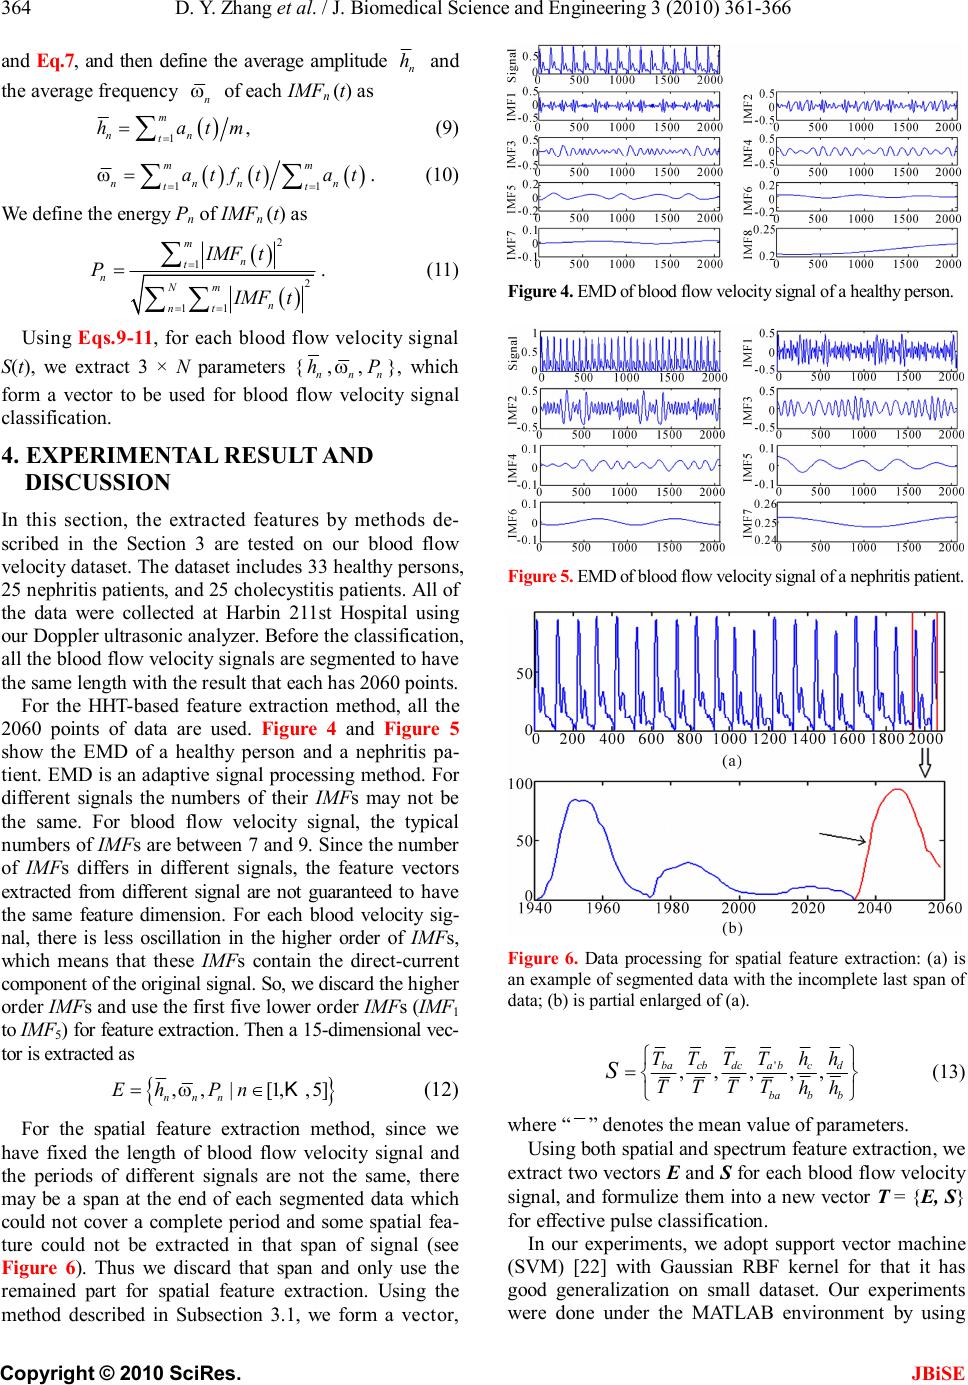 D. Y. Zhang et al. / J. Biomedical Science and Engineering 3 (2010) 361-366 Copyright © 2010 SciRes. JBiSE 364 and Eq.7, and then define the average amplitude n h and the average frequency n ω of each IMFn (t) as () 1 , m nn t hatm = =∑ (9) () () () 11 mm nnnn tt atftat == = ∑∑ ω. (10) We define the energy P n of IMFn (t) as () () 2 1 2 11 m n t nNm n nt IMFt P IMFt = == =∑ ∑∑ . (11) Using Eqs.9-11, for each blood flow velocity signal S(t), we extract 3 × N parameters { n h , n ω , n P }, which form a vector to be used for blood flow velocity signal classification. 4. EXPERIMENTAL RESULT AND DISCUSSION In this section, the extracted features by methods de- scribed in the Section 3 are tested on our blood flow velocity dataset. The dataset includes 33 healthy persons, 25 nephritis patients, and 25 cholecystitis patients. All of the data were collected at Harbin 211st Hospital using our Doppler ultrasonic analyzer. Before the classification, all the blood flow velocity signals are segmented to have the same length with the result that each has 2060 points. For the HHT-based feature extraction method, all the 2060 points of data are used. Figure 4 and Figure 5 show the EMD of a healthy person and a nephritis pa- tient. EMD is an adaptive signal processing method. For different signals the numbers of their IMFs may not be the same. For blood flow velocity signal, the typical numbers of IMFs are between 7 and 9. Since the number of IMFs differs in different signals, the feature vectors extracted from different signal are not guaranteed to have the same feature dimension. For each blood velocity sig- nal, there is less oscillation in the higher order of IMFs, which means that these IMFs contain the direct-current component of the original signal. So, we discard the higher order IMFs and use the first five lower order IMFs (IMF1 to IMF5) for feature extraction. Then a 15-dimensional vec- tor is extracted as { } ,,|[1,,5] nnn EhPn=∈Kω (12) For the spatial feature extraction method, since we have fixed the length of blood flow velocity signal and the periods of different signals are not the same, there may be a span at the end of each segmented data which could not cover a complete period and some spatial fea- ture could not be extracted in that span of signal (see Figure 6). Thus we discard that span and only use the remained part for spatial feature extraction. Using the method described in Subsection 3.1, we form a vector, Figure 4. EMD of blood flow velocity signal of a healthy person. Figure 5. EMD of blood flow velocity signal of a nephritis patient. Figure 6. Data processing for spatial feature extraction: (a) is an example of segmented data with the incomplete last span of data; (b) is partial enlarged of (a). ' ,,,,, bacbdcabcd ba bb TTTThh TTTT hh S = (13) where “ ” denotes the mean value of parameters. Using both spatial and spectrum feature extraction, we extract two vectors E and S for each blood flow velocity signal, and formulize them into a new vector T = {E, S} for effective pulse classification. In our experiments, we adopt support vector machine (SVM) [22] with Gaussian RBF kernel for that it has good generalization on small dataset. Our experiments were done under the MATLAB environment by using 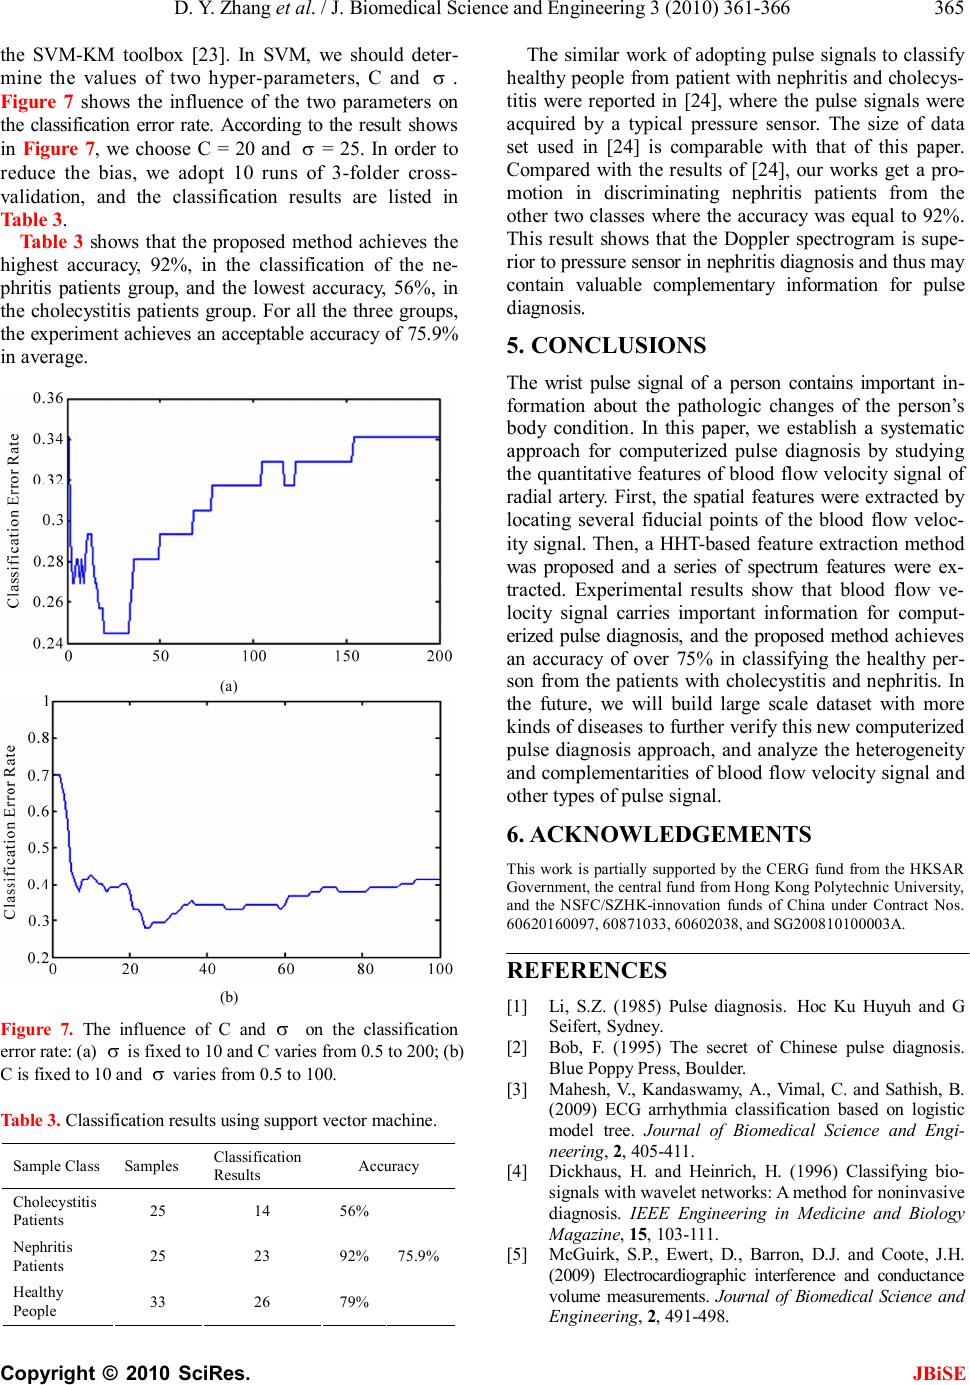 D. Y. Zhang et al. / J. Biomedical Science and Engineering 3 (2010) 361-366 Copyright © 2010 SciRes. JBiSE 365 the SVM-KM toolbox [23]. In SVM, we should deter- mine the values of two hyper-parameters, C and σ . Figure 7 shows the influence of the two parameters on the classification error rate. According to the result shows in Figure 7, we choose C = 20 and σ = 25. In order to reduce the bias, we adopt 10 runs of 3-folder cross- validation, and the classification results are listed in Table 3. Table 3 shows that the proposed method achieves the highest accuracy, 92%, in the classification of the ne- phritis patients group, and the lowest accuracy, 56%, in the cholecystitis patients group. For all the three groups, the experiment achieves an acceptable accuracy of 75.9% in average. (a) (b) Figure 7. The influence of C and σ on the classification error rate: (a) σ is fixed to 10 and C varies from 0.5 to 200; (b) C is fixed to 10 and σ varies from 0.5 to 100. Table 3. Classification results using support vector machine. Sample Class Samples Classification Results Accuracy Cholecystitis Patients 25 14 56% Nephritis Patients 25 23 92% Healthy People 33 26 79% 75.9% The similar work of adopting pulse signals to classify healthy people from patient with nephritis and cholecys- titis were reported in [24], where the pulse signals were acquired by a typical pressure sensor. The size of data set used in [24] is comparable with that of this paper. Compared with the results of [24], our works get a pro- motion in discriminating nephritis patients from the other two classes where the accuracy was equal to 92%. This result shows that the Doppler spectrogram is supe- rior to pressure sensor in nephritis diagnosis and thus may contain valuable complementary information for pulse diagnosis. 5. CONCLUSIONS The wrist pulse signal of a person contains important in- formation about the pathologic changes of the person’s body condition. In this paper, we establish a systematic approach for computerized pulse diagnosis by studying the quantitative features of blood flow velocity signal of radial artery. First, the spatial features were extracted by locating several fiducial points of the blood flow veloc- ity signal. Then, a HHT-based feature extraction method was proposed and a series of spectrum features were ex- tracted. Experimental results show that blood flow ve- locity signal carries important information for comput- erized pulse diagnosis, and the proposed method achieves an accuracy of over 75% in classifying the healthy per- son from the patients with cholecystitis and nephritis. In the future, we will build large scale dataset with more kinds of diseases to further verify this new computerized pulse diagnosis approach, and analyze the heterogeneity and complementarities of blood flow velocity signal and other types of pulse signal. 6. ACKNOWLEDGEMENTS This work is partially supported by the CERG fund from the HKSAR Government, the central fund from Hong Kong Polytechnic University, and the NSFC/SZHK-innovation funds of China under Contract Nos. 60620160097, 60871033, 60602038, and SG200810100003A. REFERENCES [1] Li, S.Z. (1985) Pulse diagnosis. Hoc Ku Huyuh and G Seifert, Sydney. [2] Bob, F. (1995) The secret of Chinese pulse diagnosis. Blue Poppy Press, Boulder. [3] Mahesh, V., Kandaswamy, A., Vimal, C. and Sathish, B. (2009) ECG arrhythmia classification based on logistic model tree. Journal of Biomedical Science and Engi- neering, 2, 405-411. [4] Dickhaus, H. and Heinrich, H. (1996) Classifying bio- signals with wavelet networks: A method for noninvasive diagnosis. IEEE Engineering in Medicine and Biology Magazine, 15, 103-111. [5] McGuirk, S.P., Ewert, D., Barron, D.J. and Coote, J.H. (2009) Electrocardiographic interference and conductance volume measurements. Journal of Biomedical Science and Engineering, 2, 491-498. 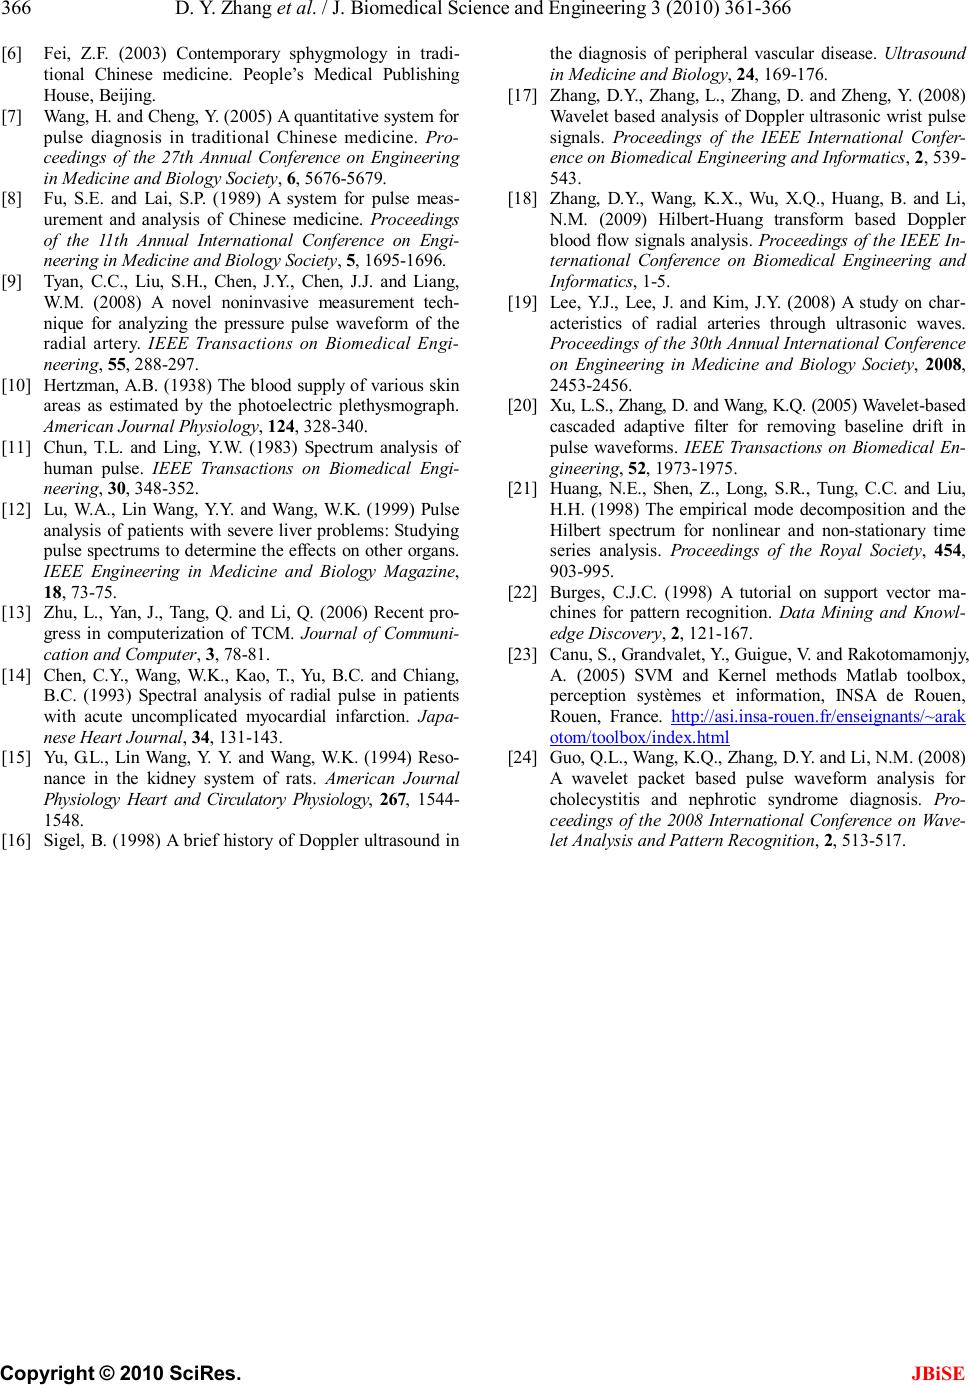 D. Y. Zhang et al. / J. Biomedical Science and Engineering 3 (2010) 361-366 Copyright © 2010 SciRes. JBiSE 366 [6] Fei, Z.F. (2003) Contemporary sphygmology in tradi- tional Chinese medicine. People’s Medical Publishing House, Beijing. [7] Wang, H. and Cheng, Y. (2005) A quantitative system for pulse diagnosis in traditional Chinese medicine. Pro- ceedings of the 27th Annual Conference on Engineering in Medicine and Biology Society, 6, 5676-5679. [8] Fu, S.E. and Lai, S.P. (1989) A system for pulse meas- urement and analysis of Chinese medicine. Proceedings of the 11th Annual International Conference on Engi- neering in Medicine and Biology Society, 5, 1695-1696. [9] Tyan, C.C., Liu, S.H., Chen, J.Y., Chen, J.J. and Liang, W.M. (2008) A novel noninvasive measurement tech- nique for analyzing the pressure pulse waveform of the radial artery. IEEE Transactions on Biomedical Engi- neering, 55, 288-297. [10] Hertzman, A.B. (1938) The blood supply of various skin areas as estimated by the photoelectric plethysmograph. American Journal Physiology, 124, 328-340. [11] Chun, T.L. and Ling, Y.W. (1983) Spectrum analysis of human pulse. IEEE Transactions on Biomedical Engi- neering, 30, 348-352. [12] Lu, W.A., Lin Wang, Y.Y. and Wang, W.K. (1999) Pulse analysis of patients with severe liver problems: Studying pulse spectrums to determine the effects on other organs. IEEE Engineering in Medicine and Biology Magazine, 18, 73-75. [13] Zhu, L., Yan, J., Tang, Q. and Li, Q. (2006) Recent pro- gress in computerization of TCM. Journal of Communi- cation and Computer , 3, 78-81. [14] Chen, C.Y., Wang, W.K., Kao, T., Yu, B.C. and Chiang, B.C. (1993) Spectral analysis of radial pulse in patients with acute uncomplicated myocardial infarction. Japa- nese Heart Journal, 34, 131-143. [15] Yu, G.L., Lin Wang, Y. Y. and Wang, W.K. (1994) Reso- nance in the kidney system of rats. American Journal Physiology Heart and Circulatory Physiology, 267, 1544- 1548. [16] Sigel, B. (1998) A brief history of Doppler ultrasound in the diagnosis of peripheral vascular disease. Ultrasound in Medicine and Biology, 24, 169-176. [17] Zhang, D.Y., Zhang, L., Zhang, D. and Zheng, Y. (2008) Wavelet based analysis of Doppler ultrasonic wrist pulse signals. Proceedings of the IEEE International Confer- ence on Biomedical Engineering and Informatics , 2 , 539- 543. [18] Zhang, D.Y., Wang, K.X., Wu, X.Q., Huang, B. and Li, N.M. (2009) Hilbert-Huang transform based Doppler blood flow signals analysis. Proceedings of the IEEE In- ternational Conference on Biomedical Engineering and Informatics, 1-5. [19] Lee, Y.J., Lee, J. and Kim, J.Y. (2008) A study on char- acteristics of radial arteries through ultrasonic waves. Proceedings of the 30th Annual International Conference on Engineering in Medicine and Biology Society, 2008, 2453-2456. [20] Xu, L.S., Zhang, D. and Wang, K.Q. (2005) Wavelet-based cascaded adaptive filter for removing baseline drift in pulse waveforms. IEEE Transactions on Biomedical En- gineering, 52, 1973-1975. [21] Huang, N.E., Shen, Z., Long, S.R., Tung, C.C. and Liu, H.H. (1998) The empirical mode decomposition and the Hilbert spectrum for nonlinear and non-stationary time series analysis. Proceedings of the Royal Society, 454, 903-995. [22] Burges, C.J.C. (1998) A tutorial on support vector ma- chines for pattern recognition. Data Mining and Knowl- edge Discovery, 2, 121-167. [23] Canu, S., Grandvalet, Y., Guigue, V. and Rakotomamonjy, A. (2005) SVM and Kernel methods Matlab toolbox, perception systèmes et information, INSA de Rouen, Rouen, France. http://asi.insa-rouen.fr/enseignants/~arak otom/toolbox/index.html [24] Guo, Q.L., Wang, K.Q., Zhang, D.Y. and Li, N.M. (2008) A wavelet packet based pulse waveform analysis for cholecystitis and nephrotic syndrome diagnosis. Pro- ceedings of the 2008 International Conference on Wave- let Analysis and Pattern Recognition, 2, 513-517. |