Health
Vol.6 No.1(2014), Article ID:42468,8 pages DOI:10.4236/health.2014.61016
First normative reference of standing long jump indicates gender difference in lower muscular strength of Macedonian school children
![]()
Faculty of Physical Culture, Ss. Cyril and Methodius University, Skopje, Macedonia; *Corresponding Author: gontarevserjoza@gmail.com
Copyright © 2014 Seryozha Gontarev et al. This is an open access article distributed under the Creative Commons Attribution License, which permits unrestricted use, distribution, and reproduction in any medium, provided the original work is properly cited. In accordance of the Creative Commons Attribution License all Copyrights © 2014 are reserved for SCIRP and the owner of the intellectual property Seryozha Gontarev et al. All Copyright © 2014 are guarded by law and by SCIRP as a guardian.
Received 23 November 2013; revised 25 December 2013; accepted 8 January 2014
ABSTRACT
Background: This is the first study to publish the normative reference values for assessment of the level of muscular strength through the “standing long jump” test carried out on a large sample of Macedonian school children. The normative values encompass a wide span of years (6 - 18). Methods: The research was realized in a large sample of 12618 school children at the age of 6 to 18 years from Macedonia. The sample was divided in 14 groups, according to chronological age and each age group was divided into two subgroups according to the criteria of gender. For estimation of the morphologic characteristics, the following anthropometric measures have been applied: body height in standing position (cm), body weight (kg), as well as the body mass index (BMI). Children aged 6 or above were invited to take a standing long jump test. Results: Boys show statistically better results in all age categories in the standing long jump test than girls, and these differences become bigger with the increase of age, especially after the 14th year (p < 0.000). Results from the linear regressive analysis show that the constants in predicting the standing long jump are similar both in boys and in girls. However, the age coefficient in boys is two times higher than in girls. The Body Mass Index, as a factor, influences two times more in boys in predicting the standing long jump, which indicates that the body size in boys has bigger inverse impacts on the results of the standing long jump than in girls. Conclusion: Normative reference values shall provide proper assessment and interpretation of the level of muscular strength of the Macedonian school children in terms of the age and gender, accurate detection of progress of an individual as well as undertaking preventive measures and level of intervention.
KEYWORDS
Fitness Testing; Standing Long Jump; Gender; Children; Adolescents; Lower Muscular Strength
1. INTRODUCTION
Physical fitness is a powerful marker of the health condition in childhood and adolescence [1,2]. Even in children and adolescents fitness is inversely associated with cardiovascular risk factors for chronic disease such as high blood pressure [3,4], total fatness [4], hyperinsulinemia [5], abdominal adiposity [6], atherogenic lipid profile [7] insulin resistance [8], and clustering of metabolic risk factors [9,10].
Physical fitness can be measured objectively and exactly through laboratory methods, however, because of the high price, the necessity of sophisticated equipment, qualified professional staff, time restrictions, the laboratory tests still cannot be used on population level. To the contrary, the on-site fitness tests are easy to be administered, include minimal equipment, may test a large number of respondents and may be evaluated in a short period of time [11-13]. In the school environment the onsite tests are economical and practical options for assessment of the level of physical fitness of the scholars.
Handgrip strength and standing long jump tests seem to be the most valid field-based muscular fitness tests when compared to isokinetic strength [14]. These tests, especially the standing long jump test which is constituent part of a large number of international batteries (EUROFIT, FITNESSGRAM, PCPF, AAUTB, YMCAYFT, IPFT, CAHPER-FPT II, NFTP-PRC, NZFT, AFEA) [15- 18] can be used for assessment of the muscular strength of the school children when the laboratory methods cannot be applied.
Researches in Brazil, realized with school children at the age of 7 - 15 years showed a connection between the standing long jump test and the other tests for assessment of the fitness (sit-and-reach, 1-minute curl-up, modified pull-up, medicine-ball throw, 9-minute run, 20-meter run and 4 meter shuttle-run) [19]. Recently published researches in girls at the age of 6 - 17 years also indicate a strong connection between the standing long jump and other tests for assessment of the strength abilities [20]. The standing long jump test is a very practical, time efficient and cheap method of assessing the muscular fitness in children and adolescents in school conditions.
Within the teaching program of physical education in the Republic of Macedonia there is no organized model (system) for follow-up and evaluation of the physical fitness. There are many partial researches using large battery fitness tests that are most often chosen based on scientific cognizance of a certain number of researches conducted in this sphere, in the region [21].
On the other side, the analysis of the available scientific works and researches studying the issue of following the physical fitness of the pupils at the classes of physical education leads to the conclusion that in the last three decades essential changes happened in terms of following-up the physical fitness worldwide compared to the previous period [22,23]. In the recent years, there were many scientific works and researches published, particularly by USA authors, elaborating certain problems and issues connected with follow-up of the fitness within the teaching of physical education [24-27]. One of the most important issues being discussed in these researches is the issue of establishing normative reference that would allow proper assessment, interpretation and comparison of the level of physical fitness of school children in terms of the age, gender, region etc. In the Republic of Macedonia teachers in physical education do not have defined normative reference through which they would interpret, compare and evaluate the physical fitness in the Macedonian school children.
This research has been realized for the same purpose, by means of which the authors would try to give answer to a part of the above mentioned problems, i.e. to define the gender differences, development phases (sensitive phases) and establishing (defining) the normative reference for the standing long jump test which would be used for continuous and systematic following-up of the muscular strength in the school children on the national level.
2. MATERIALS AND METHODS
2.1. Sample of Respondents
The research was realized on a sample of 12618 subjects, the population of students from the primary and secondary schools of R. Macedonia. The sample is divided into two sub-samples by gender, out of which 6780 male and 5838 female respondents. Each of the subsamples is also divided according to the chronological age in 14 age groups in the span of one calendar year. The sample is proportionally defined on state allocation of students in urban and rural environments.
The chronological age has been defined on the basis of decimal years (difference between the measurement date and date of birth, which are transformed into an appropriate sized division of the year into ten instead of twelve months). Accordingly, there are 14 male age groups and 14 female age groups established in span of one calendar year, as follows: 6 (6 - 6.9), 7 (7 - 7.9), 8 (8 - 8.9) 9 (9 - 9.9), 10 (10 - 10.9), 11 (11 - 11.9), 12 (12 - 12.9), 13 (13 - 13.9), 14 (14 - 14.9), 15 (15 - 15.9), 16 (16 - 16.9), 17 (17 - 17.9) and 18 (18 - 18.9) years.
The study included students for whom their parents had given consent to take part in the research, who were psychically and physically healthy and who regularly attended the classes of physical and health education. The respondents were treated in accordance with the Helsinki Declaration. Measurements were realized in March, April and May 2012, in standard school conditions at regular classes of physical and health education. The measurement was realized by experts from the area of kinesiology and medicine, previously trained to perform tests and to take anthropometric measures.
2.2. Anthropometric Measures and Evaluation of Physical Fitness
Measuring of the anthropometric measurements was realized at the recommendations given by IBP-International Biology Program, [28]. For estimation of the morphologic characteristics the following anthropometric measures have been applied: body height in standing position (cm), body weight (kg), as well as the body mass index (BMI). Children aged 6 or above were invited to take a standing long jump test. Each student’s longest jump distance from the starting point to the end point after two attempts was measured in centimetres.
2.3. Statistical Analysis
Statistical analysis, anthropometric and physical fitness characteristics of the study sample are presented as means (SD), unless otherwise indicated. We analysed sexand age-group differences in the anthropometric and physical fitness variables by two-way analysis of variance.
Paired t-test was used to compare means of distances performed in standing long jump test between boys and girls at the same age. A significance level of 5% was used for statistical testing. Continuous data of age and BMI were used to predict results in standing long jump test with linear regression.
To provide percentile values for Macedonian children and adolescents, we analyzed physical fitness data by maximum penalised likelihood using the LMS statistical method for boys and girls separately [29,30]. We derived smoothed centile charts using the LMS method. This estimates the measurement centiles in terms of three agesex-specificcubic spline curves: the L curve (Box-Cox power to remove skewness), M curve (median) and S curve (coefficient of variation). For the construction of the percentile curves, data were imported into the Lms Chart Maker software (v. 2.3; by Tim Cole and Huiqi Pan) and the L, M and S curves estimated. Except for the LMS method calculations, we used SPSS v. 17.0 software for Windows (SPSS, Chicago, Illinois, USA).
3. RESULTS
The results from the anthropometric characteristics and the standing long jump test in terms of sex and age are presented on Table 1. It is evident from the table that in average boys are heavier, higher, have higher body mass index (BMI) and in average they achieve better results in the standing long jump test (p < 0.000). In general, the anthropometric characteristics and the level of the muscle strength, assessed through the standing long jump test get increased with the age.
In Table 2, showing the values of arithmetic means and the level of statistical significance of the tests, one can see that there are significant statistical differences between male and female respondents in all age groups in the standing long jump test (p < 0.000).
Table 3 shows the normative values for the standing long jump test in Macedonian school children in terms of gender and age, expressed 5 to 95 percentile. Figure 1 presents the smoothed percentile curves (P5, P10, P25, P50, P75, P90, P95) of the standing long jump test in terms of age and gender. From the figure data, it is clearly evident that there is increase of the ability with increase of the age in both genders.
The connection of the predictor variables age and body mass (BMI) with the criterion variable standing long jump has been determined by a regressive analysis. Both predictor variables in both sexes have statistically significant impact on the criterion variable. Multiple correlation (R) in boys is 0.816 and explains 67% of the variability of variance (R2). Multiple correlation (R) in girls is 0.670 and explains 45% of the variability of variance (R2).
The formulated regression equations were as follows:
Boys: SLJ = 80.599 + 9.908 (Age) − 2.037 (BMI)
Girls: SLJ = 97.632 + 5.671 (Age) − 1.270 (BMI)
With all constants and independent variables significantly contributed in predicting standing long jump (p < 0.001).
4. DISCUSSION
The recently published literature indicates that physical fitness is an important health marker already in youth, [31,32], high lighting the need of meaningful and accurate physical fitness assessment in young people. Correct interpretation of physical fitness assessment requires comparing the score obtained in a particular person with normative values for the general population with the same sex and age.
In the context of this research there are normative values presented for certain age and sex for the standing long jump test in Macedonian children and adolescents.
The advantage of this research is the strict standardization at the on-site work in order to avoid the subjectivity because of inconsistency in the measurement protocols.
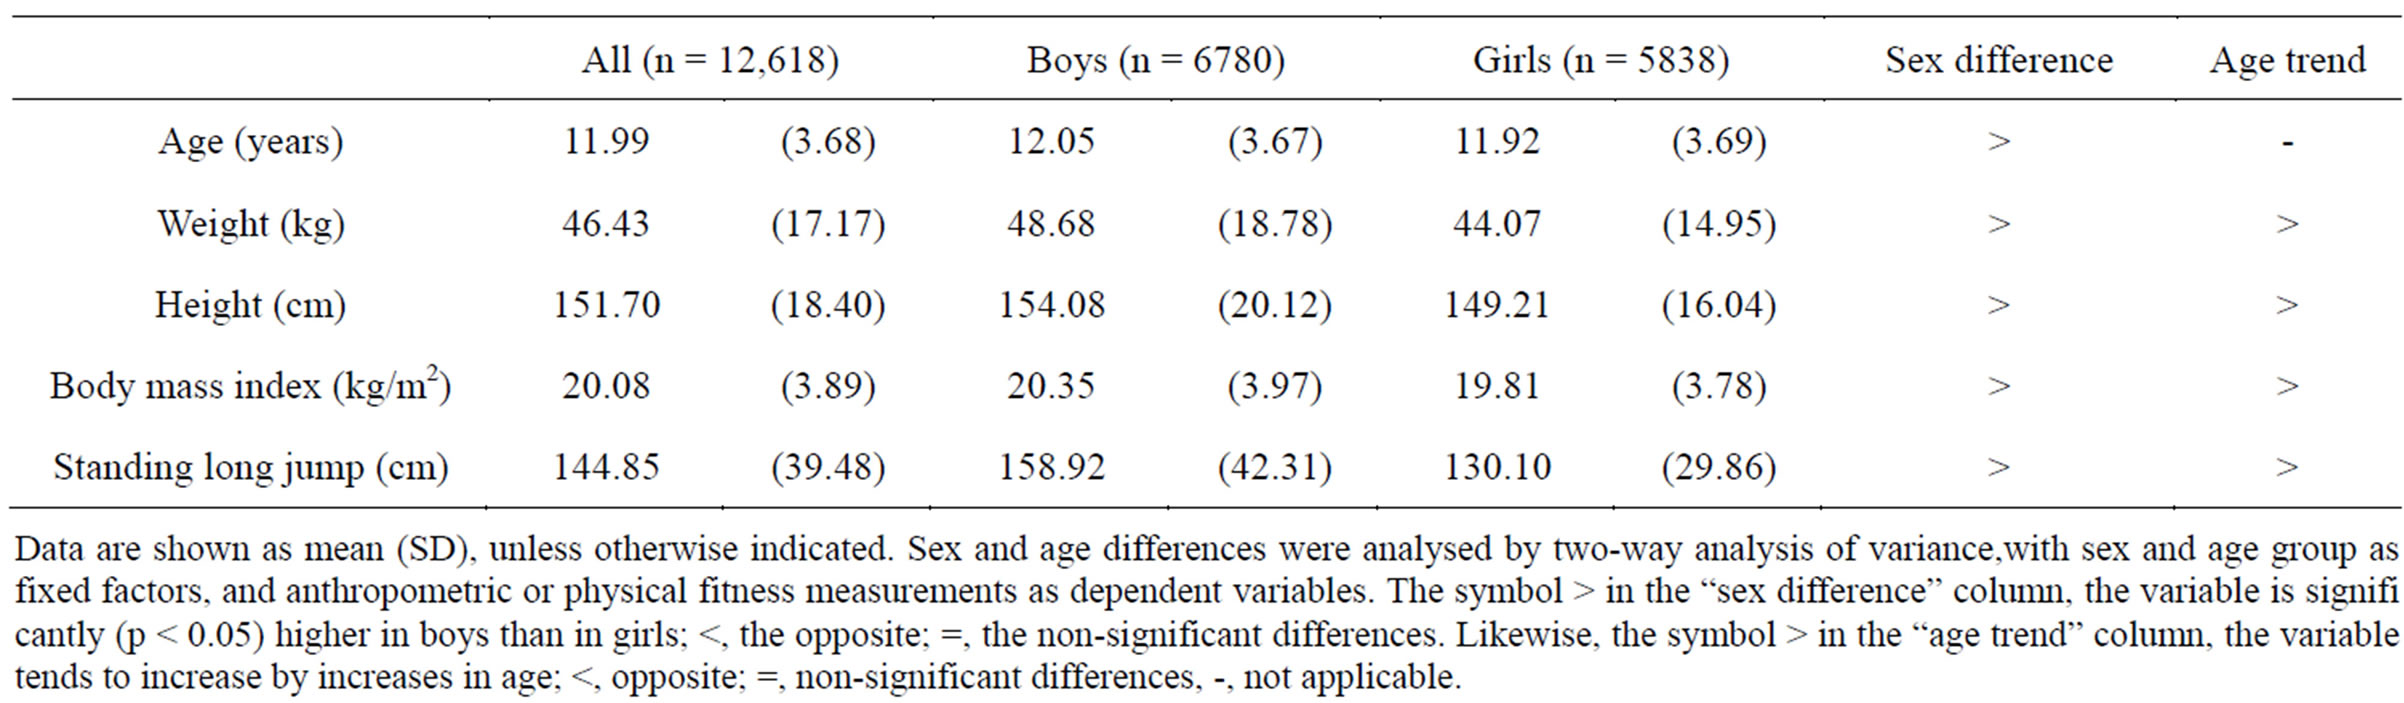
Table 1. Characteristics of the study sample by sex.
Data are shown as mean (SD), unless otherwise indicated. Sex and age differences were analysed by two-way analysis of variance,with sex and age group as fixed factors, and anthropometric or physical fitness measurements as dependent variables. The symbol > in the “sex difference” column, the variable is signifi cantly (p < 0.05) higher in boys than in girls; <, the opposite; =, the non-significant differences. Likewise, the symbol > in the “age trend” column, the variable tends to increase by increases in age; <, opposite; =, non-significant differences, -, not applicable.
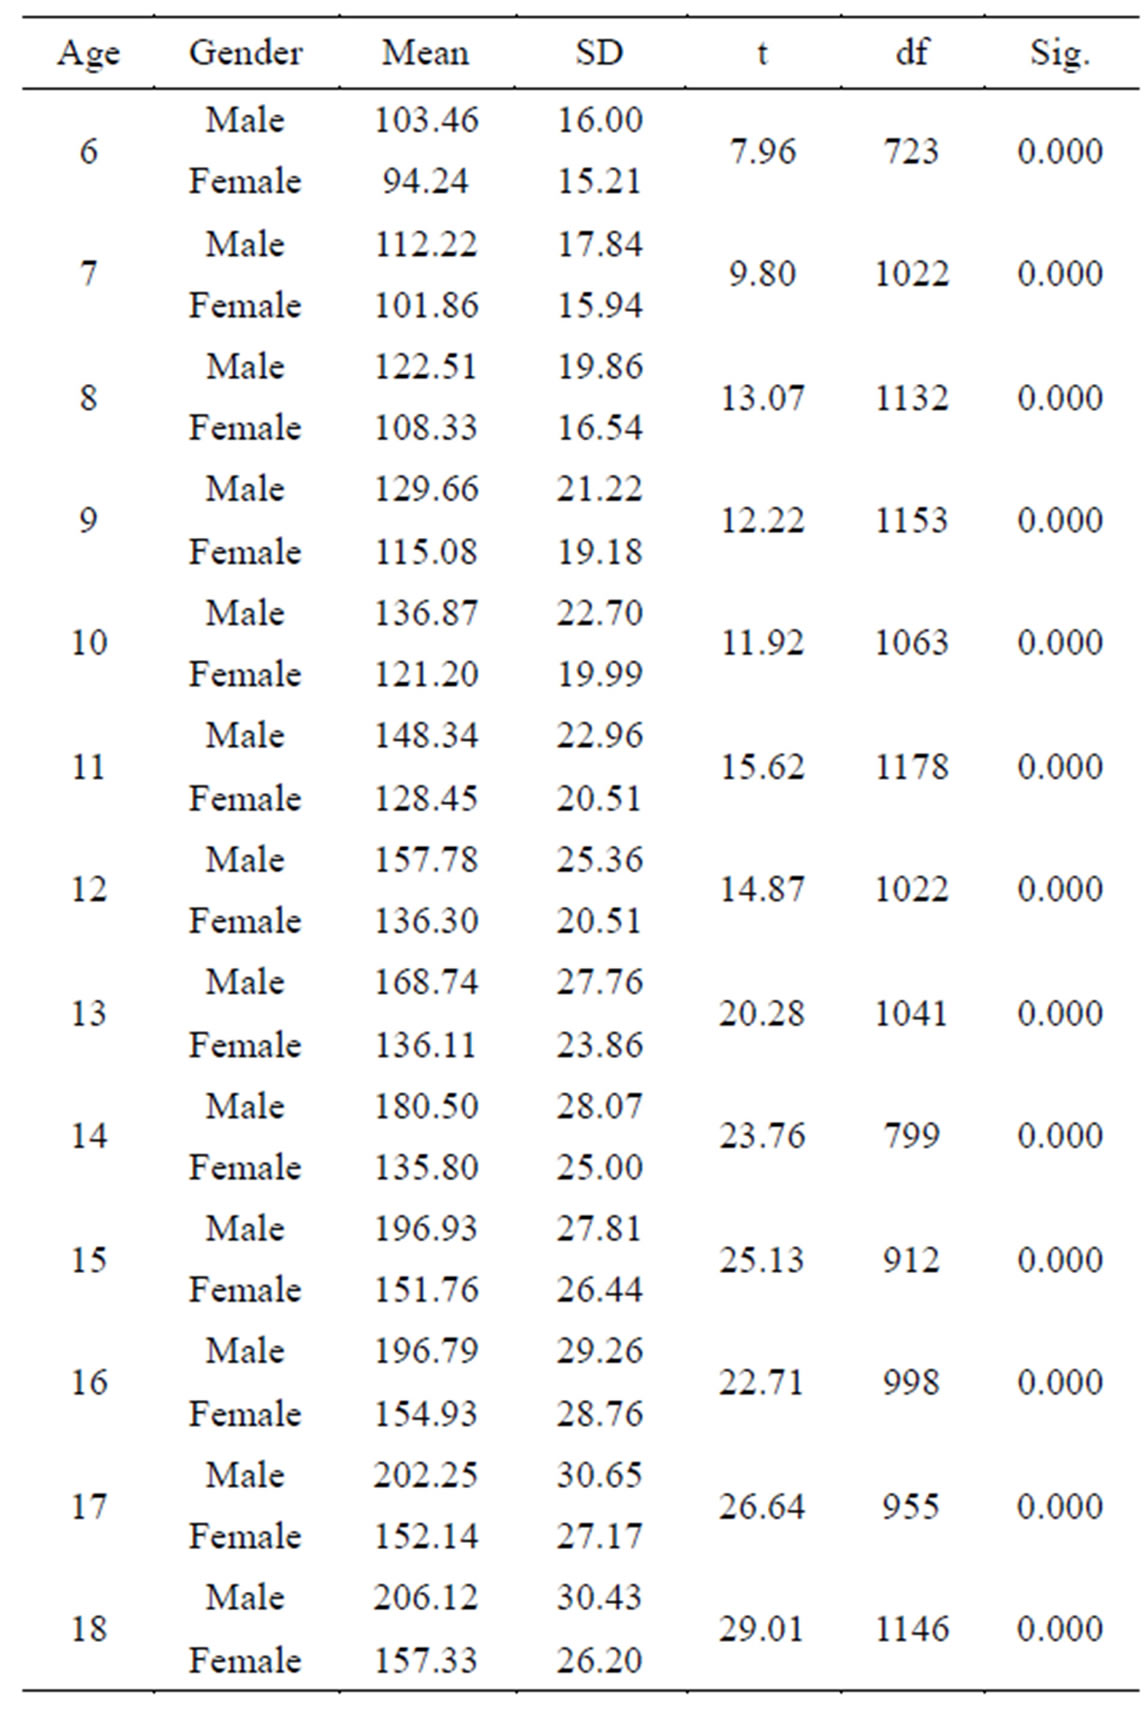
Table 2. Gender differences in standing long jump results by paired t-test.
The results obtained lead us to a conclusion that unlike girls, in all age categories boys show better results in the standing long jump fitness test. These differences become greater with increase of age. These differences are most expressed from 14 to 18 years (in average of boys jump 46.12 cm longer than girls), while the smallest differences can be seen in 6 and 7 year (in average boys jump 9.79 cm longer than girls).
The sex differences in the period of adolescence in combination with the effects from the endocrine adaptation (influence of gonadal steroid hormones and the growth hormone) typical for the sexual development, morphological differences, first of all in the body composition (in boys the contents of minerals in bones and muscle mass is increased, and fat depositing around the hips is decreased), functional differences and physical activity are the main factors for differences in the level of the muscle strength in the period of adolescence between boys and girls [33,34].
Still, there is an open question remaining—why are there differences in the standing long jump test in the early school age existing between boys and girls?
Most probably the reasons for these differences are rather conditioned by sociologic than by biological nature.
Boys in this period have more spontaneous and organized physical activity out of school, which makes the strength to be manifested on the basis of harmonization of movement or the improved coordination. In the course of development, the motor tasks are realized with participation of different mechanisms, thus, successful performance of a task means a complementary interaction of various abilities, and is not due to one skill only.
The increase of the muscle mass to the puberty is a consequence of the effect of the “insulin similar to the growth hormone 1-IGLF1” [35] which has equal effect both for the boys and girls, in the course and after the adolescence the increase of the muscle mass is a result of the effect of the testosterone hormone.
Based on the results obtained from our research we can conclude that the explosive power of the lower extremities in boys is linearly increased to 15th year, and after that shows oscillatory changes to 18th year. In girls the curve linear trend improves to 12th year, and after that shows oscillatory changes to 18th year. The average increase of the fitness test “standing long jump” in boys between 6th and 18th year is 8.55 cm, and in girls it is 5.26 cm.
In both sexes, the highest improvement of results from the test is noticed between the 14th and 15th year, when in average, the boys improve the test result for 16.43 cm, and the girls for 15.96 cm. In the boys the motor standing long jump test shows the biggest variability in 13th year, while in girls in 16th year.
The results from the regressive analysis lead to the conclusion that the constants in predicting the standing long jump are similar both in boys and girls. However, the age coefficient of boys is two times higher than in girls. In addition, the body mass index (BMI) too, as a factor, impacts the predicting of the standing long jump two times more in boys, which indicates that the body size in boys have inverse impact on the results from the standing long jump test in terms of the girls. Boys and girls in younger ages could possibly perform similarly if they were in similar BMI. But the performance difference could increase drastically studied in higher forms and this difference becomes broadened to overweight and obese boys and girls [36].
Results from previous researches [21,36-38] also indicate that boys have better muscular fitness in these age categories. Similar results have also been obtained in the comparative studies [39], in which boys achieve better results in the tests for assessment of the level of physical fitness in which the energetic component is predominant.
When making comparison of the international studies with the results obtained from our research one can con-
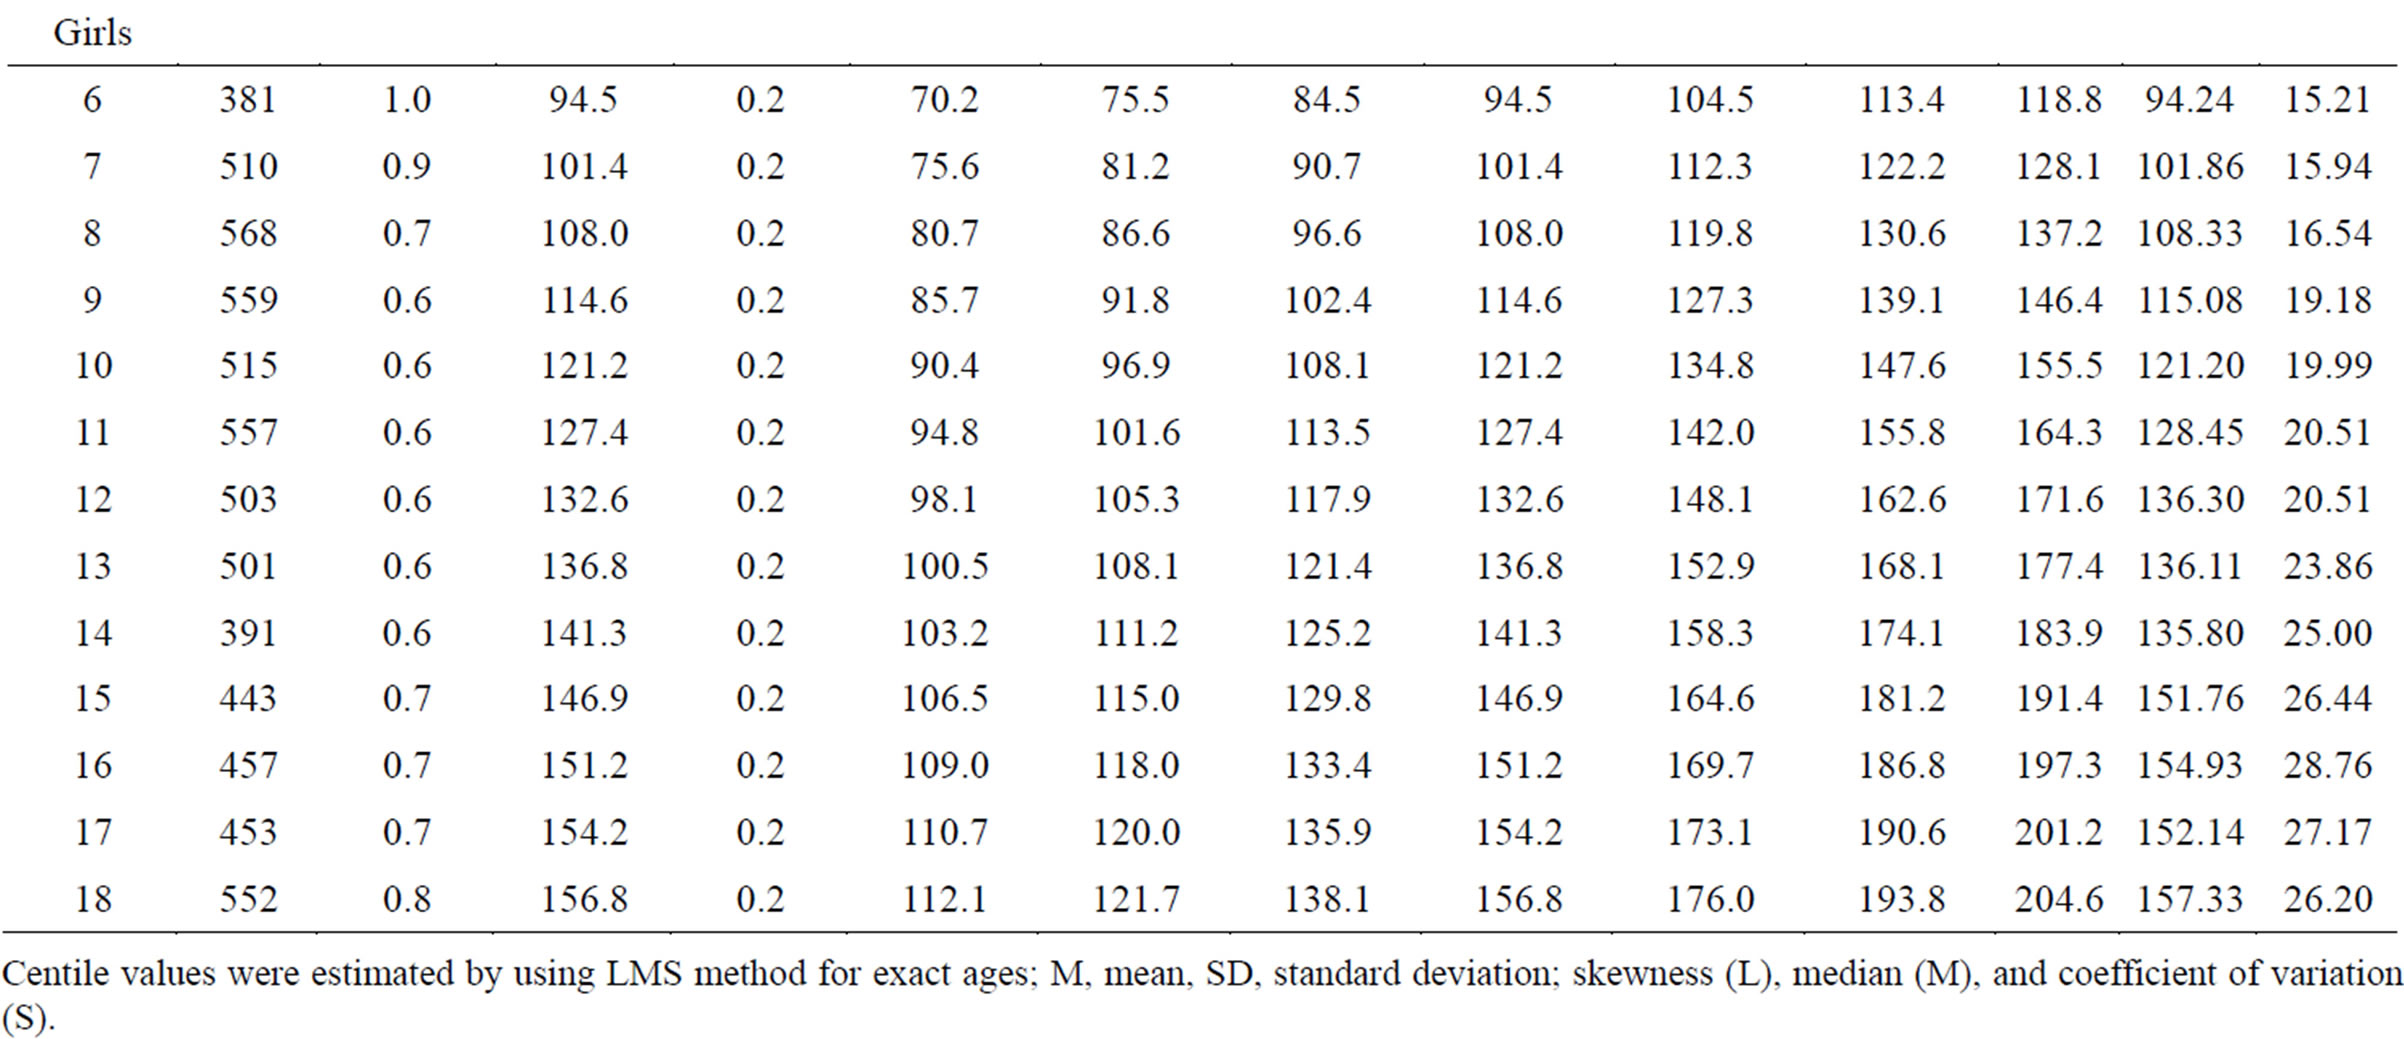
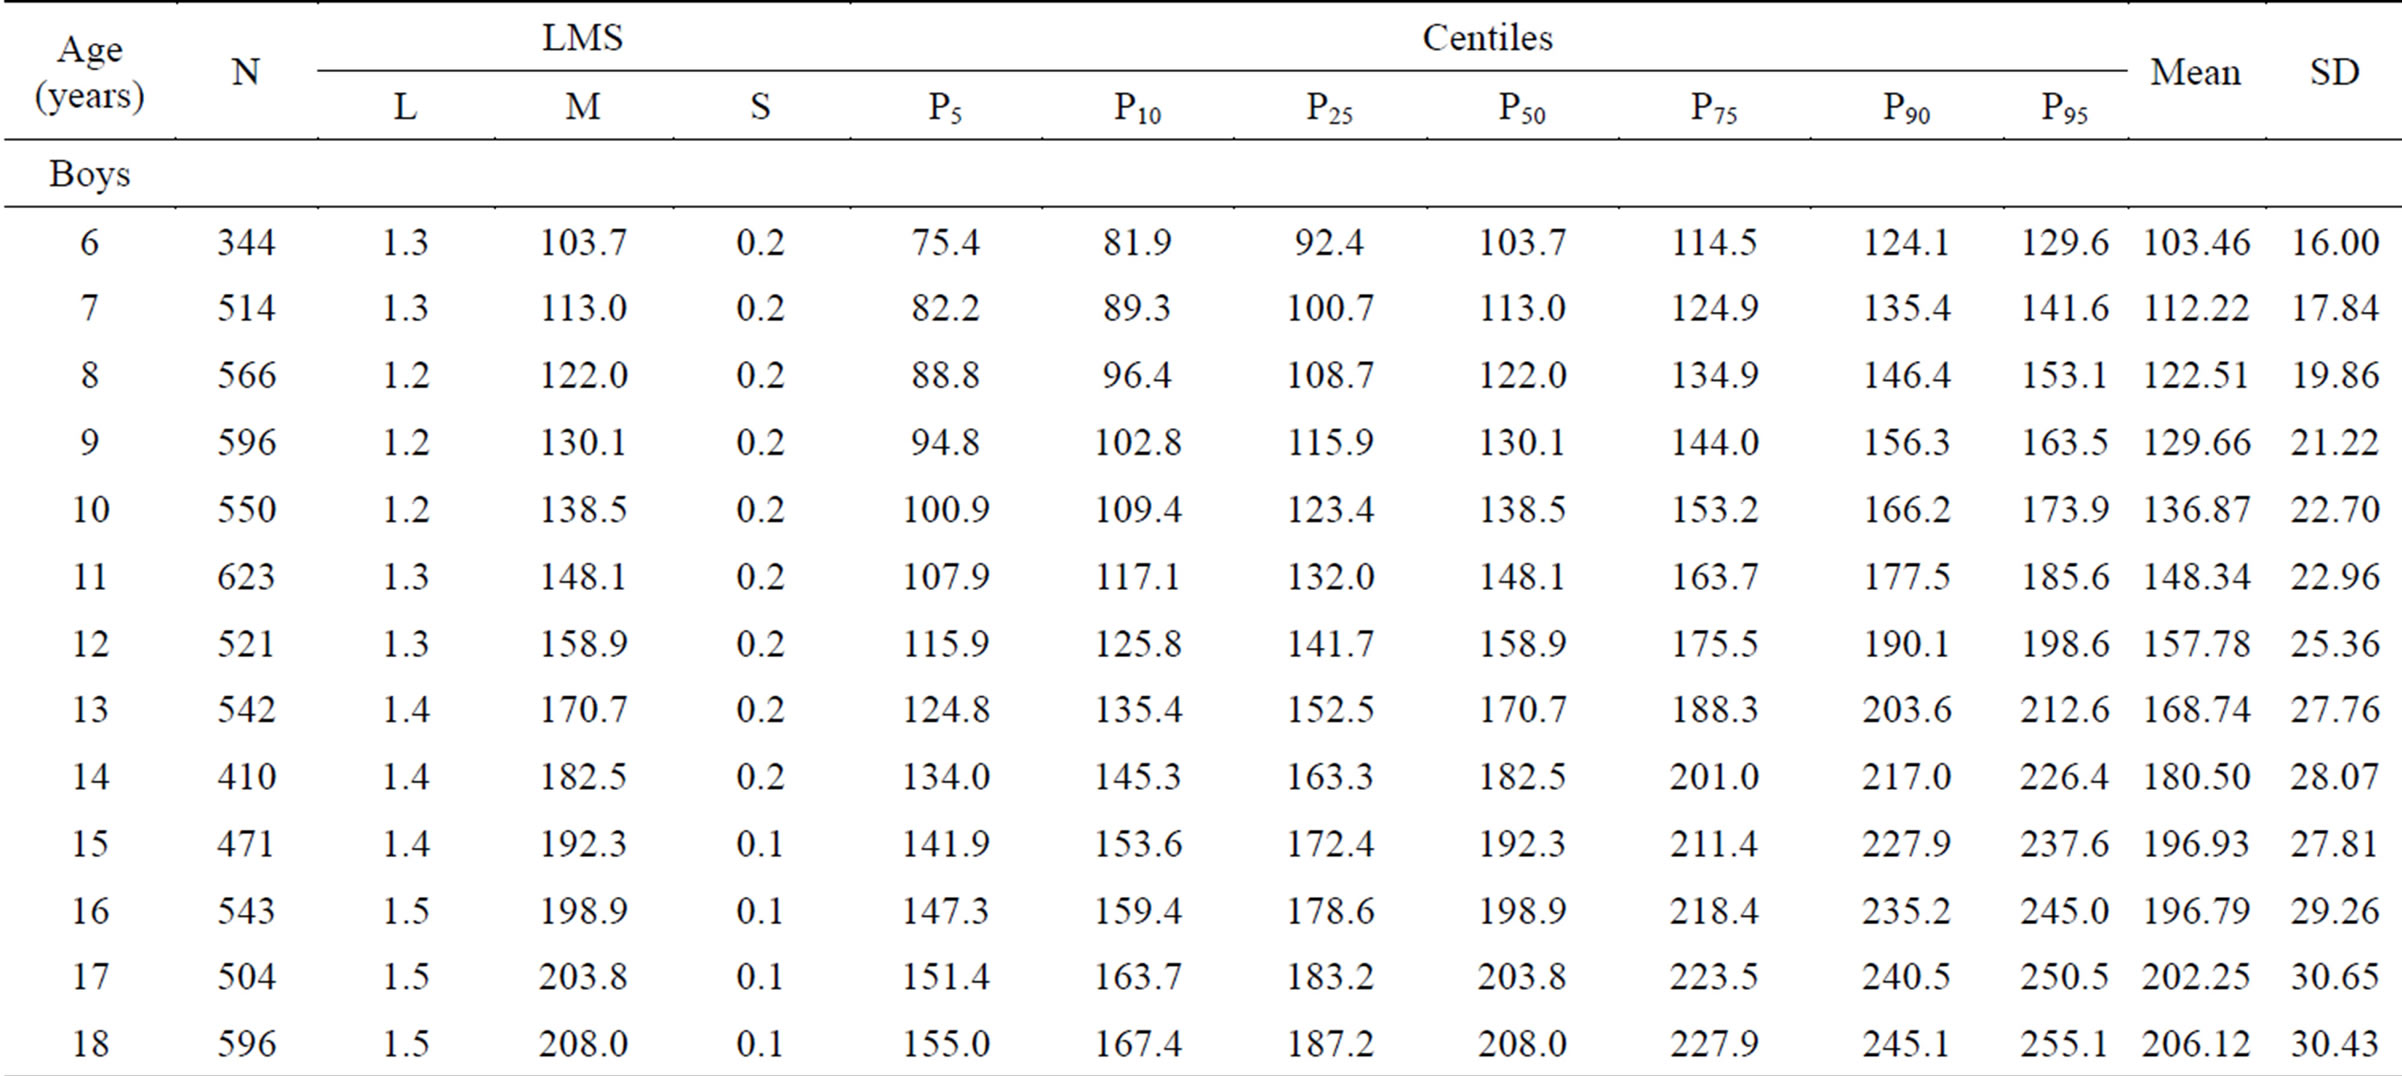
Table 3. Standing long jump (cm) percentile summary of Macedonian schoolchildren by age and gender.
Centile values were estimated by using LMS method for exact ages; M, mean, SD, standard deviation; skewness (L), median (M), and coefficient of variation (S).
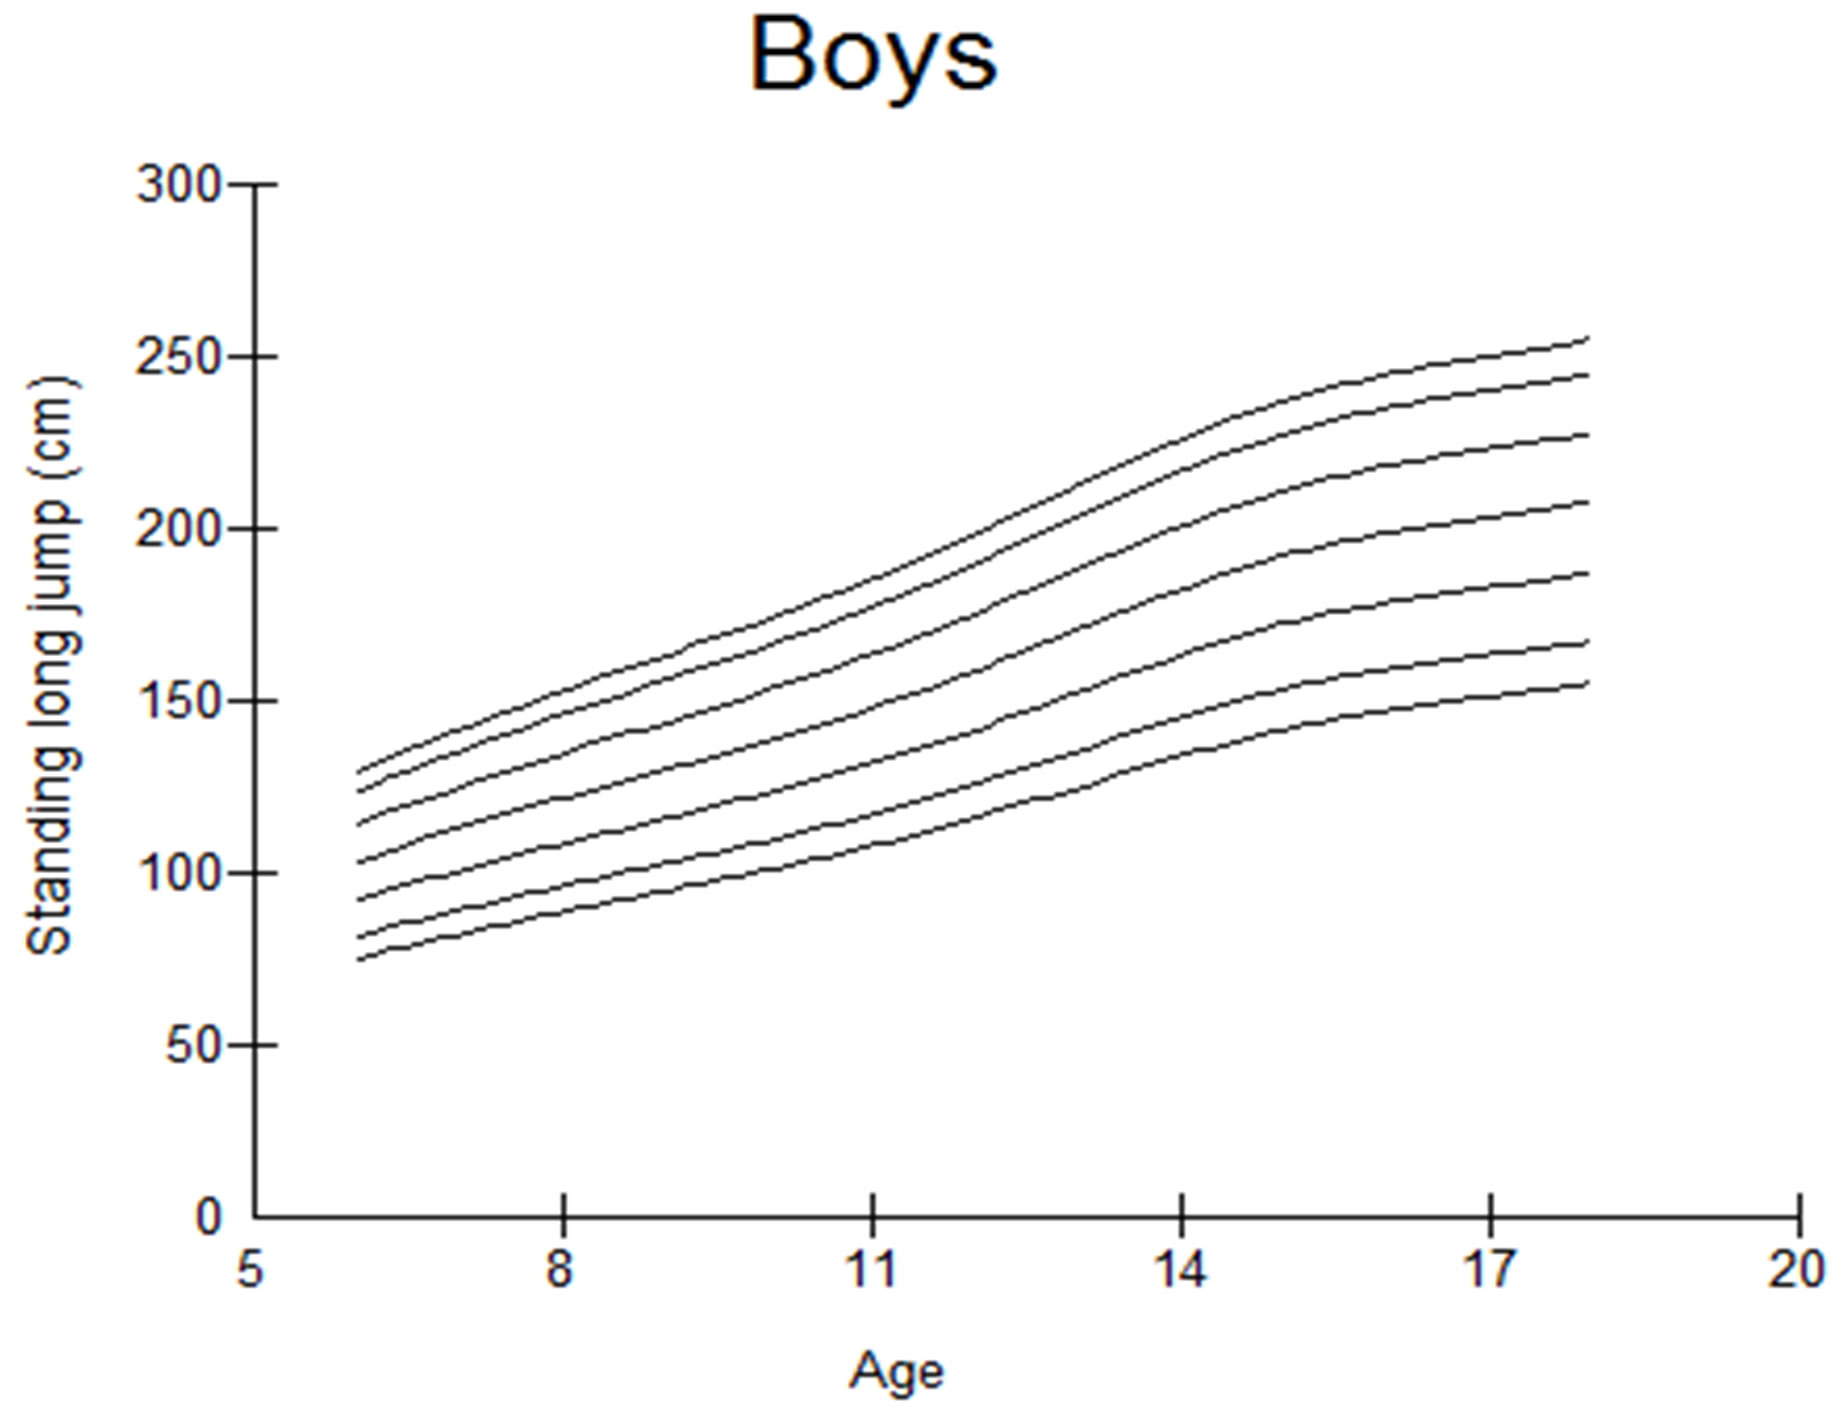
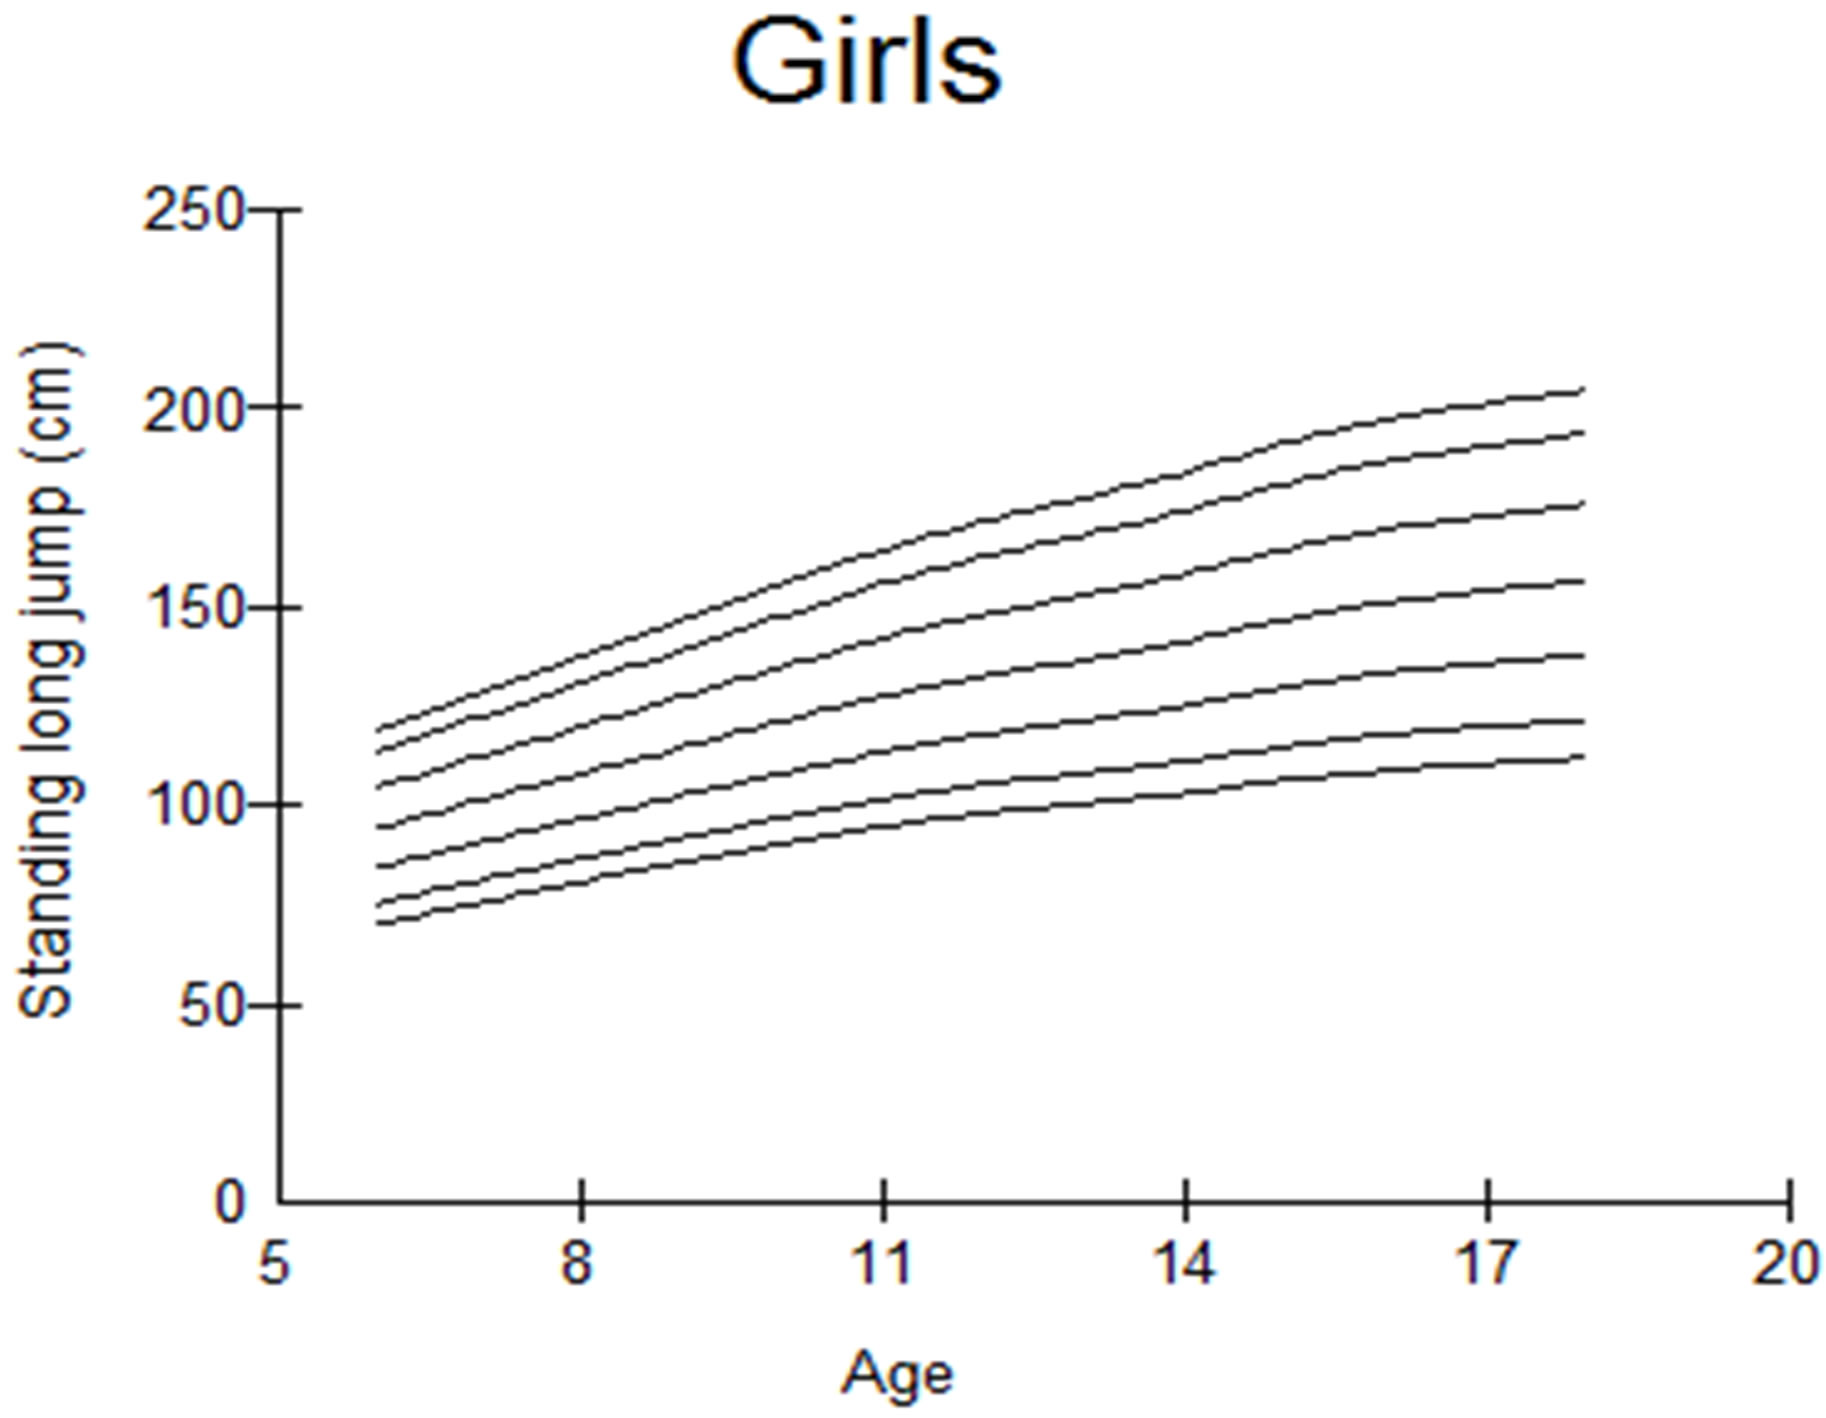
Figure 1. Smoothed (LMS method) centile curves (from the bottom to the top: P5, P10, P25, P50, P75, P80, P95) of physical fitness test standing long jump for the total cases by gender.
clude that school children of both sexes from Macedonia in average achieve lower results in the standing long jump test at the age of 8 to 11, and better results at the age of 12 to 18 years compared to scholars from Hong Kong [36]. School children of both sexes at the age of 13 to 17 years achieve similar results in the standing long jump test in terms of the previous researches realized on adolescents from Spain covered by the AVENA study (“Alimentación y Valoración del Estado Nutricional de los Adolescentes”) [37]. Macedonian boys at the age of 13 and 14 in average achieve better results, and boys at the age of 15 to 18 years achieve similar results in the standing long jump test compared to the European compeers of male sex measured in the HELENA study (“The Healthy Lifestyle in Europe by Nutrition in Adolescence”) [38]. On the other side, Macedonian girls of 13 and 14 years achieve lower results, and of 15 to 18 years achieve better results in the standing long jump test compared to the European adolescent of female sex, measured in the HELENA study.
The legitimacies in the development of the level of the muscle strength assessed through the standing long jump test are in accordance with the laws of growth and development [36-38,40-42]. The level of the muscle strength in the course of the analyzed years has constantly been following the growth curve.
Normative values can be used for different purposes. On population basis, the lowest percentile, such as 0.5, can be used as a “warning signal” and it would be necessary to make additional test and researches for the respondents having results under this percentile in order to identify possible reasons and the cormobidity. The respondents having achieved results below these percentile values may have genetic mutations that do not lead to a disease by themselves, but make them non-tolerant to exercising (e.g. decreased muscle AMP deaminase. Due to S34T mutation of the AMPD1 gene) [43].
Normative values shown from 5 to 95 percentlies allow the children and the youth to determine the individual level of the muscular strength (what is the percent of better or lower output) on a scale from 1 to 7. Results may also be categorized in five categories by means of the Likert-type of measuring: very low, low, average, over the average and high. This is especially useful when the assessment is made for the health or education purposes, for early detection of problems. It allows undertaking of appropriate activity for an individual or certain group and monitoring the respondent in the percentile category [44].
Why is the explosive power of lower extremities important for the young population? The researches indicate that jumping and the speed are connected with larger bone mass in the joints of the hip and the lumbar part of the spine [45,46]. Results from the AVENA study indicate the negative connection between jumping and the amount of cholesterol in male adolescents with increased body mass [47].
5. CONCLUSION
This study publishes the normative reference values for assessment of the level of the muscular strength through the standing long jump test conducted on a large sample of Macedonian school children. Normative values cover a wide span of years (6 - 18). The normative values obtained will allow proper assessment and interpretation of the level of the muscular strength in Macedonian school children. The level of the muscular strength is firmly connected with the current and future health condition. The fifth percentile obtained in this research can be used as a biological indicator. Values obtained from the test below this percentile are considered as pathological conditions. This tool is especially useful in the health and educational circles. From practical aspect, such tests of the physical fitness should be realized in all schools in the Republic of Macedonia, and the teachers in physical education should play the key role in identifying the adolescents with low level of physical fitness, as well as to identify the talented pupils. Normative values should not be used to encourage the competition between the scholars. Instead, they should allow accurate detection of individual progress of an individual (e.g. from 40th to 60th percentile). This study also explains the influence of age and body mass index (BMI) on the successful performance of the standing long jump test as well as the influence of the gender differences in successful performance of the standing long jump test. The results obtained from this study should be taken into consideration in planning, programming and realization of the teaching of physical culture by teachers.
ACKNOWLEDGEMENTS
We hereby express out great gratitude to the children and adolescents who took part in this study, as well as to their parents and teachers for their cooperation. Special gratitude to the councils of the municipality of Strumica, Kisela Voda and to the Faculty of Physical Culture in Skopje which provided funds for realization of this study.
REFERENCES
- Andersen, L.B., Harro, M., Sardinha L.B., Froberg, K., Ekelund, U., Brage, S., et al. (2006) Physical activity and clustered cardiovascular risk in children: A cross-sectional study (The European Youth Heart Study). Lancet, 368, 299-304. http://dx.doi.org/10.1016/S0140-6736(06)69075-2
- Myers, J., Prakash, M., Froelicher, V., Do, D., Partington, S. and Atwood, J.E. (2002) Exercise capacity and mortality among men referred for exercise testing. New England Journal of Medicine, 346, 793-801. http://dx.doi.org/10.1056/NEJMoa011858
- Sallis, J.F., Patterson, T.L., Buono, M.J. and Nader, P.R. (1988) Relation of cardiovascular fitness and physical activity to cardiovascular disease risk factors in children and adults. American Journal of Epidemiology, 127, 933- 941.
- Ruiz, J.R., Rizzo, N.S., Hurtig-Wennlof, A., Ortega, F.B., Wamberg, J. and Sjostrom, M. (2006) Relations of total physical activity and intensity to fitness and fatness in children; The European Youth Heart Study. American Journal of Clinical Nutrition, 84, 298-302.
- Gutin, B., Barbeau, P., Litaker, M.S., et al. (2000) Heart rate variability in obese children: Relations to total body and visceral adiposity, and changes with physical training and detraining. Obesity Research, 8, 12-9. http://dx.doi.org/10.1038/oby.2000.3
- Brunet, M., Chaput, J.P. and Tremblay, A. (2006) The association between low physical fitness and high body mass index or waist circumference is increasing with age in children: The “Quebec en Forme” Project. International Journal of Obesity (Lond).
- Mesa, J.L., Ruiz, J.R., Ortega, F.B., Wamberg, J., Gonzalez-Lamuno, D., Moreno, L.A., et al (2006) Aerobic physical fitness in relation to blood lipids and fasting glycaemia in adolescents: Influence of weight status. Nutrition, Metabolism & Cardiovascular Diseases, 16, 285- 293. http://dx.doi.org/10.1016/j.numecd.2006.02.003
- Gulati, M., Pandey, D.K., Arnsdorf, M.F., Lauderdale, D.S., Thisted, R.A., Wicklund RH, et al. (2003) Exercise capacity and the risk of death in women: The St James Women Take Heart Project. Circulation, 108, 1554-1559. http://dx.doi.org/10.1161/01.CIR.0000091080.57509.E9
- Brage, S., Wedderkopp, N., Ekelund, U., Franks, P.W., Wareham, N.J., Andersen, L.B., et al. (2004) Features of the metabolic syndrome are associated with objectively measured physical activity and fitness in Danish children: The European Youth Heart Study (EYHS). Diabetes Care, 27, 2141-2148. http://dx.doi.org/10.2337/diacare.27.9.2141
- Ruiz, J.R., Ortega, F.B., Rizzo, N.S., Villa, I., HurtigWennlof, A., Oja, L., et al. (2007) High cardiovascular fitness is associated with low metabolic risk score in children: The European youth heart study. Pediatric Research, 61, 350-355. http://dx.doi.org/10.1203/pdr.0b013e318030d1bd
- Paineau, D., Chiheb, S., Banu, I., Valensi, P., Fontan, J.E., Gaudelus, J., Chapalain, V., Chumlea, C., Bornet, F. and Boulier, A. (2008) Comparison of field methods to estimate fat mass in children. Annals of Human Biology, 35, 185-197. http://dx.doi.org/10.1080/03014460801914874
- Rodriguez, G., Moreno, L.A., Blay, M.G., Blay, V.A., Fleta, J., Sarria, A. and Bueno, M. (2005) Body fat measurement in adolescents: Comparison of skinfold thickness equations with dualenergy X-ray absorptiometry. European Journal of Clinical Nutrition, 59, 1158-1166. http://dx.doi.org/10.1038/sj.ejcn.1602226
- Ruiz, J.R., Ramirez-Lechuga, J., Ortega, F.B., CastroPinero, J., Benitez, J.M., Arauzo-Azofra, A., Sanchez, C., Sjostrom, M., Castillo, M.J., Gutierrez, A. and Zabala, M. (2008) Art ificial neural network-based equation for estimating VO 2max from the 20 m shuttle run test in adolescents. Artificial Intelligence in Medicine, 44, 233-245. http://dx.doi.org/10.1016/j.artmed.2008.06.004
- Artero, E.G., et al (2012) Criterion-related validity of fieldbased muscular fitness tests in youth. Journal of Sport Medicine and Physical Fitness, 52, 263-272.
- Ruiz, J.R., Castro-Piñero, J., España-Romero, V., Artero, E.G., Ortega, F.B., Cuenca, M.M., et al. (2011). Fieldbased fitness assessment in young people: The ALPHA health-related fitness test battery for children and adolescents. British Journal of Sports Medicine, 45, 518-524. http://dx.doi.org/10.1136/bjsm.2010.075341
- Castro-Piñero, J., Artero, E.G., España-Romero, V., Ortega, F.B., Sjöström, M., Suni, J., et al. (2010) Criterionrelated validity of field-based fitness tests in youth: A systematic review. British Journal of Sports Medicine, 44, 934-943. http://dx.doi.org/10.1136/bjsm.2009.058321
- Corbin, C.B. and Pangrazi, R.P. (2008) Introduction to FITNESSGRAM. In: Welk, G.J. and Meredith, M.D., Eds., FITNESSGRAM/Activitygram Reference Guide (Internet Resource). The Cooper Institute, Dallas.
- Council of Europe. Committee for the Development of Sport (1988) EUROFIT: Handbook for the EUROFIT tests of physical fitness. Italian National Olympic Committee, Rome.
- Dumith, S.C., et al. (2012) Physical fitness measures among children and adolescents: Are they all necessary? Journal of Sport Medicine and Physical Fitness, 52, 181- 189.
- Castro-Pinero, J., et al. (2010) Assessing muscular strength in youth: Usefulness of standing long jump as a general index of muscular fitness. Journal of Strength & Conditioning Research, 24, 1810-1817. http://dx.doi.org/10.1519/JSC.0b013e3181ddb03d
- Kurelić, N., Momirović, K., Stojanović, M., Šturm, J., Radojević, Đ. and Viskić-Štalec, N. (1975) The structure and development of the morphological and motor dimensions of the young. Beograd: Institut za naučna istraživanja Fakulteta za fizičko vaspitanje Beograd.
- Mood, D.P., Jackson A.W. and Morrow, J.R. (2007) Measurement of physical fitness and physical activity: Fifty years of change. Measurement in Physical Education and Exercise Science, 11, 217-222. http://dx.doi.org/10.1080/10913670701585502
- Freedson, P.S. and Miller, K. (2000) Objective monitoring of physical activity using motion sensors and heart rate. Research Quarterly for Exercise and Sport, 71, S21- S29.
- Morrow, J.R. and Ede, A. (2009) Research quarterly for exercise and sport lecture statewide physical fitness testing: A BIG waist or a BIG waste? Resеаrch Quarterly of Exercise and Sport, 80, 696-701.
- Mahar, M.T. and Rowe, D.A. (2008) Pracitcal guidelines for valid and reliable youth fitness testing. Measurement in Physical Education and Exercise Science, 12, 126-145. http://dx.doi.org/10.1080/10913670802216106
- Harris, J. and Cale, L. (2006) A review of children’s fitness testing. European Physical Education Review, 12, 201-225. http://dx.doi.org/10.1177/1356336X06065359
- Keating, X.D. and Silverman, S. (2004) Teachers’ use of fitness tests in school-based physical education programs. Measurement in Physical Education and Exercise Science, 8, 145-165. http://dx.doi.org/10.1207/s15327841mpee0803_2
- Lohman, T.G., Roche, A.F. and Martorell, R. (1988) Anthropometric standardization reference manual. Human Kinetics Books, Chicago.
- Cole, T.J., Freeman, J.V. and Preece, M.A. (1998) British 1990 growth reference centiles for weight, height, body mass index and head circumference fitted by maximum penalized likelihood. Statistics in Medicine, 17, 407-429. http://dx.doi.org/10.1002/(SICI)1097-0258(19980228)17:4<407::AID-SIM742>3.0.CO;2-L
- Cole, T.J. and Green, P.J. (1992) Smoothing reference centile curves: The LMS method and penalized likelihood. Statistics in Medicine, 11, 1305-1319. http://dx.doi.org/10.1002/sim.4780111005
- Ortega, F.B., Ruiz, J.R., Hurtig-Wennlöf, A., et al. (2008) [Physically active adolescents are more likely to have a healthier cardiovascular fitness level independently of their adiposity status. The European youth heart study]. Revista Española de Cardiología, 61, 123-129. http://dx.doi.org/10.1157/13116199
- Ruiz, J.R., Castro-Piñero, J., Artero, E.G., et al. (2009) Predictive validity of health related fitness in youth: A systematic review. British Journal of Sports Medicine, 43, 909-923. http://dx.doi.org/10.1136/bjsm.2008.056499
- Bonjour, J., et al. (1991) Critical years and stages of puberty for spinal and femoral bone mass accumulation during adolescence. Journal of Clinical Endocrinology & Metabolism, 73, 555-563. http://dx.doi.org/10.1210/jcem-73-3-555
- Rogol, A.D., et al. (2002) Growth at puberty. Journal of Adolescent Health, 31, 192-200. http://dx.doi.org/10.1016/S1054-139X(02)00485-8
- Israel, S. (1991) Age related change in strenght and special group. Strength and Power in Sport (pp. 319-328) Blackwell, Boston.
- Chung, L., Chow, L. and Chung, J. (2013) Normative reference of standing long jump indicates gender difference in lower muscular strength of pubertal growth. Health, 5, 6-11. http://dx.doi.org/10.4236/health.2013.56A3002
- Ortega, F.B., Ruiz, J.R., Castillo, M.J., et al. (2005) Grupo AVENA. [Low level of physical ftness in Spanish adolescents. Relevance for future cardiovascular health (AVENA study)]. Revista Española de Cardiología, 58, 898-909. http://dx.doi.org/10.1157/13078126
- Ortega, F.B., Artero, E.G., Ruiz, J.R, España-Romero, V., Jiménez-Pavón, D., et al., HELENA study (2010) Physical fitness levels among European adolescents: The HELENA study. British Journal of Sports Medicine, 45, 20- 29.
- Strel, J., Kovač, M., Rogelj, A., Leskošek, B., Jurak,G., Starc, G. and Majerič, Kolenc, M. (2003) Evaluation of monitoring the movement and physical development of children and youth in the school year 2001-2002 and a comparison of some parameters of the physical education report cards in the school year 2000-2001 and the period 1990-2000, Zavod za šport, Slovenije, Ljubljana.
- Starc, G., Strel, J. and Kovač, M. (2010) Physical and motor development of Slovenian young people in numbers. School year 2007/2008. Faculty of Sport, Ljubljana.
- Popović, B. (2008) Development trend of anthropometric characteristics of 4-11 years old children. Glasnik Antropološkog Društva Srbije, 43, 455-465.
- Gontarev, S., Zivkovic, V. and Markovski, N. (2012) Developmental changes in explosive forces instudents of both sexes between the ages of 6 to 14 years. Research in the Physical Education, Sport and Health, 1, 51-57.
- Rico-Sanz, J., Rankinen. T., Joanisse, D.R., et al. (2003) HERITAGE family study. Associations between cardiorespiratory responses to exercise and the C34T AMPD1 gene polymorphism in the HERITAGE family study. Physiol Genomics, 14, 161-166.
- Manios, Y., Kafatos, A. and Mamalakis G. (1998) The effects of a health education intervention initiated at first grade over a 3 year period: Physical activity and fitness indices. Health Education Research, 13, 593-606. http://dx.doi.org/10.1093/her/13.4.593
- Vicente-Rodriguez, G., Ara, I., Perez-Gomez, J., SerranoSanchez, J.A., Dorado, C. and Calbet, J.A. (2004) High femoral bone mineral density accretion in prepubertal soccer players. Medicine & Science in Sports & Exercise, 36, 1789-1795. http://dx.doi.org/10.1249/01.MSS.0000142311.75866.D7
- Vicente-Rodriguez, G., Dorado, C., Perez-Gomez, J., Gonzalez-Henriquez, J.J. and Calbet J.A. (2004) Enhanced bone mass and physical fitness in young female handball players. Bone, 35, 1208-1215. http://dx.doi.org/10.1016/j.bone.2004.06.012
- Ortega, F.B., Ruiz, J.R., Gutiérrez, A., Moreno, L.A., Tresaco, B., Martínez, J.A., González-Lamuño, D., Wärnberg, J., Castillo, M.J. and the AVENA Study Group (2004) Is physical fitness a good predictor of cardiovascular disease risk factors in normal-weight andoverweight or obese adolescents? The AVENA Study. International Journal of Obesity and Related Metabolic Disorders, 28, S120.