Health
Vol.5 No.8(2013), Article ID:35555,10 pages DOI:10.4236/health.2013.58177
Causal relationships between survival rates, dietary and lifestyle habits, socioeconomic status and physical, mental and social health in elderly urban dwellers in Japan: A chronological study
![]()
1Graduate School of Urban System Science, Tokyo Metropolitan University, Tokyo, Japan
2Graduate School of Medicine, Juntendo University, Tokyo, Japan; *Corresponding Author: shinyashishvarghese@gmail.com
3Graduate School of Nursing, Ibaraki Church University, Ibaraki, Japan
4School of Nursing, Tokyo Jikeikai Medical College, Tokyo, Japan
5Department of Health Promotion, Tokyo Metropolitan Institute of Gerontology, Tokyo, Japan
Copyright © 2013 Tanji Hoshi et al. This is an open access article distributed under the Creative Commons Attribution License, which permits unrestricted use, distribution, and reproduction in any medium, provided the original work is properly cited.
Received 30 March 2013; revised 1 May 2013; accepted 15 June 2013
Keywords: Survival Rate; Food Habits; Life Style; Socioeconomic Status; Aged; Japan
ABSTRACT
Life expectancy was well known to associate with lifestyle habits, socioeconomic condition, and three health-related dimensions (physical, mental and social health status). However, the causal effect relationship among these variables remains unclear. The purpose of this study was to determine the causal relationships among health and life conditions, socioeconomic status, dietary and lifestyle habits and three health-related dimensions in elderly urban dwellers in Tokyo, Japan. Of 16,462 eligible elderly individuals aged 65 years and older, 13,195 participants responded to the questionnaire survey conducted in September 2001 (a response rate of 80.2%). A follow-up survey was conducted in September 2004 and a total of 8162 survivors were followed until the end of August 2007 through the municipal resident's registry. Exploratory factor analysis defined five latent variables based on the 13 observed variables. From a cross-lagged effects variation model using structural equation modeling, causal relationships were analyzed using longitudinal data obtained at the 2001 and 2004 survey and the number of survival days between 2004 and 2007. After estimating a best-fit model, we discovered that health and life conditions were not deter- mined by current dietary and lifestyle habits, which many studies showed. However, the conditions were more directly affected by three health-related dimensions three years earlier, and indirectly affected by educational attainment and previous annual income as well. The current model suggests that it might be of great importance for elderly individuals to emphasize the maintenance of psychological well being, physical activity, social communication and participation, as well as income, rather than focusing on improvements in diet and health-related lifestyles per se.
1. INTRODUCTION
The long life expectancy at birth of Japanese individuals is well known around the world [1]. Many studies have previously investigated what determines Japanese longevity [2,3]. Recently, growing attention has been paid to the potential determinants of health and remaining life expectancy, in particular among elderly Japanese individuals. However, most of these studies were performed using cross-sectional and ecological data [4,5]. As such, it was quite difficult to analyze causal effects on individual elderly health conditions over the life span due to the limitations posed by cross cutting and the ecological fallacy. Thus, despite such efforts, causal associations regarding lifestyle determinants of elderly health remain unclear.
Ever since the Lalonde report [6] and the USA Healthy People strategy [7] initially addressed the importance of diet and health-related behaviors on life expectancy, numerous studies had described the effects of specific lifestyles on health [8,9]. Favorable lifestyles produced a reduction in premature mortality among people with particular diseases and lifestyles [10,11]. In a large cohort of Japanese people, Tamakoshi et al. [12] demonstrated a significant impact of lifestyle on life expectancy. Whether such productive and beneficial studies can be conducted using data related to the elderly and employing causal analyses is unknown.
There have been some reports highlighting the influence of socioeconomic status on life expectancy. Socioeconomic differences were significantly related to both life expectancy [13,14] and total healthy life years in the elderly [15]. Sugiura et al. [16] reported that socioeconomic status accounted for a rapid increase in Japanese life expectancy after the Second World War. Reviewing the impact of Japanese socioeconomic positions on health, Kagamimori et al. [17] also concluded that these differences in mortality and morbidity were not trivial. However, a direct causal relationship between socioeconomic conditions and life expectancy has not been demonstrated.
The World Health Organization (WHO) defined health as a state of complete physical, mental and social well being and not merely the absence of disease or infirmity [18]. Based on this definition, three health-related dimensions, namely physical, mental and social well being, are hypothesized to be associated with life expectancy. Physical activity and functioning [19,20], mental vulnerability and self-rated health [21,22] and social ties [23,24] are significantly associated with remaining years of life in the elderly. With the exception of a few studies [25], however, there is an incomplete understanding of the relationships between life expectancy and indicators associated with the three aforementioned health-related dimensions.
Therefore, the objectives of our study were to clarify the causal relationships among healthy dietary and lifestyle habits, socioeconomic status and three health-related dimensions related to health and life conditions (including survival) among the Japanese elderly urban dwellers.
2. METHODS
2.1. Participants and Study Setting
In September 2001, we targeted a questionnaire survey to all elderly individuals (aged 65 years and over) who lived at home in suburban Tokyo, Japan. Of 16,462 eligible elderly individuals, 13,195 people (80.2% as a respondent percentage) gave informed consent to participate in the study and returned the self-administered questionnaire by mail. In September 2004, we sent via mail a second questionnaire (the same as used previously) to the respondents, and 8558 participants responded (505 cases had moved, 914 were deceased and 3218 did not respond). The inclusion criterion was all elderly dwelling in their home aged 65 years or more. We followed up all of the participants until August 31, 2007, and ultimately obtained individual data, deceased or living, for a total of 8162 participants through the municipal resident’s registry.
The city used as the study setting had developed partly as a commuter town to accommodate increased workers and their families in the metropolitan Tokyo area between the period of the 1970s and 1990s, which included a recent era of high Japanese economic growth. The majority of dwellers were middle class. The total population of the city was approximately 140,000 as of 2001 with 9.6 per cent of the population aged 65 years or older. This number was nearly half of the national average in 2000 (17.3%).
2.2. Observed Measurement Variables
The current study aimed to examine the causal relationships among health and life conditions, socioeconomic status, healthy dietary and lifestyle habits, and three health-related dimensions.
Health and life conditions in 2004 were dependent endogenous latent variables, including the number of survival days between September 1, 2004 and August 1, 2007 and the degree of long-term health care. The degree of health care was used in order to detect elderly health conditions in September 2004 using a public assessment tool devised by the Japanese Ministry of Health, Labor and Welfare. This tool is comprised of six levels ranging from the lightest degree (requiring mild support) to the most severe degree (requiring comprehensive care). In our analysis, a respondent that had received no care scored zero, while a respondent scored 1 if assigned at the lightest degree and scored 6 if assigned at the most severe degree.
Socioeconomic status in 2001 was assessed via educational attainment and annual income. Levels of educational attainment were categorized into four groups; graduation from junior high school, graduation from high school, those achieving a higher educational level than junior college and those who did not want to respond. Annual income levels fell into four categories; less than one million Japanese yen (equivalent to less than US $13,000), less than three million yen, less than seven million yen and more than seven million yen in 2001.
Healthy dietary and lifestyle habits in 2004 were assessed by the dietary health score and the healthy lifestyle score, respectively. The dietary health score was determined through the following three steps. First, food items consumed were assessed by the question; “Do you eat food items such as meat, soy products, eggs, bluebacked fish (sardine, mackerel and herring), dairy products, fruits, vegetables, salt-cured products, oily foods, strongly flavored foods, snacks and breakfast?” If the respondent consumed a particular food item, we then asked them to choose only one answer describing the frequency with which they consumed the food item as follows: eat everyday, eat 5 to 6 days per week, eat 3 to 4 days per week, eat 1 or 2 days per week or never eat. The frequency of item consumption per day was also measured (ranging from once to four times per day). Second, as being significantly and positively associated with number of survival days of the respondents examined at the end of August 2007, healthy dietary habits were defined. Our analyses resulted in a selection of ten healthy dietary habits as follows: consumption of meat, eggs, foods with eggs, and blue-backed fish 1 to 4 days a week, consumption of soy foods, dairy products, fruits and salt-cured products more than 3 days a week, consumption of vegetables more than 5 days a week and having breakfast everyday. Finally, a dietary health score was calculated as a score pertaining to the consumption of the ten identified healthy dietary food categories (one point for each category), ranging from 0 to 10, with a higher score indicating healthier dietary habits. Healthy lifestyle habits were assessed in terms of alcohol consumption, smoking, exercise habits, sleeping habits and body mass index (BMI). Such habit items were regarded as being healthy lifestyle habits when significantly associated with the number of survival days of the respondents as detected at the end of August 2007. As a result of our analyses, the habits significantly associated with number of survival days were alcohol consumption, never smoking (even in the past), less than nine hours of sleep per night, exercising more than once a week and having a BMI of more than 20. We scored these healthy lifestyle habits in a range from 0 to 5, with a higher score representing a healthier lifestyle.
The three health-related dimensions examined in our study consisted of physical, mental and social health components. Physical health parameters included the basic activities of daily living (BADL) and the instrumental activities of daily living (IADL) as well as the number of diagnosed diseases from which the respondents had suffered from at the time of the 2001 survey. The BADL score was assessed by three questions: “Can you go to the toilet by yourself?”, “Can you take a bath by yourself?” and “Can you take a walk outside?” [26]. Individuals obtained one point if they could perform these functions, and overall scores ranged from 0 to 3 with higher scores indicating a greater level of basic activity competence. The IADL score was measured via five questions related to instrumental activity: “Can you buy daily necessities by yourself?”, “Can you cook daily meals by yourself?”, “Can you deposit and withdraw money in a bank account?”, “Can you complete documents related to insurance and pensions?” and “Can you read books and newspapers?” [27]. As the IADL was scored in a similar fashion to the BADL, total scores ranged from 0 to 5 with higher scores indicating greater instrumental activity. The prevalence of comorbidity was determined by instructing the individuals to “Choose the diagnosed diseases with which you now are treated”. We discovered four diseases (cerebrovascular disease, cardiovascular disease, hepatic disease and diabetes mellitus) that were significantly and negatively associated with the number of survival days of the respondents between September 2004 and August 2007, and thus the extent of comorbidity was defined as the number of diseases with which the respondent was diagnosed among these four.
Mental health was determined via self-rated health, self-rated health compared with that of the previous year and daily life satisfaction at the time of the 2001 survey. Self-rated health was quantified via a four-point Likert scale using questions pertaining to the respondent’s perceived overall health: “In general, would you say your health is: very poor, poor, fair or excellent?” [28,29]. The score ranged from 1 to 4, with a higher score indicating higher perceived health. If unknown, we assigned a score of 0. Self-rated health compared to the previous year was determined on a three-point Likert scale with the question “How is your current health compared to your health at this time last year?” and the answer was chosen among the following responses: poorer, may or may not be better and better. In this respective order, scores of 1 to 3 were assigned and we assigned a score of 0 if the answer was unknown. Daily life satisfaction was detected by the question “Are you satisfied with your current daily life?” with answers ranging from not satisfied, may or may not be satisfied and satisfied. In this respective order, scores ranged from 1 to 3, and we assigned a score of zero if the answer was unknown.
Social health was measured by variables including the frequency of going outside, communication with the neighborhood and hobby-related activities. The frequency of going outside was examined by the question “How often do you go outside including around your neighborhood?” and answers ranged from less than once a month, more than once a month and more than 3 to 4 times a week. Scores ranged from 1 to 3 in this respecttive order. If the answer was unknown, a score of zero was assigned. Communication with the neighborhood was assessed by asking “How often do you have communication with your friends or neighbors?” and scores ranged from seldom, once a month, 3 to 4 times a week and almost everyday, using a scale ranging from 1 to 4 in respective order and zero if unknown. We measured hobby-related activities by inquiring “Do you participate in hobby-related activities?” with two possible answers (yes and no). Scores were assigned as 1 (no hobby), 2 (presence of a hobby) and 0 (unknown).
2.3. Analyses
Respondents aged 80 years and older and those associated with more than a middle degree of long-term care at the 2001 survey were excluded in the analyses due to an increased and indispensable deviation in their measurement variables. All data obtained were evaluated by score or degree to examine differences between males and females using the Kendall’s tau rank correlation coefficient. Exploratory factor analysis was used to fit all of the observed variables to corresponding latent variables. This analysis was performed by the maximum likelihood procedure and a Promax oblique rotation, using IBM SPSS Statistics 21 for Windows (IBM Inc., New York, USA).
We used structural equation modeling (SEM) to examine presumptive underlying causal relationships between the latent variables by Amos ver.19 for Windows (IBM Inc.). The analyses were performed using a crosslagged effects variation model with longitudinal data followed over seven years. Four latent variables were fitted with socioeconomic status and three health-related dimensions as causes using data obtained in the 2001 survey, healthy dietary and lifestyle habits as intermediate causes using data from the 2004 survey, and health and life conditions as outcomes by using data at the 2004 survey and data between 2004 and 2007. All observed variables corresponding to the three health-related dimensions were collected at the questionnaire survey in September 2001. Estimation of the best-fitting model was carried out by the method of maximum likelihood of SEM. The optimization algorithm was implemented with no-missing-data parameters. The direct, indirect and total standardized effects of different latent variables on the endogenous health and life condition variable were measured by gender. The models employed indices criteria for assessing model fitness. Goodness-of-fit was approved by CMIN, NFI, IFI and RMSEA. Results were regarded as statistically significant if the p value was less than 0.05.
3. RESULTS
3.1. Measurement Variables
Of 8162 eligible participants, included in the analysis were 7066 individuals (male, 3409; female, 3657) aged more than 80 years and with either no long-term care or the mildest degree of long-term care utilized in September 2001. The average ages (±standard deviation) of males and females were 70.0 ± 3.9 and 70.5 ± 4.2 years, respectively. Table 1 shows the frequencies of measured variables by gender. The mean number of survival days between September 1, 2004 and August 31, 2007 was fewer in males than in females. 2.3 per cent of male and 3.0 per cent of female participants had degenerated to either the middle or severest degrees of long-term care in 2004 compared to 2001. Compared with males, females displayed significantly lower educational attendance as well as annual income, which were deemed a gender disparity (Kendall’s tau rank correlation coefficients were −0.376, p < 0.001 and −0.236, p < 0.001, respecttively). Regarding the dietary health score, the majority of the participants were distributed below seven points, while in the healthy lifestyle category, most participants scored above two points. The results indicated that many people enjoyed healthy lifestyle habits, although a significant number of the elderly had lived on an unhealthy diet. More than 80 per cent of the participants had been autonomously active with high BADL and IADL scores. There were some people who had physical inconveniences and one in five participants suffered from at least one disease. In terms of self-rated health, the respondents who answered that they were in poor health approached 20 per cent. More than twice as many female respondents than male respondents reported being in poorer health compared to the previous year. Two-thirds of respondents revealed satisfaction with their daily life among both males and females. Although half of the respondents across both sexes enjoyed hobby-related activities, nearly 10 per cent remained in their homes, and more than half of males as well as one-third of females had little communication with their own neighbors. We also observed that some elderly people were likely to experience poor human relationships.
3.2. Results of Exploratory Factor Analysis
Table 2 presents factor loadings for a hypothesized model consisting of the latent variables obtained through exploratory factor analysis. Factor 1 indicated high loadings particularly for self-rated health variables, and displayed a high confidence coefficient. Self-rated health and daily life satisfaction, with the exception of the number of comorbid conditions, were termed “mental health factors” related to the three health-related dimensions. The number of comorbid conditions was a negative factor by itself and deemed to considerably associate with physical condition since the comorbidities tended to include more common diseases such as hypertension, diabetes and cardiovascular disease apart from mental disorders among the target population. Along with the number of comorbid conditions, BADL and IADL, excluding the frequency of going outside, informed the labeling of factor 2 as “physical health”. We emphasized


Table 1. Measurement variables by sex.
Notes; *; mean ± SD (Minimum-Maximum) of days.
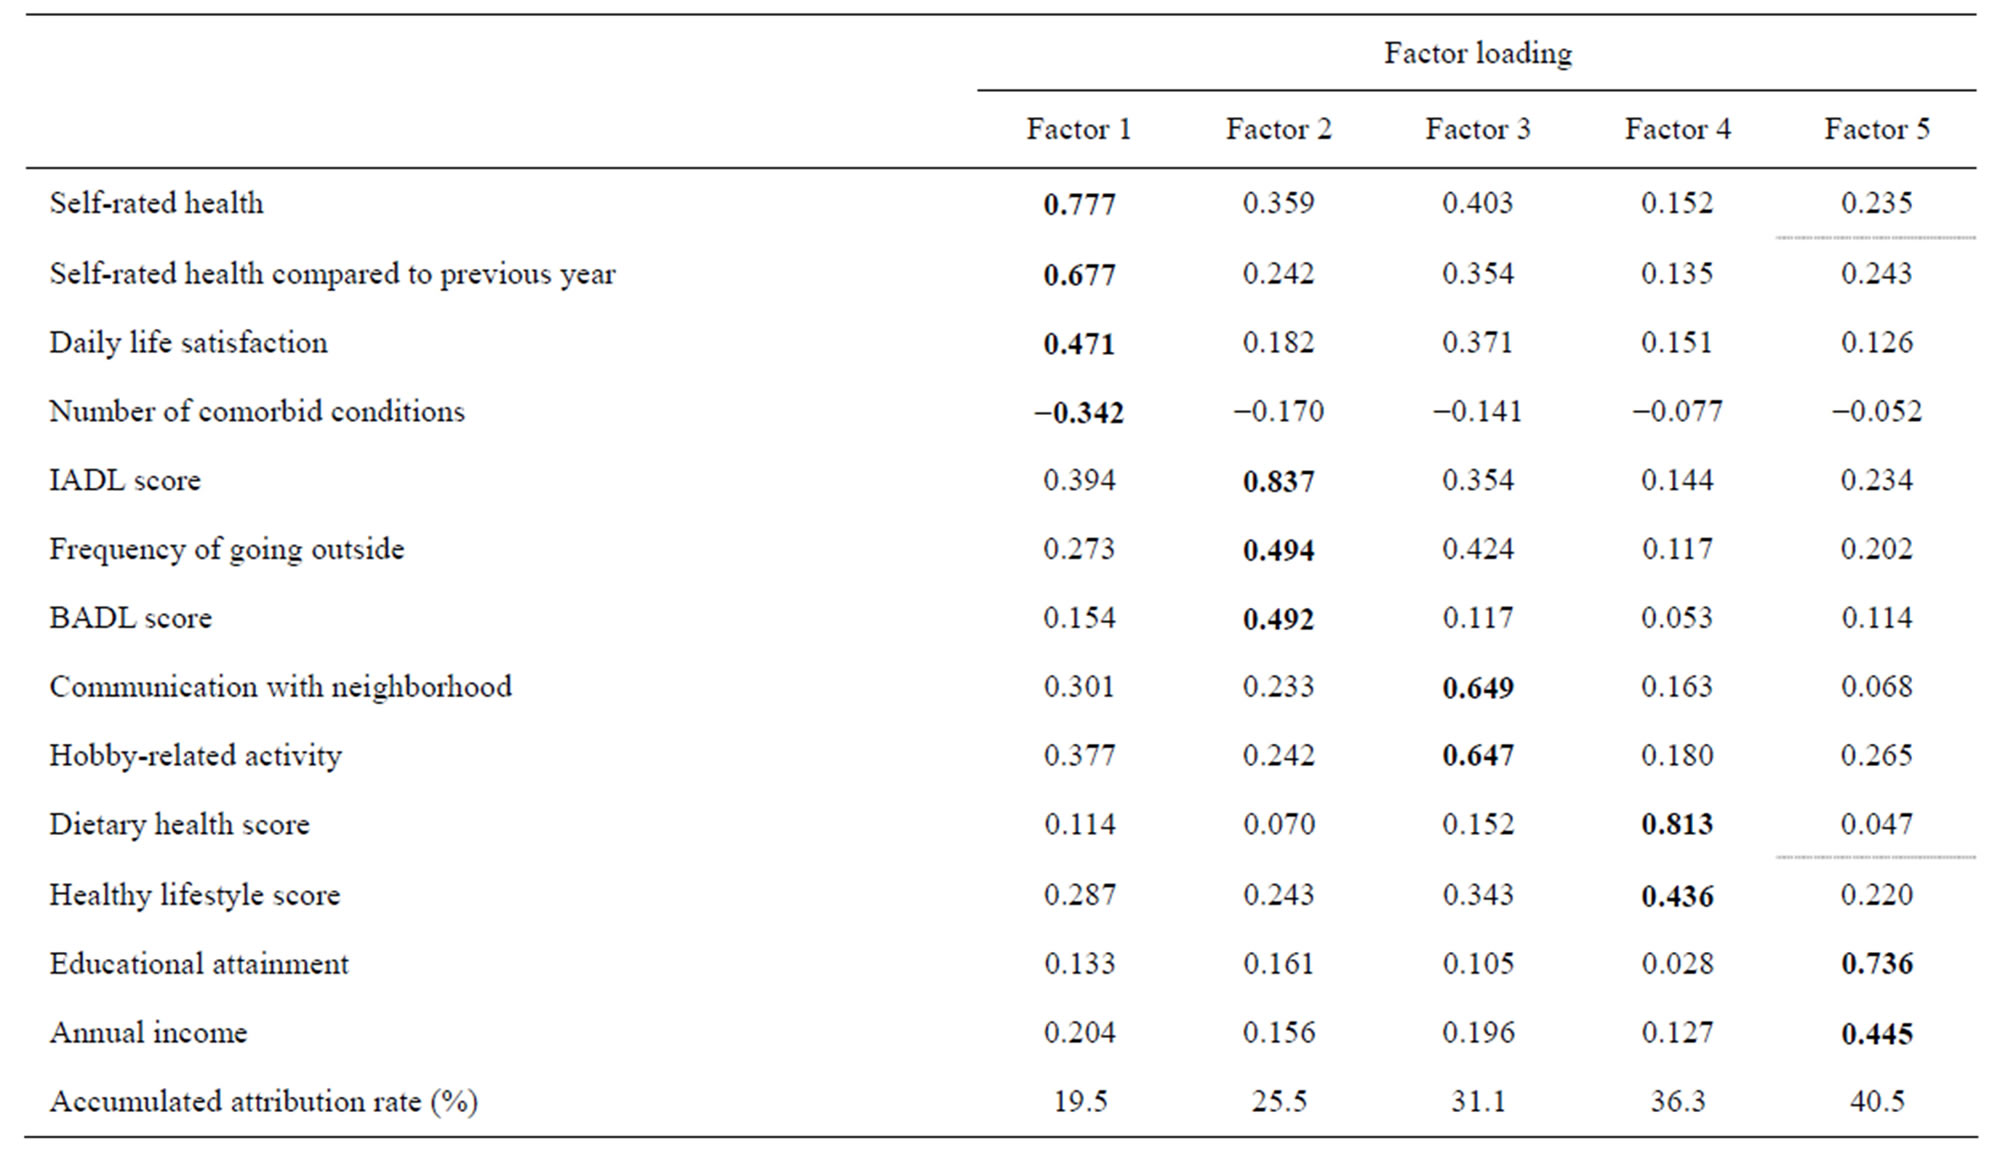
Table 2. Results of exploratory factor analysis

Table 3. Standardized direct and indirect effects toward health and life conditions by sex in the best-fitting models.
the social aspect of the frequency of going outside over the physical aspect. Therefore, factor 3 was identified as “social health”, and included communication with the neighborhood and hobby-related activities as well as frequency of going outside. Factor 4 was termed “healthy dietary and lifestyle habits” and involved healthy dietary and lifestyle habit variables. Finally, factor 5 was termed “socioeconomic status” and indicated educational attainment and annual income. The cumulative contribution proportion of the above five factors was 40.5 per cent.
3.3. Causal Relationship Model
We adopted and analyzed the statistically best-fitting models by sex using SEM. Figure 1 shows the models for male and female participants, respectively, presenting causal relationships among the latent variables. The models fit the data very well with the following fit indices: NFI = 0.861, IFI = 0.872 and RMSEA = 0.025. R squared values also fit well: 81 per cent for males and 71 per cent for females. The models depict the pathways from underlying socioeconomic status in 2001 via the three health-related dimensions in 2001 and the healthy dietary and lifestyle habits in 2004 leading to the endogenous latent health and life conditions in 2004 for both sexes. In addition, the paths from the three healthrelated dimensions approached the healthy dietary and lifestyle habits variable.
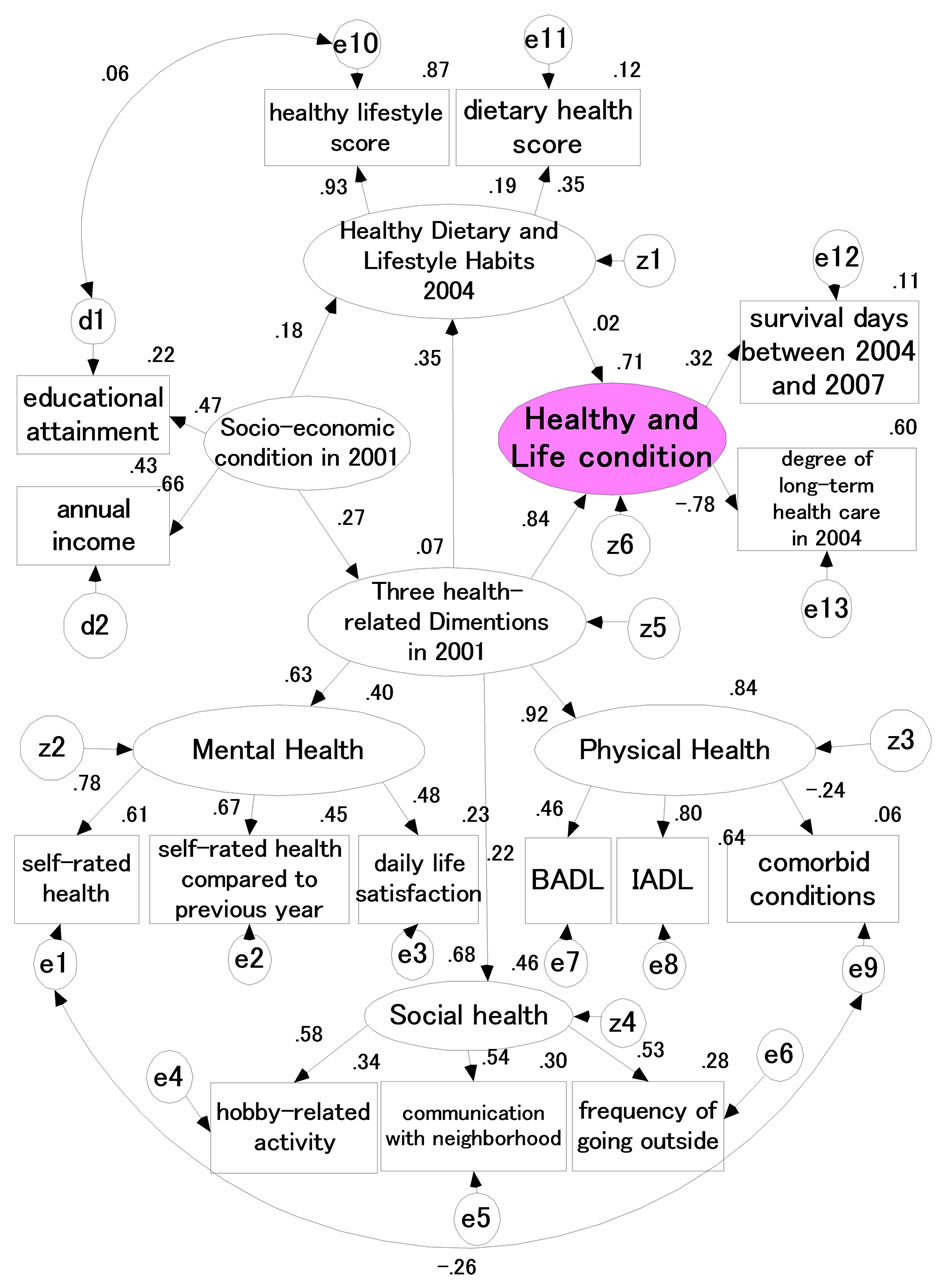
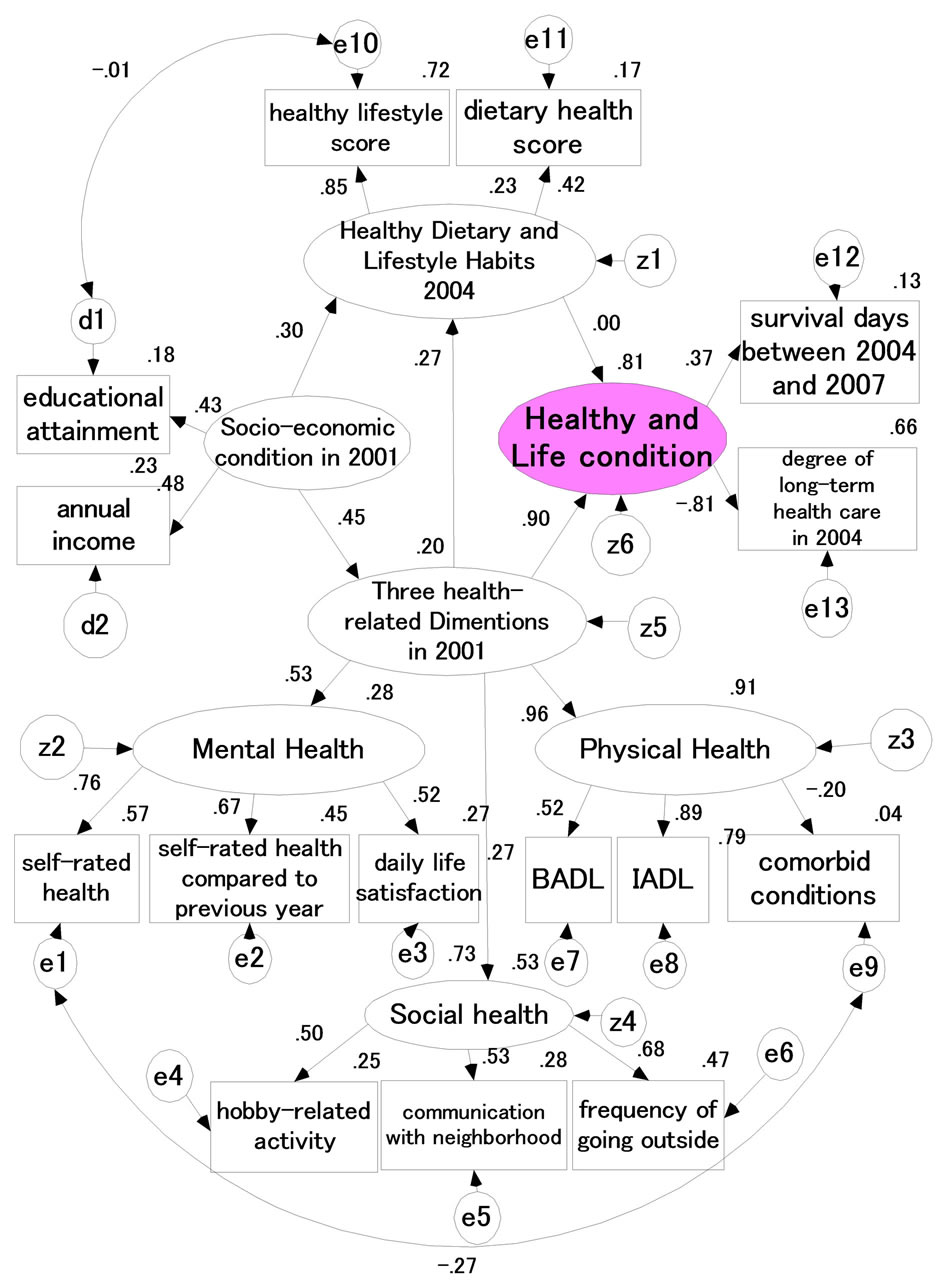
CMIN = 5195.806 P = 0.000 NFI = 0.861 CMIN = 5195.806 P = 0.000 NFI = 0.861 IFI = 0.872 RMSEA = 0.025 IFI = 0.872 RMSEA = 0.025
Figure 1. Causal structure of health and life conditions with three latent variables in males (left) and female (right).
Table 3 indicates the direct, indirect and total effects of different latent variables on the endogenous health and life condition variables by sex using the best-fitting models. We observed a relatively large direct effect of the three health-related dimensions on the health and life conditions with a 0.901 standardized path coefficient (SPC) for males and 0.835 SPC for females. Also, the direct effect of the healthy dietary and lifestyle habits on health and life conditions was nearly zero. The indirect effect of socioeconomic status via the three health-related dimensions on health and life conditions was considerably small (0.121 SPC for males and 0.094 SPC for females), whereas the indirect effect of socioeconomic status via the three health-related dimensions followed by the healthy dietary and lifestyle habits on the health and life conditions was quite small. The total effect of socioeconomic status through the three health-related dimensions and the healthy dietary and lifestyle habits on health and life conditions indicated considerably large SPCs for both males (0.444) and females (0.580).
4. DISCUSSION
To date there has been a vast amount of health education targeted to elderly populations to bolster attempts at diet and behavioral changes. These aims were based on the underlying evidence demonstrating that dietary health and lifestyle habits generated improvements in individual health conditions. In contrast, our study revealed that the health and life conditions among the urban Japanese elderly were not determined by current dietary and lifestyle habits but directly by early health-related dimensions observed three years prior as well as indirectly by their educational attainment and previous annual income. These data suggest that it might be of great importance for the elderly to particularly emphasize the maintenance of mental well being, physical activity, social communication/participation and income rather than urge an improvement of their diet or other health-related behaviors.
These findings should be considered with regards to the following three points of argument. First, most of the theories calling for healthy diet and lifestyle changes were derived from previous investigations targeting adults over a wide range of age [30]. Many studies that identified significant associations between healthy lifestyles and health outcomes incorporated people in early, middle and later adulthood [31-33]. As a result, much evidence-based health education has been assumed to be fully applicable to the elderly as well. Thus, we should make a distinction between healthy ageing led by healthy life habits during younger life periods from habits expressed during the elderly life period. Second and more importantly, a number of reports have addressed a significant association between healthy habits and health outcomes among elderly populations [34-37]. These studies focused on the relationship between healthy habits and health outcomes adjusted only for individual basic demographic variables as confounding factors. In comparison, our study analyzed associations between healthy habits and outcomes embedded in a model with a wider spectrum involving socioeconomic and healthrelated dimensional compartments that resulted in control over as many potential confounds as possible. Our findings suggest, therefore, that the described associations between healthy habits and elderly survival may be confounded with socioeconomic status and health-related dimensional factors. Third, although chronological analysis can reveal causal relationships among different latent variables, up until now there have been few studies using this analysis in the gerontology research arena. The current study was the first trial to investigate causal associations by the SEM method using longitudinal data following the same subjects across seven years. According to the standardized effects (Table 3), we believe that the dietary health and lifestyle habits were not the causes of health and life conditions, but instead these outcomes were the effects of physical, mental and social health as well as socioeconomic status.
Our study verified a strong causal association from three years earlier of three health-related dimensions toward the degree of nursing care and on survival rate. Other studies have presented the expected consequence that mortality among the elderly is significantly associated with their physical health [20,26], mental health [22,38] and social health [23,24]. The current study incorporated the three health states into one latent variable using data from the same year (the three health-rated dimensions). As our previous reports suggest [39,40], however, the reciprocal correlation among variables of the three health states do not coincidentally occur, but rather social health may be affected by mental health directly and by physical health indirectly in different chronological periods.
Figure 1 shows the nearly null effect of dietary health and lifestyle habits on health and life conditions. This finding was opposite to previous studies as discussed above. However, these data are supported by the study of Diehr et al. [34] in which older adults, aged 65 years and over, who are overweight or obese have no worse and sometimes better outcomes in categories such as activity of daily living, years of healthy life and active life expectancy compared to individuals of normal weight. From our perspective, it is assumed that overweight or obese conditions resulting from dietary health and lifestyle habits may have little influence on elderly health and life conditions.
Our study demonstrates that educational attainment and income may have a moderating effect on health rather than a direct one (Table 3). This finding is supported by some studies. The Estonia large census data analysis by Leinsalu et al. [41] demonstrated that an educational difference in mortality rates was observed in both sexes using Poisson regression modeling. The analysis showed that people with a longer educational duration in comparison with those of the lowest education level were likely to live 13.1 years longer in the case of males and 8.6 years longer in the case of females. Singh-Manoux et al. [42] reported in their British study using SEM that educational attainment had no direct effect on health, but was instead a more proximal measure of desirable social position, occupation and income that subsequently indirectly determined health. Likewise, Wardler et al. [43] reported that socioeconomic status indexed by occupational social class was significantly related to attitude and expectations that might underlie a range of health behaviors, regardless of age and sex. This indicates that socioeconomic status may influence cognition and motivation, from which health behavior is likely to be proximally determined. It is thus supposed that higher educational attainment may distally affect health outcome through a possibility of expanded social position, types of job category and increased income.
We have identified some limitations in the study. Despite the high initial response percentage (80.2%) in September 2001, the second in September 2004 declined to 52.0 per cent. In particular, those of advanced age were likely to be missed due to an increase in institutional admission to hospitals and long-term nursing homes, as well as death. The increased exclusion proportion of the target population might derive an enhancement of random errors and selection bias. We excluded the data with one or more missing values in the final analysis because exclusion of data with missing values increased goodness-of-fit in models using SEM. However, characteristics of the participants were not significantly changed regardless of the exclusion of missing data (data not shown). Although the selection of observed variables was carried out based on our previous studies [39,40], the selection criteria may restrain the coverage of available information for analysis. For example, the nine observed variables indicating the three health-rated dimensions may not represent an exhaustive list of factors impacting health as defined by the WHO. To examine which factors cause or prolong a healthy longevity of the aged, further exploration is needed to test the model with other observed variables including the same latent variables employed in the current study.
In conclusion, our findings revealed that elderly people that were healthier in the physical, mental and social domains were likely to practice healthy dietary and lifestyle habits. However, health and longer survival rates may simply be affected directly by previous overall health stats, and not by dietary health and lifestyle habits. All of the latent variables were supported by higher education and larger annual income. Therefore, exclusive health retention and economic independence may be required for elderly individuals to practice healthy habits and maintain a healthy life.
5. ACKNOWLEDGEMENTS
The authors express special gratitude to all of the participants in Tama city, Tokyo, Japan. The study was funded by a grant from the Japanese Ministry of Health, Labor and Welfare (Hone0-Health-042), and a Grant-in-Aid for Scientific Research (B) from the Japanese Ministry of Education, Culture, Sports, Science and Technology (No.15 31012 & 14350327). We are also grateful for financial support from the Mitsubishi Foundation (2009-21) in 2009.
REFERENCES
- Mathers, C.D., Murray, C.J., Salomon, J.A., Sadana, R., Tandon, A., Lopez, A.D., Ustun, B. and Chatterji, S. (2003) Healthy life expectancy: Comparison of OECD countries in 2001. Australian and New Zealand Journal of Public Health, 27, 5-11. doi:10.1111/j.1467-842X.2003.tb00372.x
- Marmot, M.G. and Smith, G.D. (1989) Why are the Japanese living longer? British Medical Journal, 299, 1547- 1551. doi:10.1136/bmj.299.6715.1547
- Yoshinaga, K. and Une, H. (2005) Contributions of mortality changes by age group and selected causes of death to the increase in Japanese life expectancy at birth from 1950 to 2000. European Journal of Epidemiology, 20, 49- 57. doi:10.1007/s10654-004-9557-x
- Asiskovitch, S. (2010) Gender and health outcomes: The impact of healthcare systems and their financing on life expectancies of women and men. Social Science & Medicine, 70, 886-895. doi:10.1016/j.socscimed.2009.11.018
- Kondo, N., Mizutani, T., Minai, J., Kazama, M., Imai, H., Takeda, Y. and Yamagata, Z. (2005) Factors explaining disability-free life expectancy in Japan: The proportion of older workers, self-reported health status, and the number of public health nurses. Journal of Epidemiology, 15, 219- 227. doi:10.2188/jea.15.219
- A new perspective on the health of Canadians. A Working Document. http://www.phac-aspc.gc.ca/ph-sp/pdf/perspect-eng.pdf
- Healthy People, The surgeon general’s report on health promotion and disease prevention. http://profiles.nlm.nih.gov/ps/access/NNBBGK.pdf
- Bronnum-Hansen, H., Juel, K., Davidsen, M. and Sorensen, J. (2007) Impact of selected risk factors on qualityadjusted life expectancy in Denmark. Scandinavian Journal of Public Health, 35, 510-515. doi:10.1080/14034940701271908
- Willcox, B.J., He, Q., Chen, R., Yano, K., Masaki, K.H., Grove, J.S., Donlon, T.A., Willcox, D.C. and Curb, J.D. (2006) Midlife risk factors and healthy survival in men. JAMA, 296, 2343-2350. doi:10.1001/jama.296.19.2343
- Enstrom, J.E. and Breslow, L. (2008) Lifestyle and reduced mortality among active California Mormons, 1980- 2004. Preventive Medicine, 46, 133-136. doi:10.1016/j.ypmed.2007.07.030
- Nothlings, U., Ford, E.S., Kroger, J. and Boeing, H. (2010) Lifestyle factors and mortality among adults with diabetes: Findings from the European prospective investigation into cancer and nutrition-potsdam study. Journal of Diabetes, 2, 112-117. doi:10.1111/j.1753-0407.2010.00069.x
- Tamakoshi, A., Kawado, M., Ozasa, K., Tamakoshi, K., Lin, Y., Yagyu, K., Kikuchi, S. and Hashimoto, S. (2010) Impact of smoking and other lifestyle factors on life expectancy among Japanese: Findings from the Japan collaborative cohort (JACC) study. Journal of Epidemiology, 20, 370-376. doi:10.2188/jea.JE20100017
- Hoi, le V., Phuc, H.D., Dung, T.V., Chuc, N.T. and Lindholm, L. (2009) Remaining life expectancy among older people in a rural area of Vietnam: Trends and socioeconomic inequalities during a period of multiple transitions. BMC Public Health, 9, 471. doi:10.1186/1471-2458-9-471
- Matthews, R.J., Jagger, C. and Hancock, R.M. (2006) Does socio-economic advantage lead to a longer, healthier old age? Social Science & Medicine, 62, 2489-2499. doi:10.1016/j.socscimed.2005.11.019
- Jagger, C., Gillies, C., Moscone, F., Cambois, E., Van Oyen, H., Nusselder, W. and Robine, J.M. (2008) Inequalities in healthy life years in the 25 countries of the European Union in 2005: A cross-national meta-regression analysis. Lancet, 372, 2124-2131. doi:10.1016/S0140-6736(08)61594-9
- Sugiura, Y., Ju Y.S., Yasuoka, J. and Jimba, M. (2010) Rapid increase in Japanese life expectancy after World War II. BioScience Trends, 4, 9-16.
- Kagamimori, S., Gaina, A. and Nasermoaddeli, A. (2009) Socioeconomic status and health in the Japanese population. Social Science & Medicine, 68, 2152-2160. doi:10.1016/j.socscimed.2009.03.030
- (1946) The constitution of the World Health Organization. International Health Conference, New York.
- Byberg, L., Melhus, H., Gedeborg, R., Sundstrom, J., Ahlbom, A., Zethelius, B., Berglund, L.G., Wolk, A. and Michaelsson, K. (2009) Total mortality after changes in leisure time physical activity in 50 year old men: 35 year follow-up of population based cohort. British Journal of Sports Medicine, 43, 482.
- Donaldson, L.J. and Jagger, C. (1983) Survival and functional capacity: Three year follow up of an elderly population in hospitals and homes. Journal of Epidemiology & Community Health, 37, 176-179. doi:10.1136/jech.37.3.176
- Eplov, L.F., Jorgensen, T., Birket-Smith, M., Segel, S., Johansen, C. and Mortensen, E.L. (2005) Mental vulnerability as a predictor of early mortality. Epidemiology, 16, 226-232. doi:10.1097/01.ede.0000152904.95284.0f
- Kaplan, G.A., Goldberg, D.E., Everson, S.A., Cohen, R.D., Salonen, R., Tuomilehto, J. and Salonen, J. (1996) Perceived health status and morbidity and mortality: Evidence from the Kuopio ischaemic heart disease risk factor study. International Journal of Epidemiology, 25, 259-265. doi:10.1093/ije/25.2.259
- Berkman, L.F. and Syme, S.L. (1979) Social networks, host resistance, and mortality: A nine-year follow-up study of Alameda County residents. American Journal of Epidemiology, 109, 186-204.
- Seeman, T.E., Kaplan, G.A., Knudsen, L., Cohen, R. and Guralnik, J. (1987) Social network ties and mortality among the elderly in the Alameda County Study. American Journal of Epidemiology, 126, 714-723.
- Khaw, K.T., Wareham, N., Bingham, S., Welch, A., Luben, R. and Day, N. (2008) Combined impact of health behaviours and mortality in men and women: The EPICNorfolk prospective population study. PLoS Medicine, 5, e12. doi:10.1371/journal.pmed.0050012
- Branch, L.G., Katz, S., Kniepmann, K. and Papsidero, J.A. (1984) A prospective study of functional status among community elders. American Journal of Public Health, 74, 266-268. doi:10.2105/AJPH.74.3.266
- Koyano, W., Shibata, H., Nakazato, K., Haga, H. and Suyama, Y. (1991) Measurement of competence: Reliability and validity of the TMIG Index of Competence. Archives of Gerontology and Geriatrics, 13, 103-116. doi:10.1016/0167-4943(91)90053-S
- Blazer, D.G. and Houpt, J.L. (1979) Perception of poor health in the healthy older adult. Journal of the American Geriatrics Society, 27, 330-334.
- Perruccio, A.V., Badley, E.M., Hogg-Johnson, S. and Davis, A.M. (2010) Characterizing self-rated health during a period of changing health status. Social Science & Medicine, 71, 1636-1643. doi:10.1016/j.socscimed.2010.07.042
- Berkman, L.F. and Breslow, L. (1983) Health and ways on living; The Alameda county study. Oxford University Press, New York.
- Ford, E.S., Zhao, G., Tsai, J. and Li, C. (2011) Low-risk lifestyle behaviors and all-cause mortality: Findings from the National Health and Nutrition Examination Survey III Mortality Study. American Journal of Public Health, 101, 1922-1929. doi:10.2105/AJPH.2011.300167
- Millen, B.E., Quatromoni, P.A., Pencina, M., Kimokoti, R., Nam, B.H., Cobain, S., Kozak, W., Appugliese, D.P., Ordovas, J. and D’Agostino, R.B. (2005) Unique dietary patterns and chronic disease risk profiles of adult men: The Framingham nutrition studies. Journal of the American Dietetic Association, 105, 1723-1734. doi:10.1016/j.jada.2005.08.007
- van Dam, R.M., Li, T., Spiegelman, D., Franco, O.H. and Hu, F.B. (2008) Combined impact of lifestyle factors on mortality: Prospective cohort study in US women. British Medical Journal, 337, a1440. doi:10.1136/bmj.a1440
- Diehr, P., O’Meara, E.S., Fitzpatrick, A., Newman, A.B., Kuller, L. and Burke, G. (2008) Weight, mortality, years of healthy life, and active life expectancy in older adults. Journal of the American Geriatrics Society, 56, 76-83. doi:10.1111/j.1532-5415.2007.01500.x
- Iestra, J., Knoops, K., Kromhout, D., de Groot, L., Grobbee, D. and van Staveren, W. (2006) Lifestyle, mediterranean diet and survival in European post-myocardial infarction patients. European Journal of Cardiovascular Prevention & Rehabilitation, 13, 894-900. doi:10.1097/01.hjr.0000201517.36214.ba
- Knoops, K.T., de Groot, L.C., Kromhout, D., Perrin, A.E., Moreiras-Varela, O., Menotti, A. and van Staveren, W.A. (2004) Mediterranean diet, lifestyle factors, and 10-year mortality in elderly European men and women: The HALE project. The Journal of the American Medical Association, 292, 1433-1439. doi:10.1001/jama.292.12.1433
- Tucker, K.L., Hallfrisch, J., Qiao, N., Muller, D., Andres, R. and Fleg, J.L. (2005) The combination of high fruit and vegetable and low saturated fat intakes is more protective against mortality in aging men than is either alone: The Baltimore longitudinal study of aging. Journal of Nutrition, 135, 556-561.
- Spiers, N., Jagger, C., Clarke, M. and Arthur, A. (2003) Are gender differences in the relationship between selfrated health and mortality enduring? Results from three birth cohorts in Melton Mowbray, United Kingdom. Gerontologist, 43, 406-411. doi:10.1093/geront/43.3.406
- Hoshi, T., Ryu, S. and Fujiwara, Y. (2007) Urban health and determinant factors for longer life for the elderly urban dwellers in Tokyo. Proceedings of the International Symposium on Sustainable Urban Environment, 61-66.
- Hoshi, T., Takagi, C., Bosako, Y., Nakayama, N., Yan, S., Kurimori, S., Hasegawa, T., Inoue, N., Yamamoto, C., Takahashi, T., et al. (2011) Chronological evaluation of physical, psychological and social health of urban elderly dwellers over 6 years and assesment of cuasal interrelationships. Nihon Koshu Eisei Zasshi, 58, 491-500.
- Leinsalu, M., Vagero, D., Kunst, A.E. (2003) Estonia 1989-2000: Enormous increase in mortality differences by education. International Journal of Epidemiology, 32, 1081-1087. doi:10.1093/ije/dyg192
- Singh-Manoux, A., Clarke, P. and Marmot, M. (2002) Multiple measures of socio-economic position and psychosocial health: Proximal and distal measures. International Journal of Epidemiology, 31, 1192-1199. doi:10.1093/ije/31.6.1192
- Wardle, J. and Steptoe, A. (2003) Socioeconomic differrences in attitudes and beliefs about healthy lifestyles. Journal of Epidemiology & Community Health, 57, 440- 443. doi:10.1136/jech.57.6.440