Applied Mathematics
Vol.5 No.1(2014), Article ID:41824,7 pages DOI:10.4236/am.2014.51016
Comparative Study for ECHAM5 and SDSM in Downscaling Temperature for a Geo-Climatically Diversified Region, Pakistan
1State Key Laboratory of Numerical Modeling for Atmospheric Sciences and Geophysical Fluid Dynamics, Institute of Atmospheric Physics, Chinese Academy of Sciences, Beijing, China
2Research & Development Division, Pakistan Metrological Department, Islamabad, Pakistan
Email: kazmi_dildar@yahoo.com, sbc_met@yahoo.com, rasulpmd@gmail.com
Received December 29, 2012; revised February 8, 2013; accepted February 15, 2013
ABSTRACT
Pakistan is a country with diversified features in terms of geography and climate. It is an agriculture based country, mainly dependent on Indus water system. In Pakistan, there are loftyplateaus to the north and Arabian Sea in the south, while the interior portion is covered with plateaus or agriculture plains. For such a region, any attempt to monitor/analyze climatic data requires some more specific details. A statistical software “SDSM” is utilized for downscaling daily temperature data of Pakistan and the results generated are compared with the output of a recommended model “ECHAM5”. After analysis, it revealed that comparatively SDSM produced much better results. The outputs from both the approaches were correlated with the observed data; SDSM-observed gave values for correlation coefficient R2 in the range of 81% - 94% whereas ECHAM5-observed produced 73% - 87% for different meteorological stations of Pakistan. On the basis of this study, SDSM can be recommended for future scenario generation of temperature data of Pakistan as well.
Keywords:Dynamic; Statistical; Future Scenario Generation
1. Layout of the Paper
Primarily in Section 1, a brief introduction is presented about the region (its geography as well climatology in climate change context), some basic information about the models utilized especially that is employed for comparison here “ECHAM5”. Besides it covers the significance of present model SDSM for the particular region and the type of assessment etc. In Section 2, the data incorporated, the methodology in general and that adopted in the present study in terms of downscaling as well as for scenario generation are illustrated. Section 3 is comprised on a comprehensive discussion about some important findings along with the figure illustration. While the last Section 4, holds the conclusion of this study with recommendations for future studies in the relevant field.
2. Introduction
Pakistan lies in southwest Asia with lofty Pamir plateau to the north and the vast Arabian Sea to the south (Figure 1(a)). The tropic of cancer passes immediately south of the country. The whole of the country lies approximately between 23.5˚N to 40˚N and 60˚E to 80˚E. The total geographical area of the country is about 0.8 million square kilometers. The Indus River with its tributaries irrigates the plane of the country. The southern part of the plane is sandy. The Indus River is perennial and the main source of water supply to the country [1].
Pakistan is covered on the north by Himalaya, Karakoram and Hindukush mountain ranges which host the world’s third largest snow/ice reserves. These mountains are the water tanks over the roof, which provides water to the reservoirs. The environment has given the operational control of this tank in terms of temperature after the strong buildup of greenhouse gases [2]. Climate change in IPCC usage refers to a change in the state of the climate system that can be identified (e.g. using statistical tests) by changes in the mean and/or the variability of its properties, and that persists for an extended period, typically decades or onger. It refers to any change in climate over time, whether due to natural variability or as a result of human activity [3]. In addition to this the fact that Pakistan is an agrarian economy accentuates its dependence on water from its rivers for various purposes ranging from agriculture to power generation. According to an estimate, the Indus River irrigates 80 percent of the 21.5 million hectare of agricultural land [4].
The ECHAM GCM has its original roots in global forecast models developed at ECMWF. This model has been modified for climate research, and its development continued to the current cycle ECHAM5. ECHAM5 is the 5th generation of the ECHAM general circulation model. Depending on the configuration the model resolves the atmosphere up to 10 hPa for tropospheric studies, or up to 0.01 hPa for middle atmosphere studies [5].
Even if global climate models in the future are run at high resolution there will remain the need to “downscale” the results from such models to individual sites or localities for impact studies [6]. The method of Statistical downscaling can be preferred over dynamical downscaling approaches for several practical advantages. Especially in the studies when low-cost, rapid assessments of localized climate change impacts are required, statistical downscaling represents the more promising picture [7]. Also in comparison to other downscaling methods the statistical method is friendlier to use and has the ability to provides local or station information [8]. Statistical downscaling is based on the view that the regional climate is conditioned by two factors: the large scale climatic state, and regional/local physiographic features (e.g. topography, land-sea distribution and land use). Although the model utilized in the present study is a statistical one but basic mathematics is involved behind its core operations. Besides, the outcomes of the downscaling were mathematically tested on individual basis prior to recommendations for incorporating in future scenario generation.
3. Data and Methodology
• 3.1. Data
• In SDSM, to downscale any parameter daily data is required for the particular locality for the period 1961-1990. To meet on the criteria, the data for daily mean air temperature for 44 meteorological stations (location are illustrated in Figure 1(b)) of Pakistanis utilized, as provided by Pakistan Meteorological Department.
• The predictors data for different parameters was derived from National Centre for Environmental Prediction (NCEP) for the period 1960-2000, detailed in Table 1 [7]. This data is available online at: http://www.cics.uvic.ca/scenarios/index.cgi?Scenarios
• ECHAM5 data was also utilized for the same location/period/parameter (0.5˚ resolution), the data is available online at: http://www.mpimet.mpg.de/en/science/models/echam/echam5.html
 (a)
(a) (b)
(b)
Figure 1. (a) Topographic map of Pakistan [9]; (b) Location of meteorological stations and provinces in Pakistan.

Table 1. Daily variables held in the UKSDSM data archive (denoted by ×). Bold type indicates variables that have not been normalised and are provided for comparative purposes. Italics indicate secondary (airflow) variables derived from pressure fields (surface, 500 and 850 hPa).
3.2. Methodology
Statistical downscaling involves developing quantitative relationships between large-scale atmospheric variables (predictors) and local surface variables (predictands). The most common form has the predictand as a function of the predictor(s), but other types of relationships, such as between predictors and the statistical distribution parameters of the predictands or between predictors and frequencies of extremes of the predictand have also been used. SDSM incorporates the following measures in order to produce downscale data of daily parameters;
1) quality control and data transformation;
2) screening of predictor variables;
3) model calibration;
4) weather generation (observed predictors).
In this study, daily observed temperature data for the period 1961-1990 for 44 meteorological stations were taken as a predictand. Predictors on individual and multiple basis were tested and then calibrated. SDSM downscaled the past data for the specified period, parameter and location. Then comparison was made between the observed and modeled data (as by utilizing scattered graph).
In the 2nd phase, comparison testing applied between the generated data of ECHAM5 model (dynamical approach) and observed daily mean temperature, for 44 localities of Pakistan, for the period 1961-1990. In the final phase, the outcomes for SDSM versus observed and ECHAM5 versus observed were tested, to investigate better correlation by any of the approach/model (statistical & dynamical) with the observed values.
4. Results and Discussion
Before initiating the core project of statistical downscaling of meteorological elements for diversified geographical location like Pakistan, it was well known that the product may not be resulted comparatively better than the former efforts made by dynamic applications. As discussed earlier that this small country has large variation in terms of geography as well as climatic conditions for different areas. To cope with the hurdles before selecting the stations under study, it was kept in mind that all the geo-climatic locations of the country may be addressed. The myth behind this idea was to test the performance of the model SDSM against some reliable dynamic model for the maximum geo-climate zones.
For comparison purpose the scatter plot option is being utilized, with correlation coefficient R2. In the following discussion, for the past time 1961-1990, the observed values for mean daily temperature are plotted& elaborated against the outcome of SDSM and ECHAM5, for few important stations of Pakistan. The graphs for the comparison of SDSM-observed and ECHAM5-observed are shown side by side, to elaborate the enhancement obtained by utilizing SDSM. It is stated in the data section that 44 national meteorological stations incorporated for the present project but here to be brief only few of them are being discussed, depending on the geo-climatic significance.
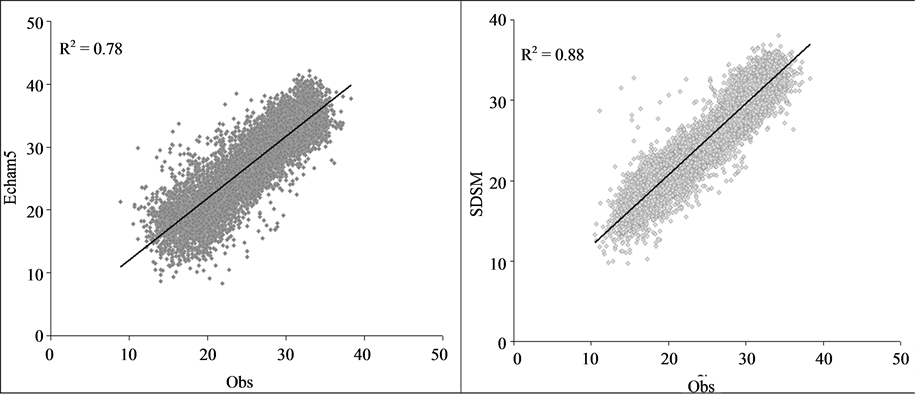
To start the discussion we take Badin a lower most station of Pakistan, located at 24.63˚N and 68.90˚E. The station is situated at the boundary of Indo-Pak and very near to the Arabian Sea coast & the Indus River. Being very low in terms of latitude, Badin lies in the jurisdiction of tropic of cancer. The area is known for many agricultural products like mango and banana etc. During summer season, the area receives heavy rainfalls some time, due to cyclonic activity in the Arabian Sea.
It can be seen from Figures 2(a) & (b) that the model has performed comparatively well than the dynamical approach. The correlation coefficient R2 for Observed versus ECHAM5 is 0.78 whereas for observed versus SDSM resulted 0.88. Muhammad, F., [10] stated that in scientific studies a correlation of 0.50 and above may be considered reliable. In the light of these remarks it can be stated that the results produced by SDSM can be considered outstanding, as these are far better than the recommended value of 0.50. On the other hand ECHAM5 has also performed better but not as much as through SDSM.
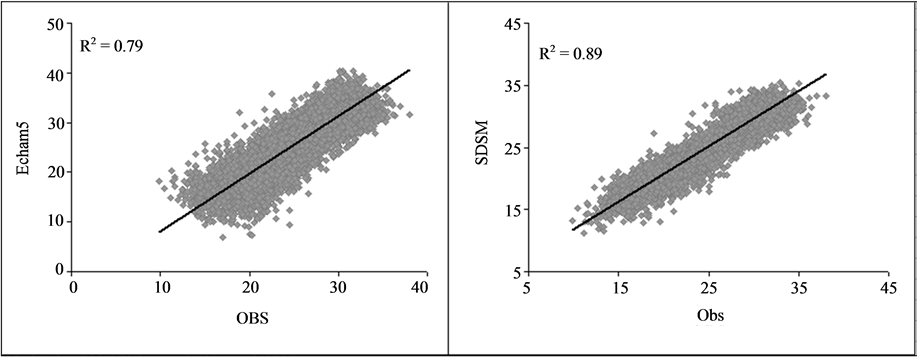
The 2nd station under discussion is Karachi, a coastal station located at 24.88˚N and 67.12˚E. The station is famous due to an important sea port, financial capital of the country and one of the most densely populated cities in South Asia. Besides, the city holds the biggest industrial zone of the country. Based on the domination of coastal winds which prevails throughout the year except some weeks in the winter season, the temperature remains mild almost. This station is also located in the vicinity of tropic of cancer.
Figures 3(a) & (b) show that for this city also, SDSM has performed much better as compare to ECHAM5. The results generated by ECHAM5 versus the observed has R2 equal to 0.79 whereas SDSM based product has shown outstanding correlation with the observed values i.e. R2 = 0.89. It is to be noted that for this station the performance of SDSM was not so good regarding the downscaling of daily maximum temperature. For minimum temperature downscaled through SDSM the correlation with the observed was remarkable but for maximum it was quite low as R2 = 0.65 [11]. But for mean daily temperature SDSM resulted much better products, may be due to the fact that in case of mean temperature the impacts of some fluctuations in terms of diurnal
 (a) (b)
Figure 2. Scatter plots for mean temperature in Celsius for the period 1961-1990, for Badin. (a) Comparison between observed and ECHAM5; (b) observed versus SDSM.
 (a) (b)
Figure 3. Scatter plots for mean temperature in Celsius for the period 1961-1990, for Karachi. (a) Comparison between observed and ECHAM5; (b) observed versus SDSM.
variations can be minimized.
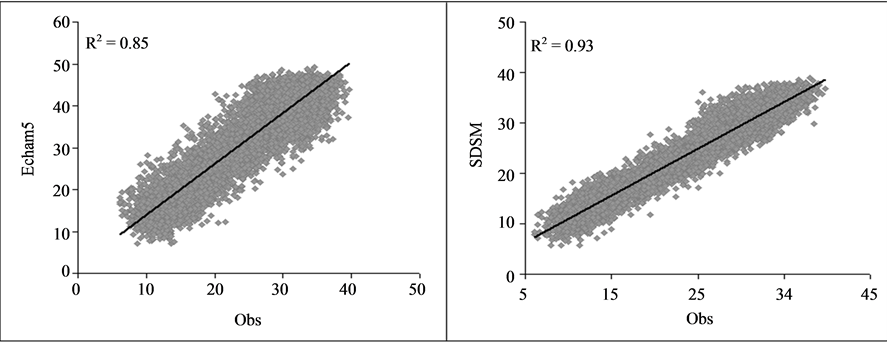
The 3rd station included in the discussion is Faisalabad, located at 31.43˚N and 73.10˚E. This station represents the major agricultural plains of the Punjab province of Pakistan, located between two big rivers; Chenab & Ravi. The land is very fertile and irrigation based agriculture is practiced in the area. The area is famous for many agricultural crops like wheat, cotton and sugar cane etc. Faisalabad division contributes a huge share in the total national wheat production. Besides this the city holds the 2nd largest textile industry of the country after Karachi.
It can be seen from Figures 4(a) & (b) that for this station also SDSM has projected much better results as compare to ECHAM5. SDSM-Observed has correlation coefficient 0.93 where as for ECHAM5-Observed it was 0.85. Therefore, the performance of this model (SDSM) for an interior and important agricultural plain is also found very optimistic.
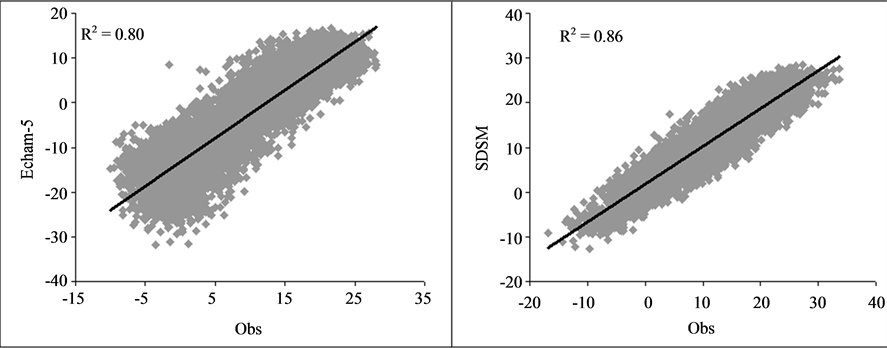
The next station is Astore, located at 35.34˚N and 74.90˚E. It is located in the northern areas of Pakistan, lies in the upper Indus basin. The area is situated in the Karakorum Range and known for glaciers occurrences. Rasul et al., [2] describes that, glaciers are considered the most sensitive indicators of climate change due to natural and anthropogenic reasons. As an example of anthropogenic change in climate, ever fastest rate of glacial depletion is observed on Siachen glacier which has lost about 3 km of its length and 19% of ice mass since 1989. Increased melting rate will first produce enhanced inflows but later they will decline drastically as the ice reserves will suffer rapid depletion.
It is observed that for this station also SDSM has shown enhanced correlation with the observed values as compare to ECHAM5 Figures 5(a) & (b). Correlation coefficient produced is 0.80 for ECHAM5-Observed and remained 0.86 for SDSM-Observed. The station has the prime importance due to climate change projection in the area. Therefore, if SDSM may produce some genuine results in term of past time temperature against an internationally recommended source (ECHAM5) then it may be considered reliable in the future as well.
5. Conclusion
The 2002-2011 ten-year average of 0.46˚C above the 1961-1990 mean matched 2001-2010 as the world’s warmest ten-year period on record. This was 0.21˚C warmer than the warmest ten-year period of the twentieth century, 1991-2000 that portrayed consistency of long-term warming trend [12]. Chaudhry et al. [13] has shown a non-significant increasing trend for annual mean temperature over the mountainous areas of the Upper Indus Basin in Pakistan. The temperature is one of the most significant elements of climate studies but its importance has been more pronounced by the recent consequences of climate change and global warming, especially in the northern parts of the country. The model performed better as compare to ECHAM5 for locations with diversified features in terms of geography and climate. The real time point data was incorporated instead of projected or interpolated data, which may the possible reason behind improving performance. Although the model utilized in this project has produced outstanding results in terms of downscaling, it has the capability to project future data
 (a) (b)
Figure 4. Scatter plots for mean temperature in Celsius for the period 1961-1990, for Faisalabad. (a) Comparison between observed and ECHAM5; (b) observed versus SDSM.
 (a) (b)
Figure 5. Scatter plots for mean temperature in Celsius for the period 1961-1990, for Astore. (a) Comparison between observed and ECHAM5; (b) observed versus SDSM.
as well. In this context, the present study may help greatly in the past as well future time climate assessments. But this is the very basic effort; some more attempts should be made by utilizing different techniques for the other climatic elements for more reliable impact assessment studies in the region.
REFERENCES
- Q. Z. Chaudhary, “Analysis and Seasonal Prediction of Pakistan Summer Monsoon Rainfall,” Ph.D. Thesis, 1992
- G. Rasul, Q. Dahe and Q. Z. Chaudhry, “Global Warming and Melting Glaciers along Southern Slopes of HKH Range” Pakistan Journal of Meteorology, Vol. 5, No. 9, 2008.
- IPCC, “IPCC Fourth Assessment Report: Climate Change 2007 (AR4),” 2012. www.ipcc.ch/publications_and_data
- GoP, “Economic Survey of Pakistan (2007-2008),” Ministry of Finance, Government of Pakistan, Islamabad, 2008.
- Roeckner, et al., “The Atmospheric General Circulation Model ECHAM5. Part I: Model Description,” Max Planck Institute for Meteorology, 2003, 127 p.
- Department of the Environment, “Review of the Potential Effects of Climate Change in the United Kingdom,” HMSO, London, 1996.
- R. L. Wilby and C. W. Dawson, “User Manual for SDSM 4.2,” 2007.
- R. L. Wilby, C. W. Dawson and E. M. Barrow, “SDSM—A Decision Support Tool for the Assessment of Regional Climate Change Impacts,” Environmental Modeling & Software, Vol. 17, No. 2, 2002, pp. 147-159. http://dx.doi.org/10.1016/S1364-8152(01)00060-3
- Pakistan Map, 2012. http://www.vista-tourism.com/pict/main_map2.jpg
- F. Muhammad, “Statistical Methods and Data Analysis,” Kitab Markiz, Faisalabad, 2000.
- D. H. Kazmi, G. Rasul, J. Tong, J. Li, G. Ali, S. B. Cheema, L. Liu, M. Gemmer and T. Fischer, “Statistical Downscaling and Future Scenario Generation of Air Temperature, for Pakistan through SDSM,” in Press.
- WMO, “WMO Statement on the Status of the Global Climate in 2011,” WMO, 2012.
- Q. Z. Chaudhry, A. Mahmood, G. Rasul and M. Afzaal, “Climate Change Indicators of Pakistan,” Technical Report, Pakistan Meteorological Department, 2009.