Agricultural Sciences
Vol.3 No.2(2012), Article ID:18392,13 pages DOI:10.4236/as.2012.32032
Water requirements and single and dual crop coefficients of sugarcane grown in a tropical region, Brazil
![]()
1Academic Unity of Atmospheric Sciences, Center of Technology and Natural Resources, Federal University of Campina Grande, Campina Grande, Brazil; *Corresponding Author: vicente@dca.ufcg.edu.br
2Miriri Alimentos e Bioenergia S/A, Capim, Brazil
3Department of Biological and Agricultural Engineering & Department of Civil & Engineering, Texas A&M University, College Station, USA
4Federal University of Pernambuco, Recife, Brazil
Received 14 December 2011; revised 28 January 2012; accepted 7 February 2012
Keywords: crop coefficient; evapotranspiration; rainfed; rainfall; water stress
ABSTRACT
A field experiment was conducted throughout 2009/2010 in a sugarcane field of a commercial distillery located on the coastal area of Paraiba state, Brazil. The objectives were to determine sugarcane water requirements and to test the single and dual crop coefficients by comparing the calculated values of ET with measured ones. Crop evapotranspiration was determined by field water balance, reference evapotranspiration (ETo) by the Penman-Monteith approach, while single and dual crop coefficients were computed through the standard FAO-56 methodology. The experimental area was cultivated with irrigation applied weekly by a centre pivot system in addition to rainfall and the irrigation scheduling was based on 100% ETo. Three statistical tests, mean bias difference (MBD), normalized root mean square difference (NRMSD) and regression analysis, were used to evaluate the performance of single and dual crop coefficients. Results showed that there was a notable symmetry between ET measured and ET calculated by Kc dual. The ET values, calculated from Kc single, underestimated those obtained from soil water balance measurements by 36%.
1. INTRODUCTION
Due to its application in the food industry and in the production of ethanol, a less polluting renewable biofuel [1] (Menossi et al., 2008), sugarcane has great economic value, especially in Brazil [2] (Pinto et al., 2005). In many regions of Brazil sugarcane is grown in rainfed area, especially in humid and sub-humid regions in the southern parts of the country. However, full or supplementary irrigation is essential for the production of sugarcane in the northeastern region of Brazil, where the climate is predominantly semiarid with air temperature ranging from 20˚C to 40˚C and mean annual rainfall being about 800 mm [3] (Silva et al., 2006).
When rainfall amount and intensity are irregular in time and space [4] (Lebourgeois et al., 2010), calculation of complementary irrigation amounts as well as the decision of when to start and stop irrigation is not easy to implement. Investigations have been carried out in many growing regions of the world in order to develop an efficient sugarcane irrigation scheduling scheme. This issue is particularly important, because the excess salinity in irrigation water reduces sugarcane yield and juice quality. Previous studies have shown the impact of extended reduced water availability on sugarcane production because the high biomass crop requires large quantities of water for maximum production [5] (Wiedenfeld, 2008). Much has been reported on different aspects of sugarcane growing, including crop coefficients [6] (Watanabe et al., 2004); transpiration [7] (Chabot et al., 2002); leaf and stalk extension, leaf area development; response to water stress [8] (Inman-Bamber and Smith, 2005); yield and juice quality [9] (Choudhary et al., 2004; [5] Wiedenfeld, 2008); water-use efficiency [10] (Inman-Bamber and McGlinchey, 2003) and evapotranspiration [11] (Omary and Izuno, 1995). Even though Brazil is one of the major sugarcane producing countries in the world, studies on water requirements of sugarcane cultivated under tropical conditions in Brazil are scarce. Brazil is one of the major sugarcane producing in the world, with 8.36 million of hectares in planted area which provides 26.6 million of cubic meters in alcohol and 30 million of tons in sugar. However, only few analyses have been carried out in Brazil for studying sugarcane crop.
This paper addresses possible errors in supplementary irrigation estimates for sugarcane grown in tropical environment, implying an increase in production cost and low crop yield. Reductions in sugarcane yield in rainfed area are due to the “veranicos” (dry spells of more than 2 weeks during the rainy season). The water availability is the major cause of inter-annual yield variation and yield differences of sugarcane grown on different soils in Brazil [12] (Van den Berg et al., 2000). Sugarcane is highly productive in tropical and sub-tropical areas of the world, but the water stress decreases plant productivity [13] (Rodrigues et al., 2009).
The crop coefficient plays an essential role in various agricultural practices and it has been widely used to estimate the actual ET in irrigation scheduling [14] (Pereira et al., 1999). Empirical crop coefficients have been criticized as regards their meaning and use, because their values vary according to the conditions of both climate and crop stage under which they were derived. [15] Doorenbos and Pruitt (1977) in FAO-24 and [16] Allen et al. (1998) in FAO-56 suggested crop coefficient values for a large number of crops under different climatic conditions which are commonly used in places where the local data is not available. However, there is a need for local calibration of the crop coefficients under given climatic conditions [17] (Kashyap and Panda, 2001). Nevertheless, the FAO-56 dual crop coefficient provides evapotranspiration (ET) calculations separately for transpiration and evaporation from soil. This approach is useful for studies that aim to optimize crop production by reducing the soil evaporation fraction of ET. A model that separates evapotranspiration (ET) into soil water evaporation (E) and plant transpiration (T), and calculates parameters associated with the water and energy balance of the soil and crop surfaces is required to understand the fate of water in different cropping systems [18] (Qiu et al., 1999). Although the dual crop coefficient procedure has been applied to many agricultural areas [19] (Allen et al., 2000; [20] López-Urrea et al., 2009; [21] Liu and Luo, 2010; [22] Flumignan et al., 2011), for sugarcane it is still incipient particularly for tropical regions. Thus, the objectives of this study were: 1) to evaluate sugarcane evapotranspiration by using the water balance method and compare the results to those obtained by applying the standard FAO-56 methodology, and 2) determining the single and dual crop coefficient curves of sugarcane growth in tropical region.
2. MATERIALS AND METHODS
2.1. Experimental Site
The field experiment was carried out in 2009/2010 in a sugarcane field of commercial distillery located in the coastal area of Paraiba state, Brazil (latitude 6˚54'59''S; longitude 35˚09'17''W; altitude 121 m). The study crop was sugarcane (Saccharum spp.), cultivar RB 92579, in the first ratoon crop. The mean annual rainfall in study area is about 1500 mm and mean annual air temperature ranges from 19˚C (rainy season) to 34˚C (dry season), while the rainy season generally starts in March and ends in August [23] (Silva, 2004). The local climate is tropical wet with tropical savanna vegetation and the soil type is Lixisols (FAO soil taxonomy). A trench was open in the experimental site for extracting soil samples that were used to determine the textural class, bulk density, porosity, and field capacity and wilting point. The groundwater level at the experimental site dropped down to 3.0 m during the growing season. The main soil physical and chemical properties of soil at study area are summarized in Table 1. The experimental area was cultivated with irrigation applied weekly by a centre pivot system, in addition to rainfall. Irrigation scheduling was based on 100% of reference evapotranspiration (ETo) which was obtained by the Penman-Monteith approach [16] (Allen et al., 1998).
2.2. Measurements
Daily measurements of air temperature, wind speed,
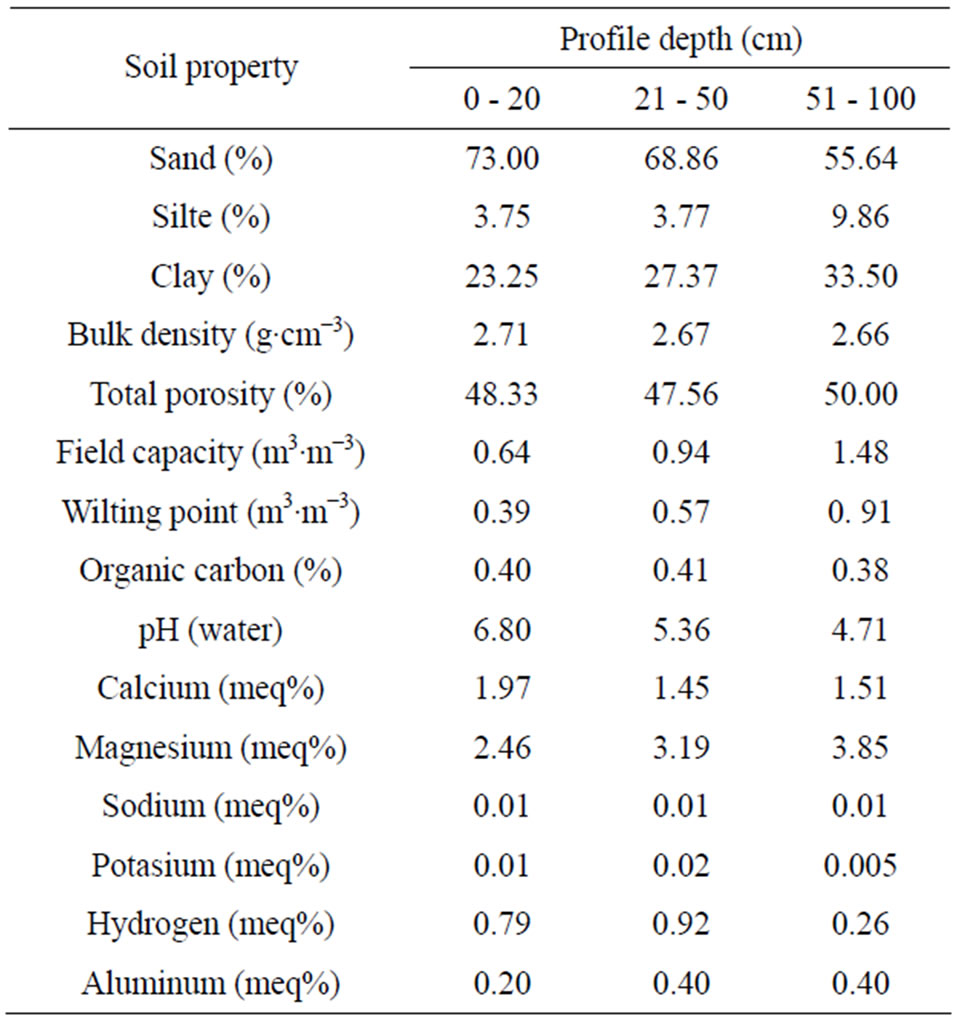
Table 1. Physical and chemical properties at the experimental area in the coastal area of Paraiba state, Brazil.
solar radiation and relative humidity for estimating ETo as well as rainfall were made on a data collection platform (DCP) located near the experimental site. The soil water content was measured every 3-days from 10 October 2009 to 12 September 2010 using a profile probe PR2 sensor and an HH2 data logger (Delta-T Devices LTA). Once a site specific calibration was identified as necessary for the PR2 probe [24] (Qi and Helmers, 2010), we used in-situ calibrated equations for estimating soil water content. The soil water content was monitored at 0.10 m intervals down 1.0 m starting at 0.10 m. For representative measurements of soil water content by the profile probe, 9 access tubes were inserted into the ground at the experimental plot and then the mean soil water content was computed as the arithmetic mean of the water content values observed from access tubes.
Crop parameters were measured during different stages of sugarcane growth. The crop data included the planting date, 10% cover date, full cover date, maturity date, harvest date, mean root depth, height of sugarcane, and leaf area. The root depth was measured through destructive plant sampling. The mean root depth was obtained by averaging the root depth of 5 plants at different stages of growth. One plot of 30 × 30 m2 size was selected in a sugarcane field for obtaining crop parameters and soil water content. The main experimental area was surrounded by other sugarcane fields of 8000 ha. Direct measurements of plant height (perpendicular distance from the soil at its base to the highest point reached amongst all parts in their natural position) were taken weekly. The leaf area was obtained by gravimetric techniques. The gravimetric method correlates the dry weight of leaves and leaf area using predetermined green-leaf-area-to-dryweight ratios (leaf mass per area, LMA). LMA is determined from a sub-sample extracted from the global field sample [25] (Jonckheere et al., 2004). The leaf area index was calculated from the measured mean leaf area dividing the plot area.
2.3. Determination of Soil Water Balance
The soil water balance in the root zone over a given time interval was calculated from the mass conservation equation expressed as:
 (1)
(1)
where ∆S is the change in root zone water storage, R is the rainfall, I is the depth of irrigation applied, RO is the runoff from the soil surface, CR is the capillary rise, D is the drainage at depth z, below the root zone, and ET is the actual evapotranspiration. All the water balance components are in mm. Surface runoff was neglected, once the experimental site had flat topography. Similarly, CR was assumed to be zero because the water table was more than about 1 m below the bottom of the root zone at the experimental site. The change in soil water storage (DS) was determined as:
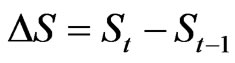 (2)
(2)
where St and St−1 are the changes in soil water storage at times t and t − 1, respectively. The changes in soil water storage (SL) were determined by considering the soil layers from the surface (z = 0) down to the bottom of the measurements soil depth (z = 0.6 m). For subsequent soil layers, soil water content values from the upper and lower borders of each layer were averaged to find the mean water content of the entire layer. Deep drainage (D) in the root zone following a heavy rain or irrigation was calculated as
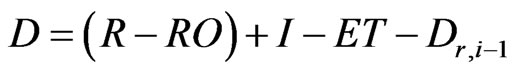 (3)
(3)
where R is the rainfall (mm), RO is the runoff (mm), I is the irrigation (mm), ET is the crop evapotranspiration (mm), and Dr,i−1 is the water content in the root zone at the end of the previous day (mm). Both ET and Dr,i−1 were calculated using the FAO-56 dual crop coefficient method [16] (Allen et al., 1998).
2.3.1. Evapotranspiration by FAO-56 Dual Crop Coefficient
The crop evapotranspiration (ET) under soil water stress conditions was calculated following the FAO-56 methodology [16] (Allen et al., 1998) when single (Eq.4) and dual (Eq.5) crop coefficient approaches were employed:
 (4)
(4)
 (5)
(5)
where Ks is the stress reduction coefficient, Kc is the crop coefficient, Kcb is the basal crop coefficient, Ke is the soil evaporation coefficient, and ETo is the reference evapotranspiration (mm). When the average soil water content of the root zone was not adequate to sustain full plant transpiration, Ks reduced the value of Kcb. The Ke values represent the evaporation from wet soil, which occurs in addition to the evapotranspiration represented in Kcb [19] (Allen, 2000). The procedure used to obtain the Ks, Kcb and Ke values was that proposed by Allen et al. [16] (1998). A full account of these estimates is also given in Allen [19] (2000) and [26] Bodner et al. (2007). Therefore, only the relevant aspects of the FAO-56 methodology [16] (Allen et al., 1998) to the present study are briefly discussed here. The typical values of single and dual crop coefficients for non stressed, well-managed crops in sub humid climates (RHmin ≈ 45%, u2 ≈ 2 m/s), and lengths of crop development stages of sugarcane grown in tropical regions are presented in Table 2. Only three values of Kc are required to describe and construct the crop coefficient curve. However, it is necessary for
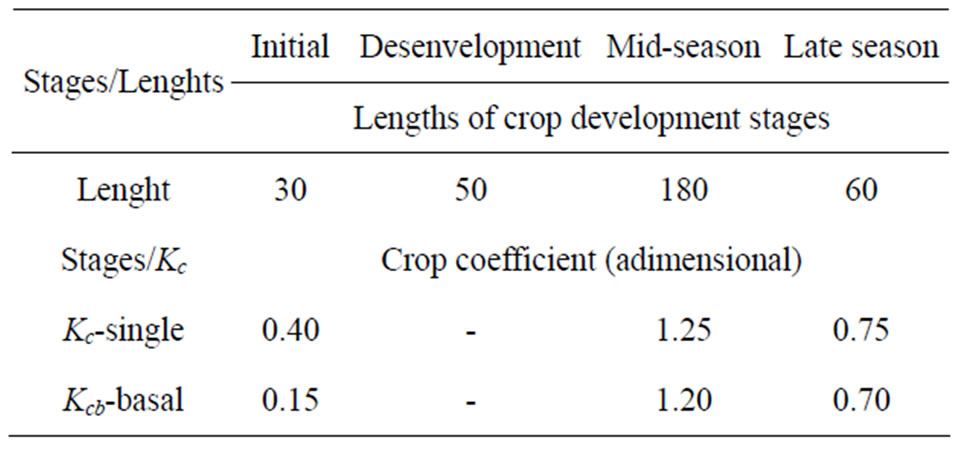
Table 2. Single and basal crop coefficients for non stressed, well-managed crops in sub humid climates and lengths of crop development stages of sugarcane grown in tropical region recommended by Allen et al. (1998).
determine the locally adjusted lengths of the four growth stages: Initial, development, mid-season, and late stages.
The daily Kc value was determined by assuming Kc to be constant during the initial and mid-season stages and assuming linear relationship between the Kc value at the end of the previous stage (Kc, prev) and the Kc value at the beginning of the next stage (Kc, next) during the crop development and late season stages. The daily Kc values during the crop development and late season stages can be calculated as:
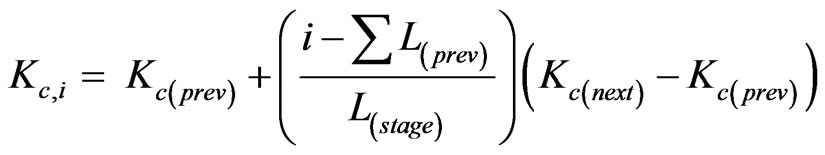 (6)
(6)
where i is the day number within the growing season, Kc,i is the crop coefficient on day i, Lstage is the length of the stage under consideration, and  is the sum of the lengths of all previous stages.
2.3.2. Performance of the FAO-56 Results
Two statistical criteria used to evaluate the agreement between the calculated ET following the FAO-56 methology and measured ET by water balance values were the mean bias difference (MBD) and the normalized root mean square difference (NRMSD) which were obtained as [27] (Silva et al., 2010):
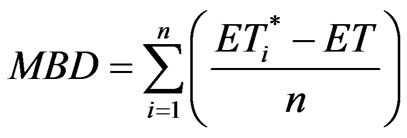 (7)
(7)
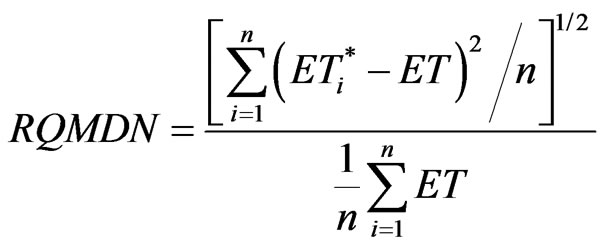 (8)
(8)
where n is the number of data pairs,  and ET are the ith modeled and measured values of evapotranspiration, respectively. In addition to MDB and RQMDN, regression analysis between measured and calculated values is also an indicator of model performance. MBD indicates the average deviation of predicted values from the measured values and RQMDN measures the discrepancy of predicted values around observed values.
3. RESULTS AND DISCUSSION
The soil water balance components for each developmental stage of sugarcane are summarized in Table 3. The high cumulative drainage value occurred in response to a large irrigation during the experimental period which corresponded to 22.4% of the total irrigation. Total rainfall through the experimental period was 35% less than the long-term average (for the period 1960-2006), while the cumulative irrigation summed 1342.2 mm. A higher irrigation application from development stage to late season stage resulted from lower seasonal rainfall and combined effects of air temperature, evaporative demand and development of leaf area. The cumulative ET values of sugarcane were very high over crop growth stages (1686.7 mm) and crop growth stages, except in the initial stage (77.9 mm) due to the low number of irrigation events.
The highest and lowest cumulative values of water balance components occurred in the mid-season and initial crop growth stages, respectively, as a natural conesquence of the lengths of crop development stages. In addition, the higher evaporative demand and irrigation application produced an increase in the cumulative ET for the whole growth stages. As can be observed, both ∆S and D showed a large variation. For instance, D for the development stage was low compared to the exceptional high values in the consecutive growth stage. On the other hand, ∆S varied from −61.7 mm to 46.7 mm from initial to mid-season stage due to the increase in irrigation application.
Employing procedures in laboratory, studies were carried out to experimentally determine the upper and lower limits of the available water. The measured values of field capacity water content and wilting point were 0.637 and 0.388 cm3·cm−3, respectively. Using the FAO-56 dual crop coefficient method, the total evaporable water (TEW) = 44.3 mm, readily evaporable water (REW) = 8.0 mm, total available water (TAW) = 24.9 mm and readily available water (RAW) = 16.2 mm. In this study, we used an evaporation depletion factor p of 0.65 for sugarcane [16] (Allen et al., 1998). The different Kc and ET values and leaf area index (LAI) for each crop growth stage in the first ratoon crop of sugarcane under study are also given in Table 4. On the whole crop season, due to high irrigation load, ET was lower for Kc single than ET based on both soil water balance (Kc-SWB) and dual crop coefficient (Kc-dual). On average, both Kc and ET based on SWB were coincident with those based on Kc- dual. In this comparison, ET (Kc-single) represented daily average values over the time interval of each crop growth
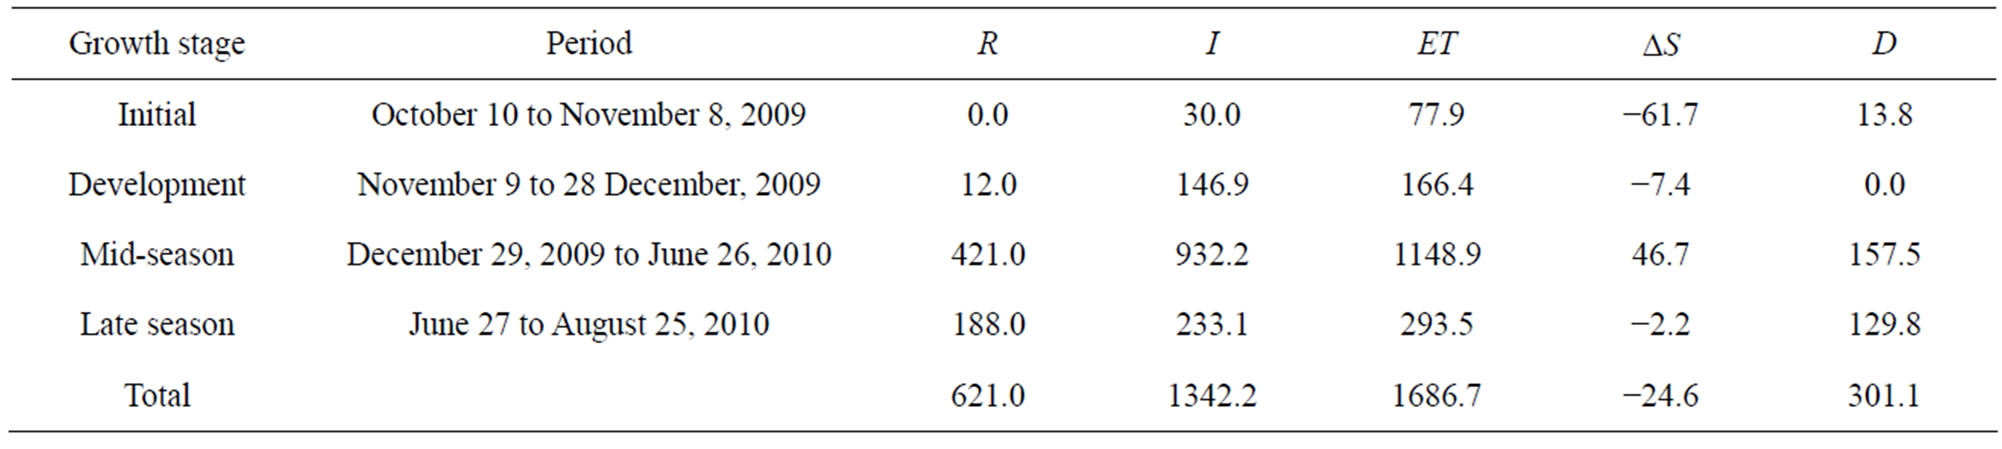
Table 3. Soil water balance components (mm) during the developmental stages for sugarcane observed at the experimental site in a tropical climate, Brazil. R = rainfall, I = irrigation, ET = crop evapotranspiration, DS = water storage change and D = deep drainage.
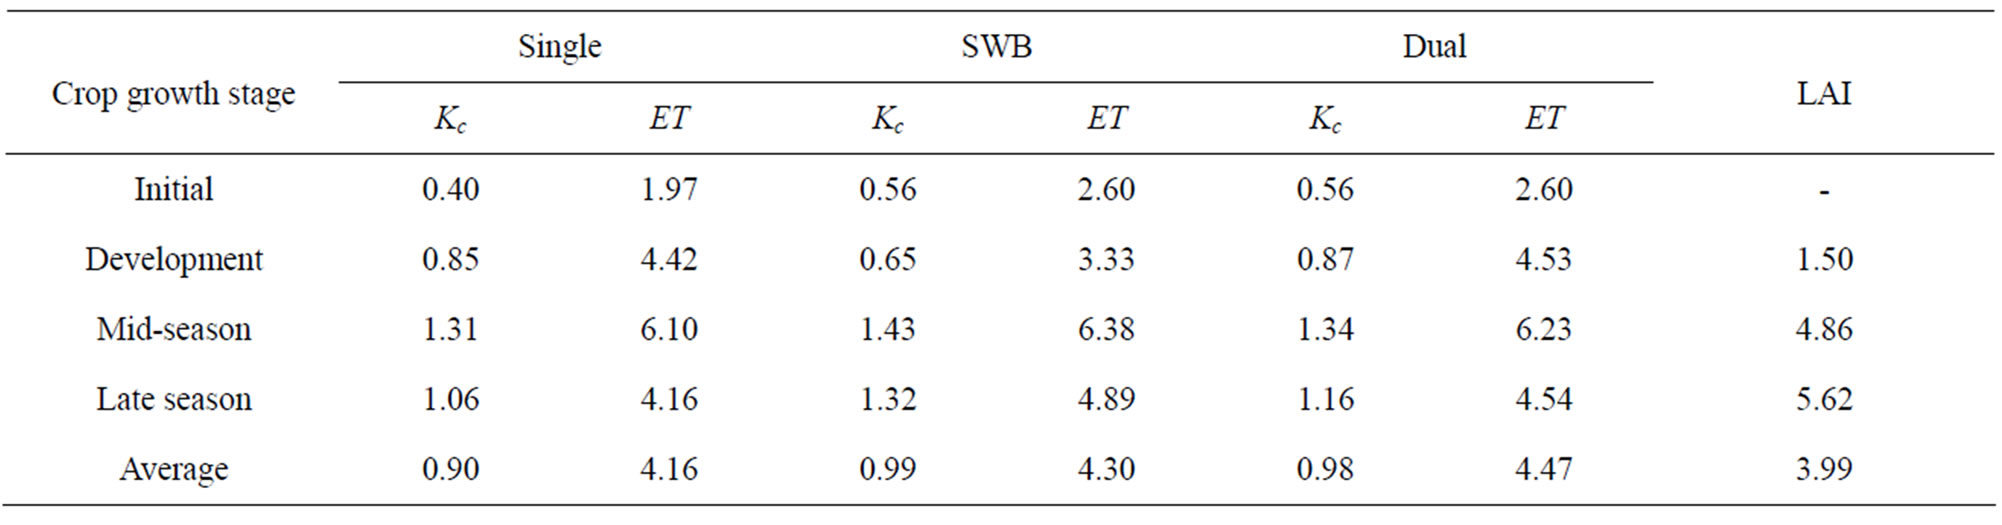
Table 4. Mean values of crop coefficient and evapotranspiration for each crop growth stage of sugarcane based on single and dual approach of FAO-56 methodology (Allen et al., 1998), soil water balance (SWB) and leaf area index (LAI).
stage based on Kc-single by adjusting their values for tropical region.
The difference between Kc-single and Kc-SWB was about 10%, while between Kc-SWB and Kc-dual it was less than 1%. The highest difference between Kc-single and Kc-WB occurred on late season stage (20%), corresponding to a difference between ET values of 0.73 mm·day−1. In practice, results reported here showed that Kc single can lead to significant errors in irrigation scheduling of sugarcane in tropical conditions. On the other hand, from the comparison it appears that if the FAO-56 dual crop coefficient method was used, there was always a good correspondence between Kc-SWB and Kc-dual in the entire growing season. These results provided preliminary elements which permit to achieve the objective of this study: dual crop coefficient does have interesting possibilities for irrigation scheduling of sugarcane grown in a tropical climate. Indeed, the Kc values based on SWB are significantly higher than Kc-single recommended by FAO-56 [16] (Allen et al., 1998) for sugarcane in the whole growth stage. This result is consistent with previous studies which take into account the evaporative demand. More arid climates and conditions of greater wind speed will have higher values for Kc, while more humid climates and conditions of lower wind speed will have lower values for Kc [16] (Allen et al., 1998). The effect of the difference in aerodynamic properties between the grass reference surface and agricultural crops is not only crop specific but also varies with climatic conditions. The crop coefficient values derived from field soil water balance during the initial, mid-season and late stages for sugarcane growth in a tropical region are 0.56; 1.43 and 1.32, respectively. These values are higher than those recommended by FAO-56 and by [10] Inman-Bamber and McGlinchey (2003) for sugarcane. This is because the results of these studies were obtained either for other climate conditions or sugarcane ratoon/varieties. Inman-Bamber and McGlinchey [10] (2003) provided a sound basis for confirmation of the current FAO 56 crop coefficients of 0.4, 1.25 and 0.7 for sugarcane during initial, mid-season and late stages, respectively.
At various times during the growing season, sugarcane leaf area, calculated leaf area index (LAI) and plant height were determined. During the entire growth season, the leaf area index (LAI) ranged from 1.50 to 5.62 m2·m−2, following a similar course of crop coefficient (Figure 1). For some intervals of curve, due to a number of operational problems related to sampling of leaf area, LAI was not available. During the initial and development stages, LAI increased rapidly reaching a maximum value around the day of year DOY 170 in the range between 5.0 and 5.5 m2·m−2. There after, LAI decreased slowly toward to the end of late season. On the other hand, for maximum LAI (completely covered ground surface) Kc decreased from a peak value (~1.5) tending to an asymptotic low value around 1.3.
The crop coefficient is dependent upon the stage of

Figure 1. Seasonal course of evapotranspiration (ET) and leaf area index (LAI) of sugarcane throughout the experimental year.
canopy height, crop growth, architecture and cover [16] (Allen et al., 1998). Several authors have demonstrated that Kc is highly correlated with leaf area index [28] (Medeiros et al., 2001), leaf area [29] (Williams and Ayars, 2005) and ground cover [20] (López-Urrea et al., 2009). Indeed, these studies showed that the water losses, resulting from evapotranspiration processes, increase when vegetation develops, so that adaptation to local climate promotes canopy development until water shortage prevents further growth.
The present study also shows the relationship between LAI and evapotranspiration, as another means of characterizing the sugarcane canopy. Evapotranspiration (ET) and crop coefficient (Kc) were linearly related to sugarcane leaf area index (Figure 2). The greatest r2 value (0.88) of the relationship with LAI was that for crop coefficient compared to an r2 value of 0.67 for evapotranspiration. The calculated evapotranspiration during the growing season increased almost linearly from October 10 (at the beginning of experimental period) until approximately DOY 120. Furthermore, in spite of the relatively low coefficient of determination, the relationship between LAI and ET was statistically significant by Student’s t-test at the 0.05 level. A particularly good fitting between ET and LAI was observed from DOY 343 to DOY 120, when LAI had reached the maximum value.
The coefficient of determination of 0.83 confirmed a good agreement between the Kc and LAI data for this period as well as between Kc and LAI for the whole period which are statistically significant at the 0.01 level. This result indicates that reduction in irrigation application in late season had a negative impact on ET reduction compared to a slow decrease in LAI.
Comparisons between ET values measured by soil water balance and calculated by Kc single and Kc dual are illustrated in Figure 3. A linear regression of the two groups of observations was made for evaluating the performance of both crop coefficients. The ET calculated by Kc dual provided a better performance than ET calculated by Kc single. The slope of the linear regression was 0.81 and 0.71 with coefficient of determination equal to 0.53 and 0.63 for ET calculated by Kc single and Kc dual, respectively.
The different components of the field soil water balance within the first ratoon crop of sugarcane under study are given in Figure 4. As previously mentioned, irrigation application was high and rainfall amount was low in almost the entire experimental period but resulted in high water supply (P and/or I) which had a positive impact on evapotranspiration increase. Daily average evapotranspiration (ET) was calculated over 7-day periods using the soil water balance method. This method must be used over periods of longer than one week to provide an acceptable precision in estimating field evapotranspiration [30] (Trambouze et al., 1998). A similar procedure was used by Azevedo et al. [31] (2003) who
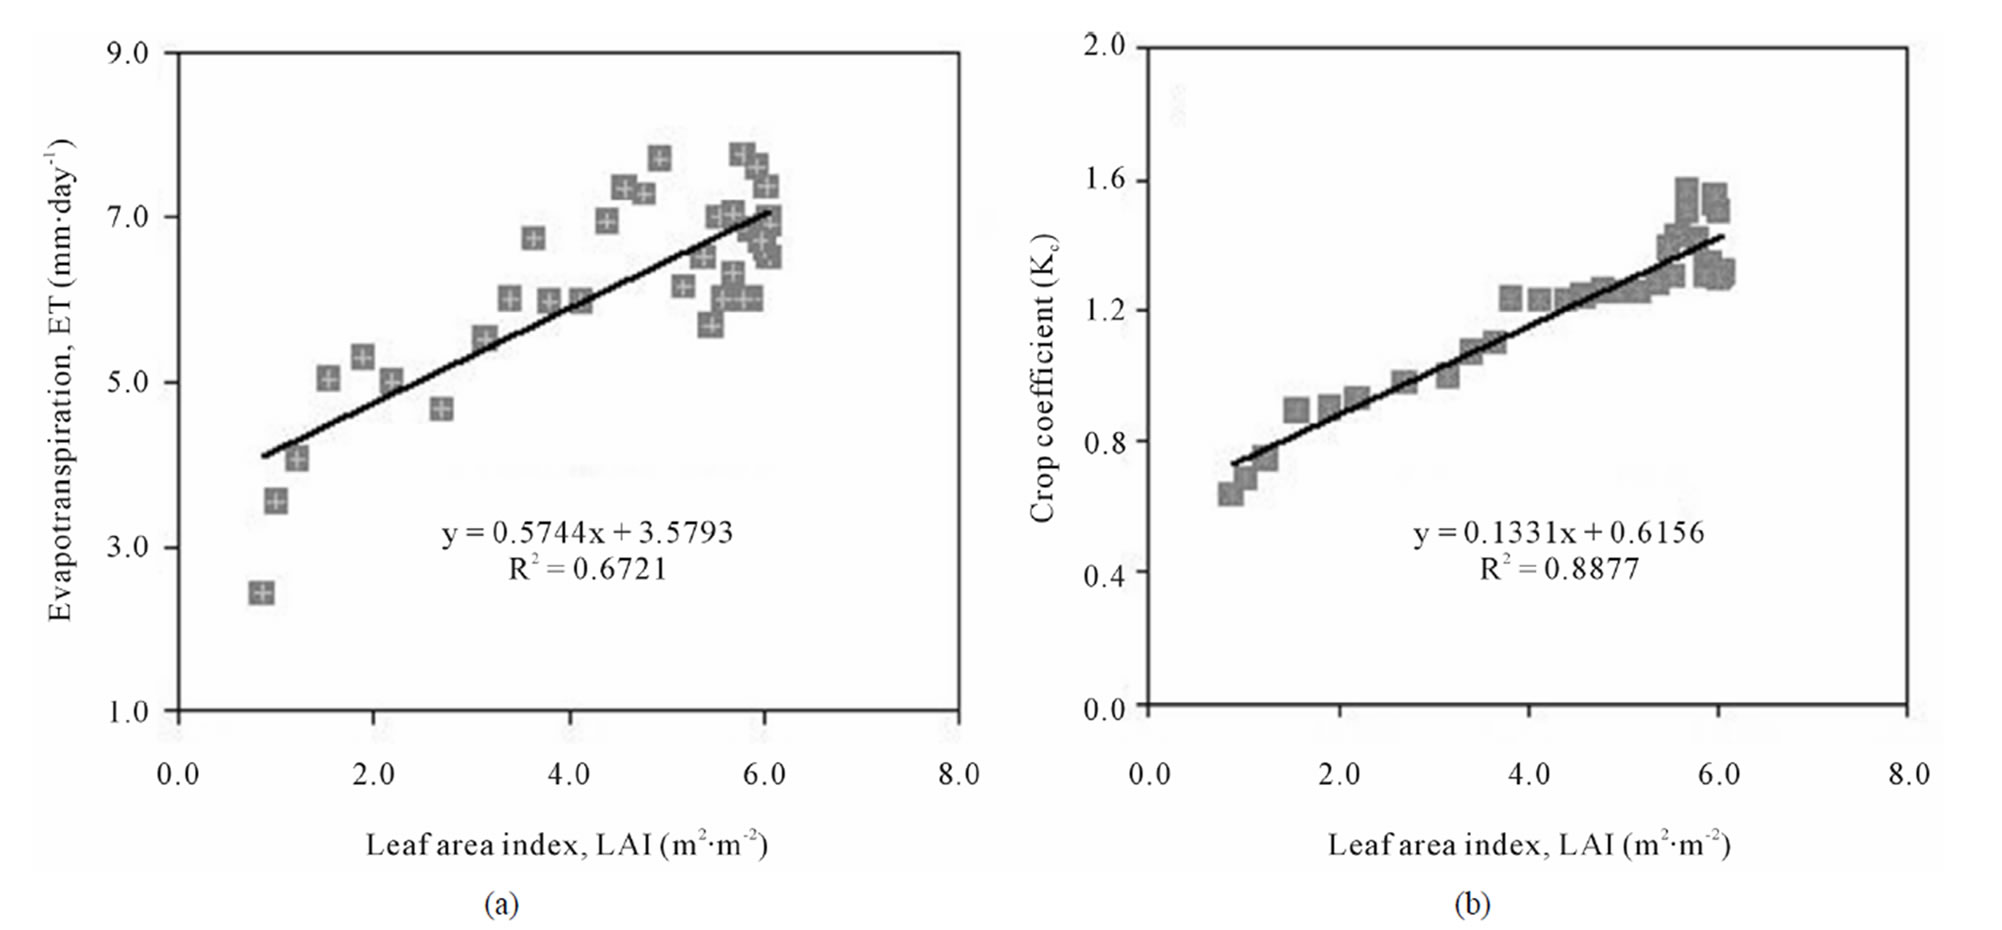
Figure 2. Relationship between the leaf area index (LAI) and (a) calculated evapotranspiration (ET) and (b) crop coefficient (Kc) of sugarcane growth in tropical environment. Points represent 7-day averages of daily Kc and ET.

Figure 3. Comparison between measured evapotranspiration and calculated evapotranspiration based on Kc single (a) and Kc dual (b). Points represent 7-day averages of daily ET measured and calculated.
determined the soil water balance components for mango orchard grown in a semiarid environment in a northeastern region of Brazil. There was a close correspondence between weekly measures of ET and water supplied as rainfall and irrigation, indicating that evapotranspiration ranged over a large interval depending on the water amount. Sugarcane ET by soil water balance had an average ± standard deviation of 4.3 ± 1.6 mm·day−1.
The highest water supply of 134.32 mm on DOY 158 was mainly provided by high episodic rainfall events (75 mm) between June 10 and June 18, 2010. The related drainage for this period was 57.54 mm, indicating the high-efficiency of Eq.3 for detecting deep drainage in the root zone following heavy rain or irrigation. Therefore, this equation can be used for monitoring drainage when sets of mercury manometer tensiometers are not available for determining the soil water negative pressure suction. Although the water supply had the highest influence on the magnitude of sugarcane ET, small influences of the atmospheric demand and leaf area during the development period can greatly affect the daily values of ET.
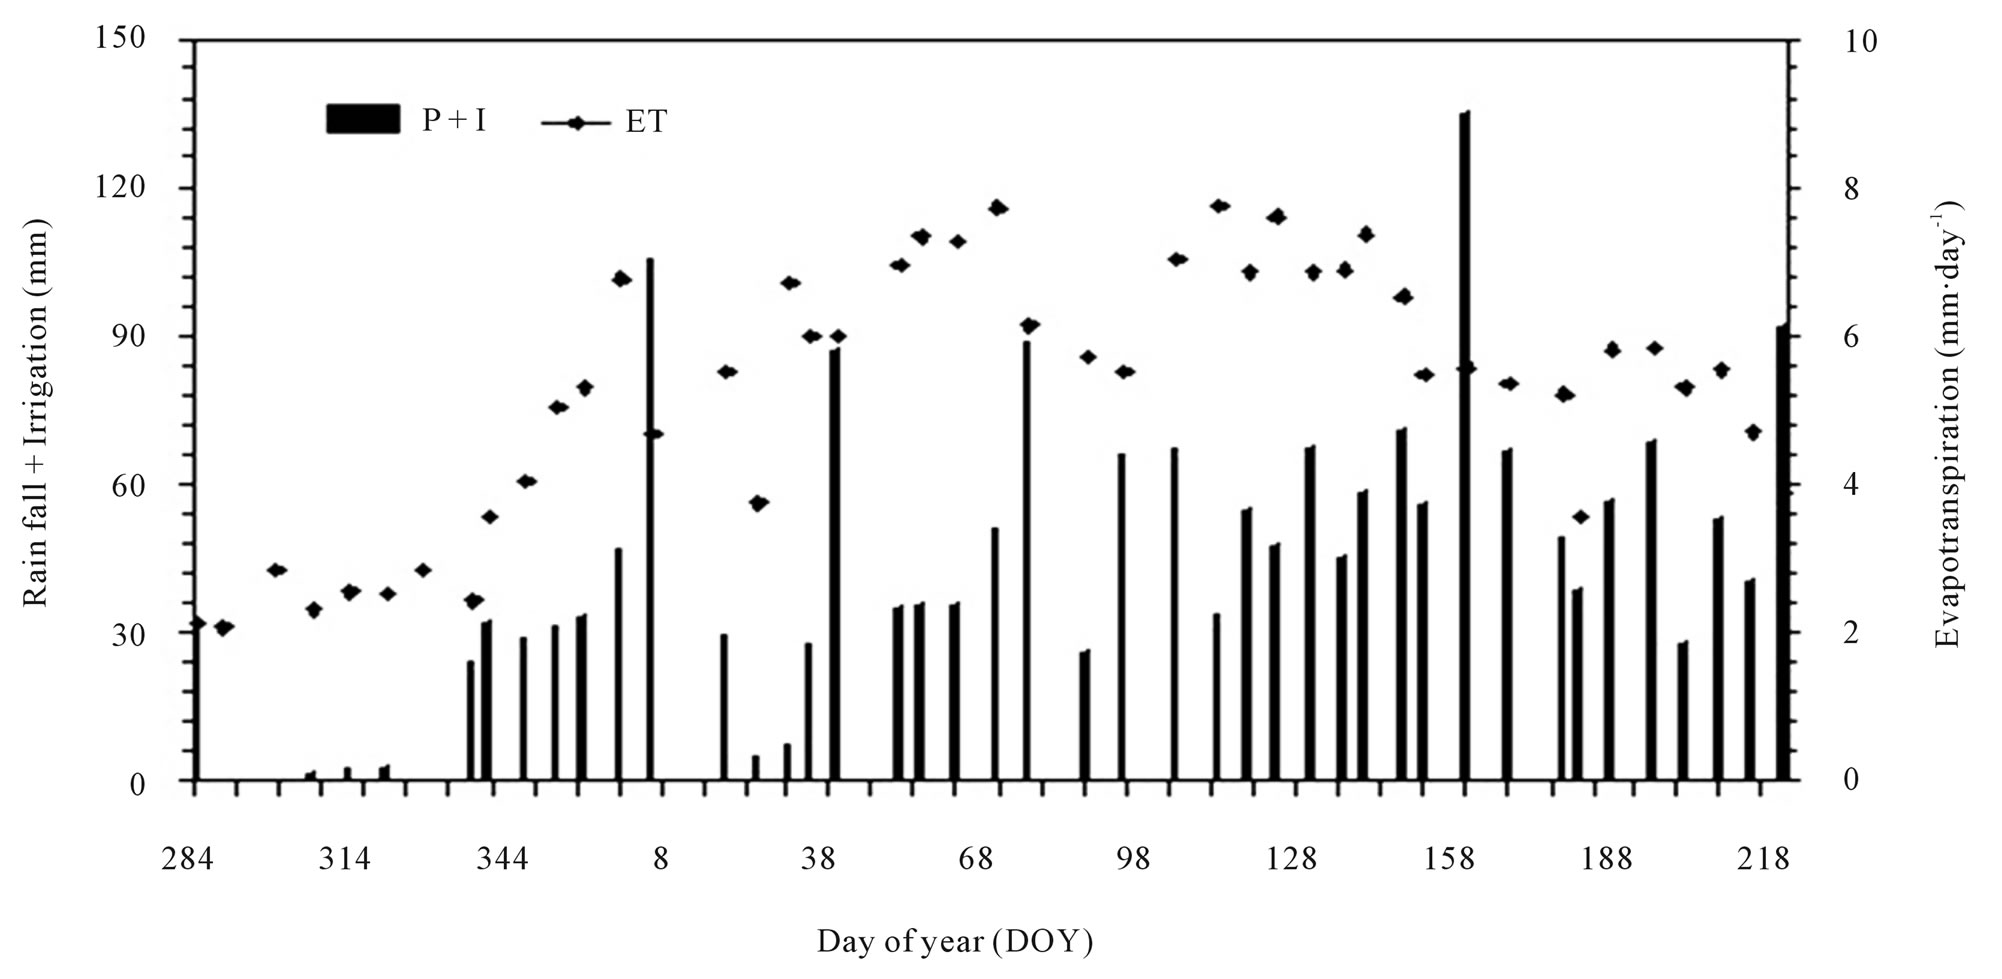
Figure 4. Comparison between sugarcane evapotranspiration and water supply (irrigation and rainfall) throughout experimental period.
Although soil water content was recorded at regular times at depths of 0.10, 0.20, 0.30, 0.40, 0.50, 0.70, 0.80, 0.90 and 1.0 m, the soil water storage was calculated between the soil surface and a depth of 0.60 cm using the trapeze rule, allowing for computing the evolution of evapotranspiration with time in the crop root zone. The cumulative change in soil water storage over a depth of 0.60 cm and deep drainage as a function of time for the crop season under study is presented in Figure 5. In general, the increase in water supply had a noticeable effect on soil water storage and deep drainage. The highest deep drainage was observed at the end of the midseason stage followed by a considerable increase in the cumulative soil water storage. This can be explained by the exceptional high rainfall of 75 mm within 7 days of irrigation in June resulting in increased subsoil water which caused drainage.
At the beginning of the growing season, consecutive rainy days with low rainfall and no irrigation were observed, which reduced the soil water storage and conesquently did not provide deep drainage. Daily average ET calculated over 7-day periods using the dual crop coefficient approach was compared with the corresponding daily average ET using single crop coefficient as shown in Figure 6. Due to normal data scatter and in order to compare to measured ET values, ET values by crop coefficients were reported as 7-days. The seasonal pattern of evapotranspiration estimated by the dual crop coefficient was similar to that by single crop coefficient, but there existed differences in the magnitudes. The estimated ET from the Kc dual overestimated significantly the ET from Kc single, especially during and after mid-season due to high water application.
The values of ET from dual crop coefficient ranged from 1.05 to 9.05 mm·day−1, with average ± standard deviation of 4.47 ± 1.05 mm·day−1, while ET from Kc single ranged from 1.64 to 8.86 mm·day−1, with average ± standard deviation of 4.16 ± 1.63 mm·day−1. These ET ranges were significantly higher than those for measured ET which varied from 1.05 to 7.76 mm·day−1. This was probably caused mostly by the fact that measured ET from soil water balance responded primarily to the amount of water applied. Our results of measured ET are consistent with other studies. Average measured daily evapotranspiration rates can be as high as 7.4 mm during the summer months for sugarcane growing areas in Australia (Australian Bureau of Meteorology, http://www.bom.gov.au/). When determining crop coefficients and water-use estimates for sugarcane based on the long-term Bowen ratio energy balance measurements in Australia and Swaziland, Inman-Bamber and McGlinchey [10] (2003) found similar results for ET. The data showed that minimum ET rates occurred during August through December (2 - 4 mm·day−1) and maximum ET rates (6 - 9 mm·day−1) occurred during March through May throughout mid-season stage. Similar results were obtained by Moroizumi et al. [32] (2009) when estimating the actual evapotranspiration of rice and sugarcane using micrometeorological data and crop coefficients for a semi-humid tropical climate in Northeast Thailand. For the same region, [6] Watanabe et al. (2004) found ET rates for the sugarcane field ranging between 2 and 6 mm per day
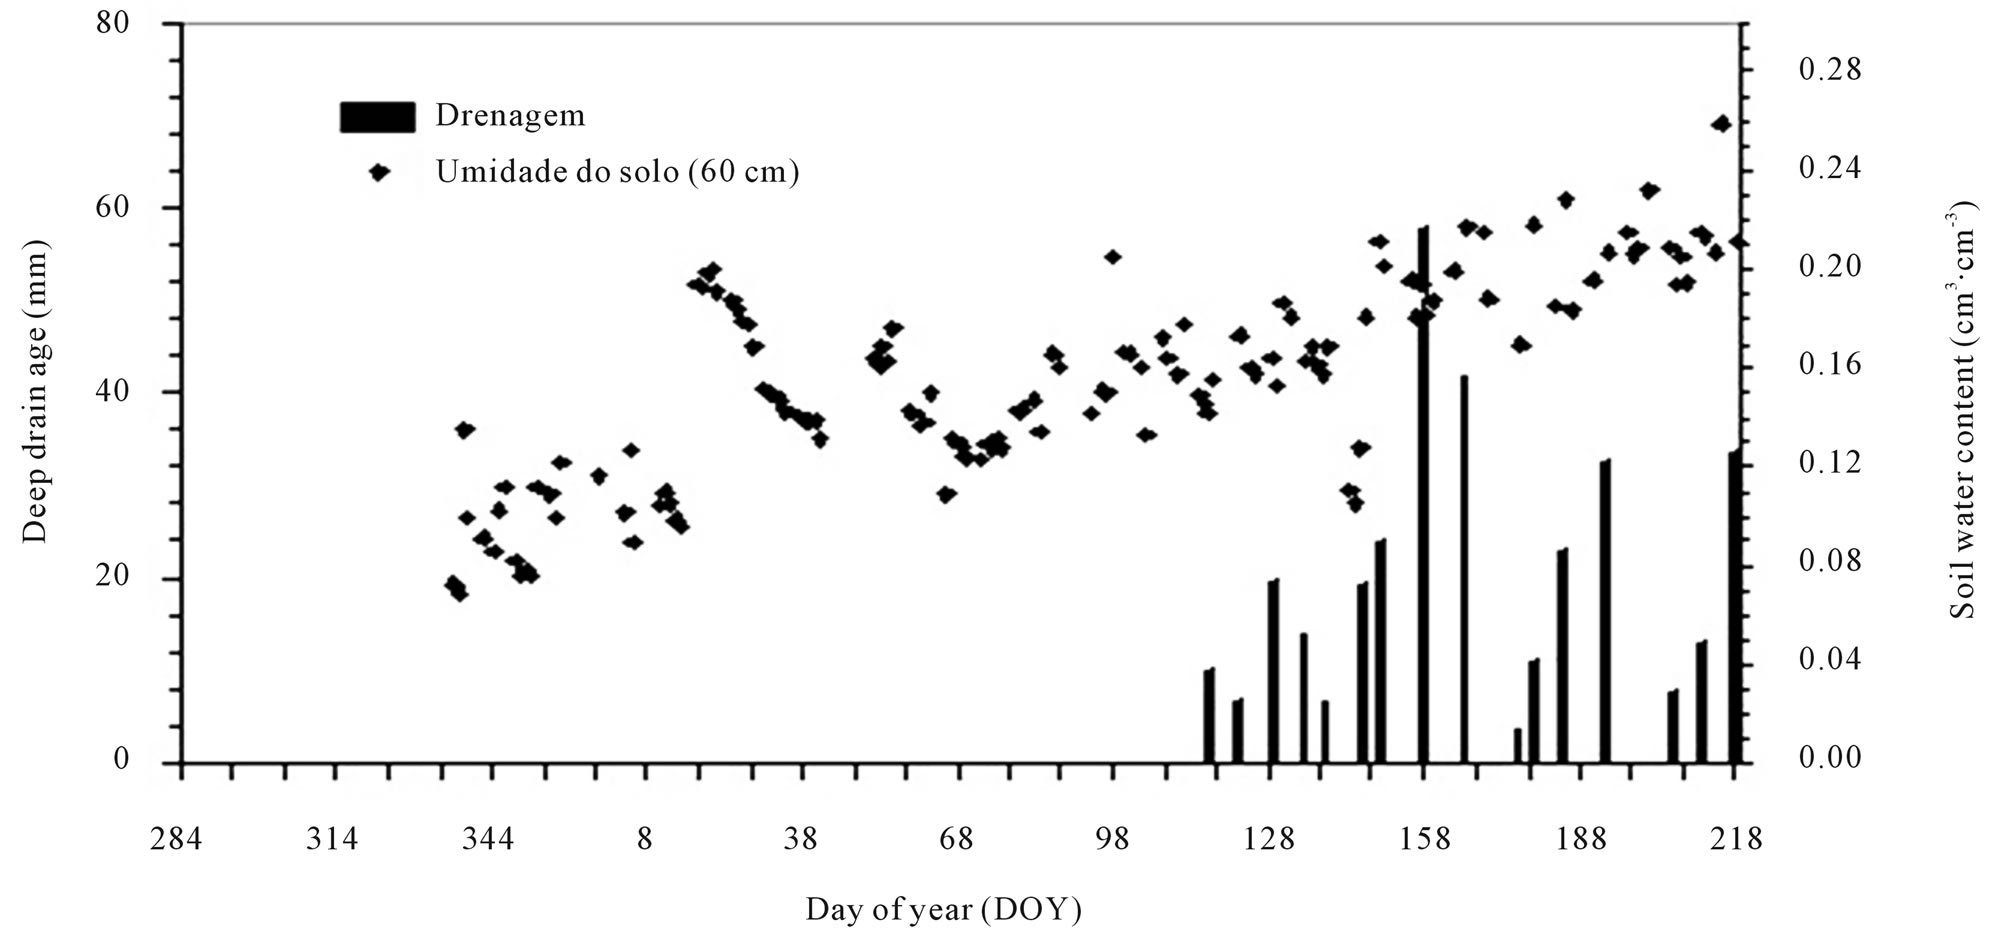
Figure 5. Evolution of cumulative soil water storage and deep drainage with time for the crop season under study.
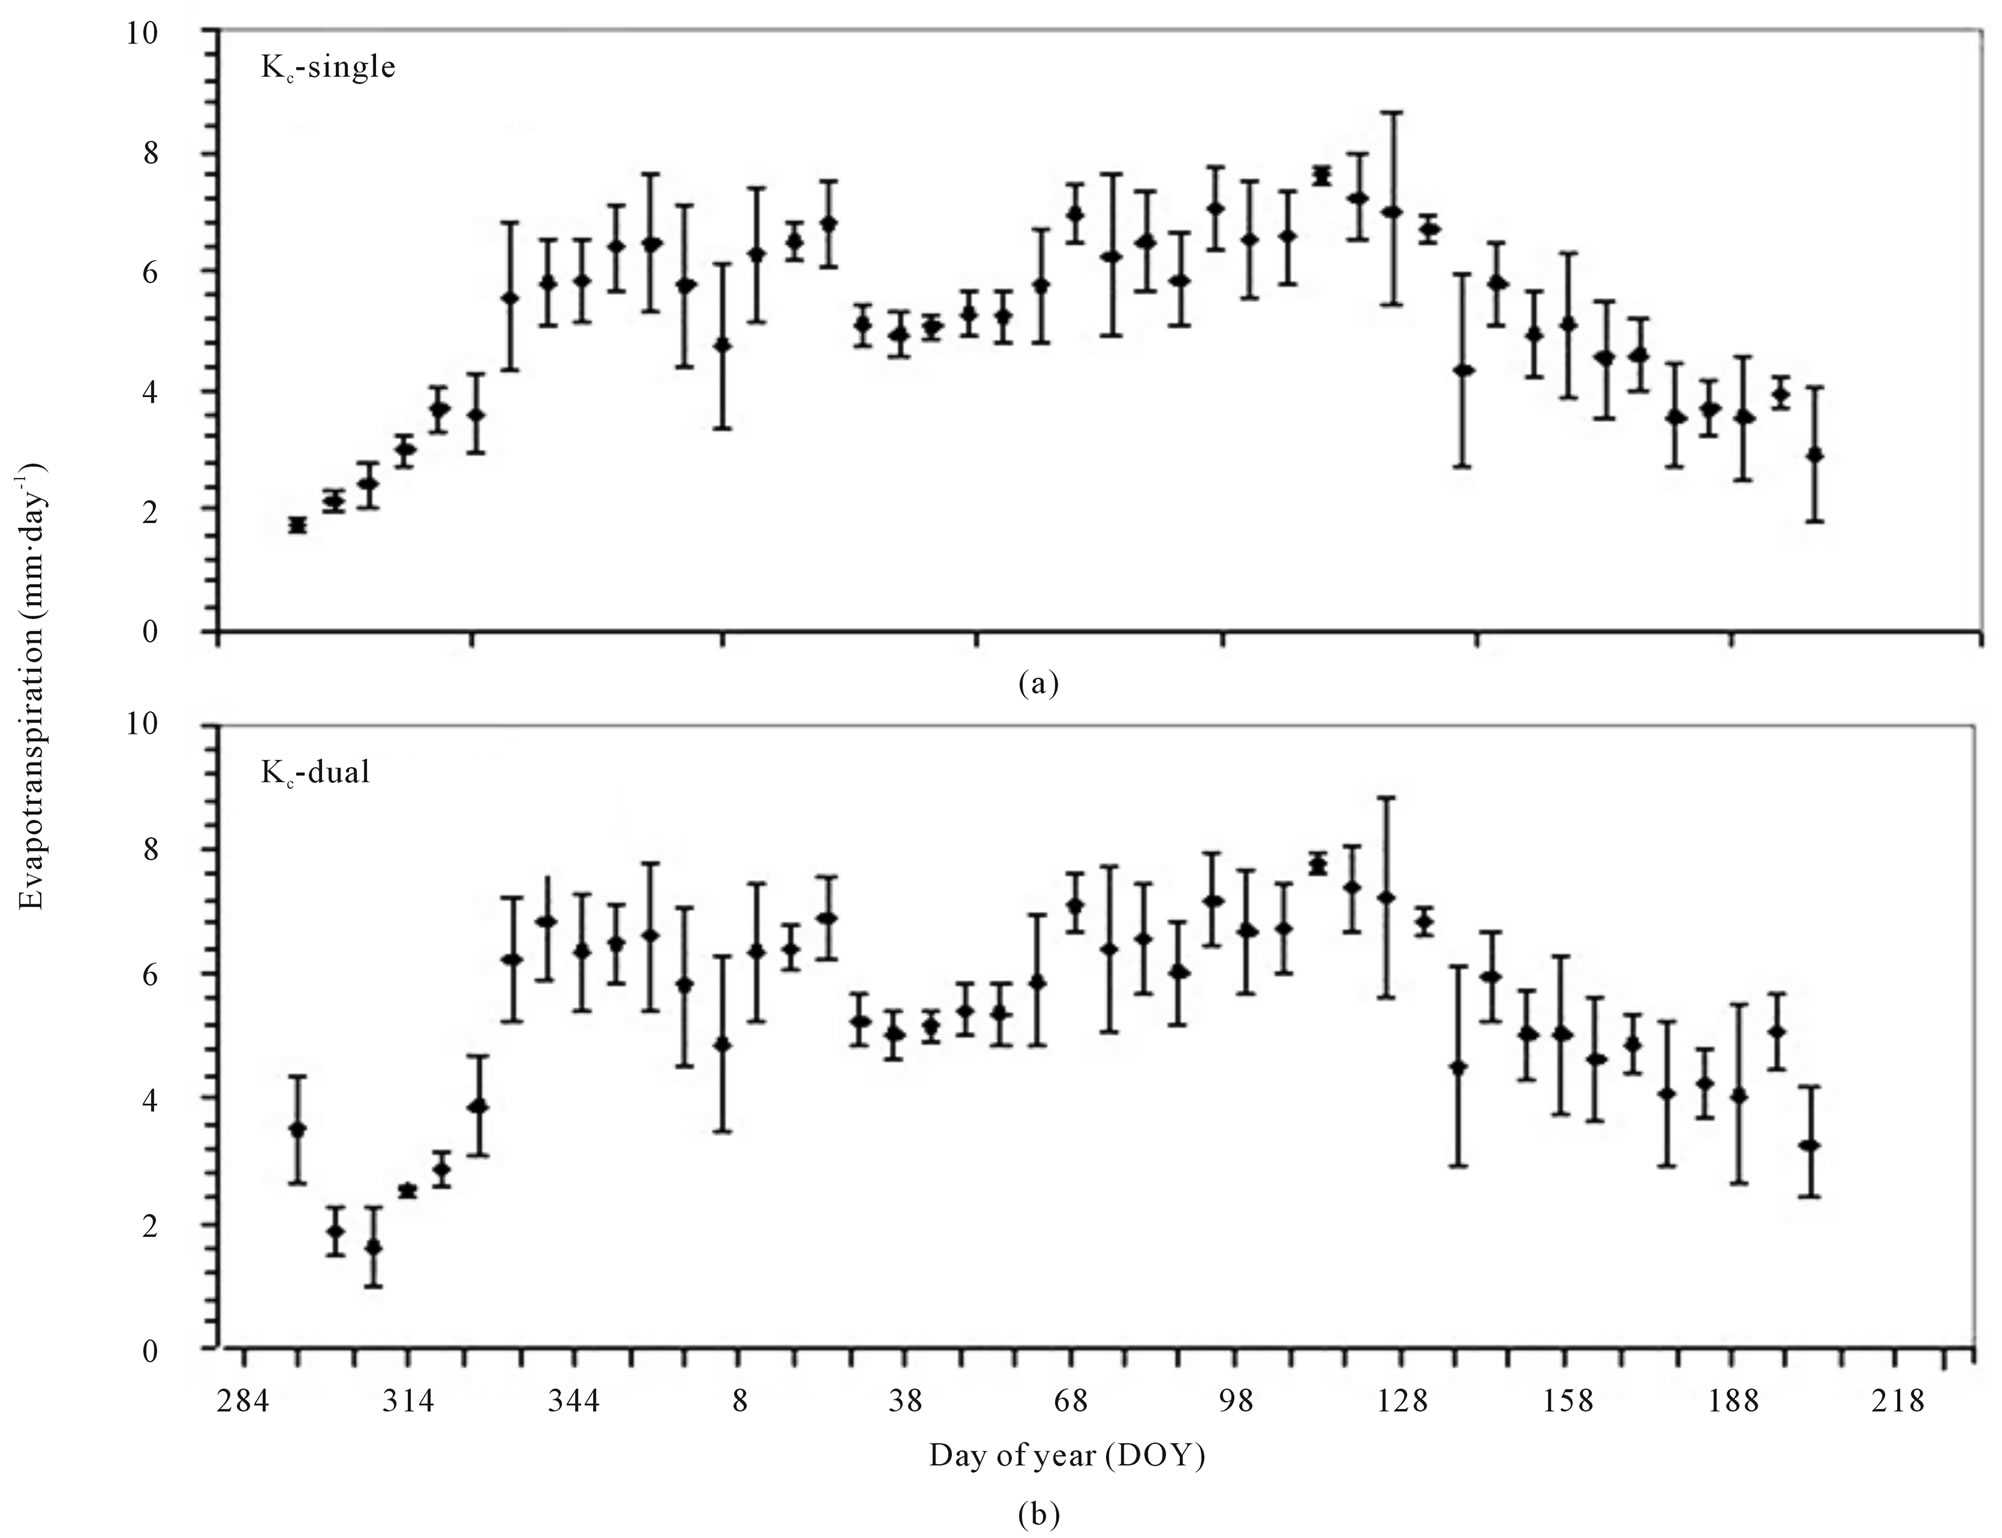
Figure 6. Time course for calculated evapotranspiration on a sugarcane crop field based on single and dual crop coefficients (Kc- single and Kc-dual). Points indicate 7-day averages of daily ET and bars represent the standard error.
during the rainy season.
The total ET values from Kc single and Kc dual were as 1595.6 and 1656.5 mm per year, respectively. On the other hand, the total measured ET was 1645.8 mm per year. The curves of dual crop coefficient, basal crop coefficient and soil evaporation coefficient during the initial, development, mid-season and late season growth stages for sugarcane following the FAO-56 dual Kc approach are shown in Figure 7. The modeled Kc dual curve was consistent with the observed Kc values derived from field soil water balance (Figure 1). At the initial growth stage Kc dual remained constant and equal to Kcb (0.15). During this stage, the soil evaporation coefficient (Ke) was the dominant component of Kc dual due to high frequency of irrigation and not much crop covered ground. Where the topsoil was wet, following rain or irrigation, Ke was maximal [16] (Allen et al., 1998). During the development stage, both Kcb and Kc dual increased quickly to the maximum at the mid-season stage, where they remained constant during all stages, and there after Kcb decreased rapidly toward the late season, while Kc dual was quite variable but with a decreasing trend. Inversely, the Ke data exhibited a decreasing trend during the development stage, with declines close to zero at the mid-season stage as a consequence of the increase in vegetative cover. As opposed to the reduction in Kcb, Ke
increased during the late season due to the reducing of the degree of soil cover with vegetation. Therefore, the lowest Ke values were recorded during the mid-season growth stage, when LAI was high. On other hand, higher Ke values during initial growth stage were attributed to small LAI (Figure 1) and little plant growth.
The soil evaporation (Ev = ETo × Ke) for the entire growth season of sugarcane was 220.56 mm, ranging from 0.06 to 4.03 mm·day−1. As can be deduced from the results, the transpiration component from the dual crop coefficient calculated by using the FAO-56 method was 1435.9 mm, while the evaporation component accounted for 13% of the total evapotranspiration. Similar to Ke, the highest Ev values were recorded at the initial growth stage due to the high frequency of irrigation and little plant growth. In spite of high LAI, high evaporative demand and good water supply were determinants to achieve high Ev rates during the late season. The ET calculations by using dual crop coefficient (FAO-56 method) indicated that the sugarcane at the experimental site was not under moisture stress because the water stress coefficient was always 1 throughout the whole growth season. This is mostly due to the high amount and frequency of irrigation application. This type of water management is typical for sugarcane production in Brazil.
Comparison of daily values of ET measured with soil water balance and calculated with Kc single and Kc dual on a soil sandy are shown in Table 5. The trends of measured and calculated values of ET by Kc dual were similar to MBD of only 0.04 mm·day−1. However, the measured and calculated values of ET by Kc single were a variance, indicating that calculated ET was lower than measured ET with a high MBD of 0.16 mm·day−1. NRMSD between measured and calculated ET ranged
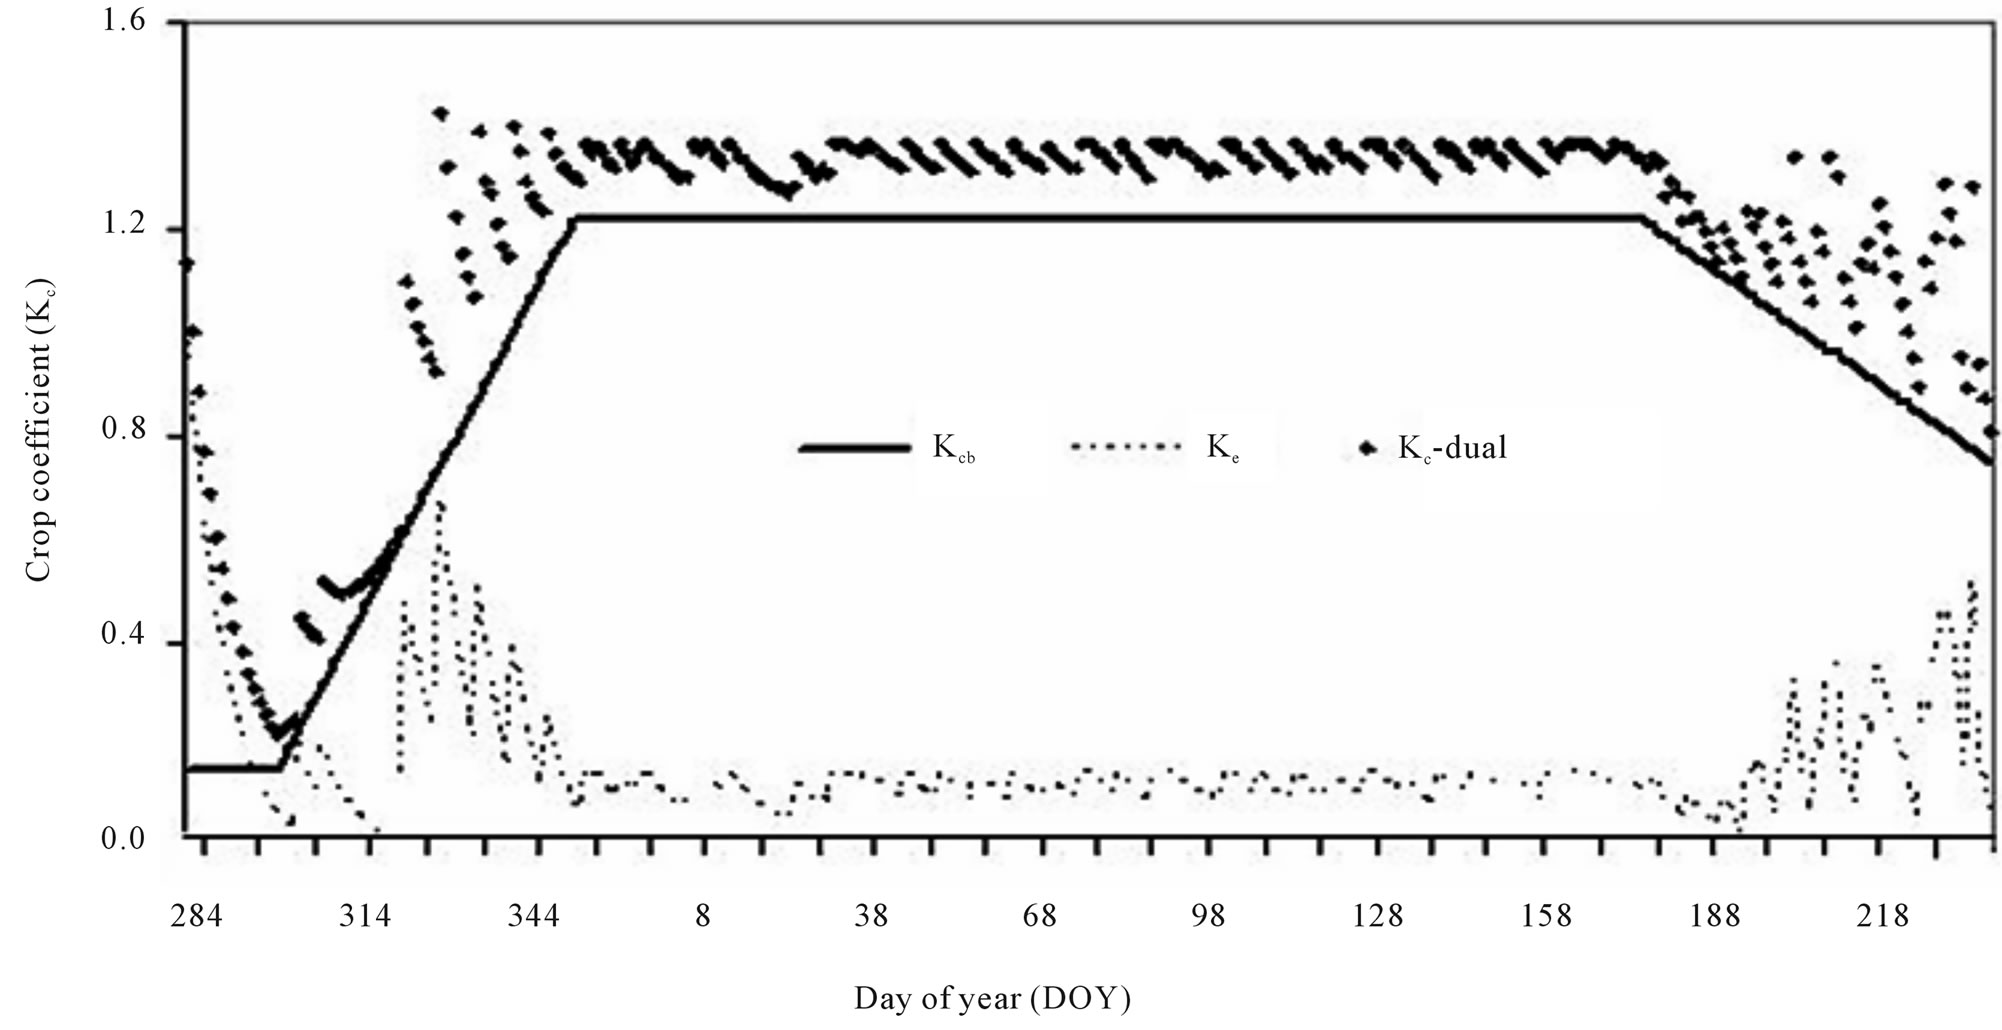
Figure 7. Dual crop coefficient curve (Kc dual) and values of basal crop coefficient (Kcb) and soil evaporation coefficient (Ke) for different development stages of sugarcane growth in the tropical region.
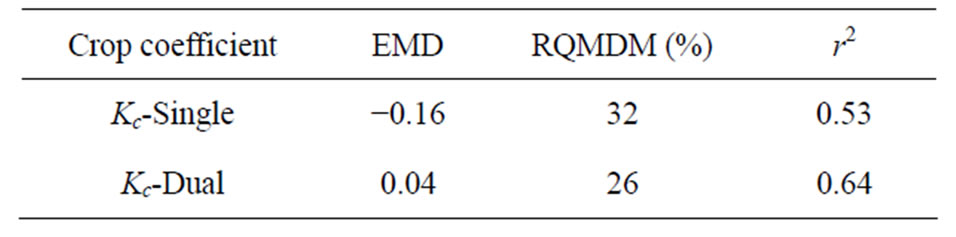
Table 5. Summary of statistical performance of sugarcane evapotranspiration from single (Kc-single) and dual (Kc-dual) crop coefficients and soil water balance (SWB). MBD (mm·day−1) = mean bias difference, NRMSD (%) = normalized root mean square difference, r2 = coefficient of determination.
from 32% to 26% for singe and dual crop coefficients, respectively. Since the value of NRMSD is always positive, representing zero as in the ideal case [27] (Silva et al., 2010), the best fit was found for Kc dual, while the worse fit was obtained for Kc single.
The MBD values were negative for Kc single, indicating a 0.16 mm·day−1 underestimation of sugarcane evapotranspiration. On the other hand, the values of coefficient of determination also show that Kc dual is a better way for determining evapotranspiration. The linear regression coefficient (r2) between measured and calculated values of ET by Kc single was 0.55, with a slope of 0.81 not significant different than zero. On the other hand, the relationship between measured and calculated ET values by Kc dual provides a coefficient of determination of 0.64 with a slope of 0.71, at a 0.01 probability level. These results show that Kc single values for sugarcane recommended by FAO-56 [16] (Allen et al., 1998) are not appropriate for tropical climate. However, the Kc dual provided an acceptable estimation of water requirements for this region. A number of studies have shown that the Kc values can be found in disagreement between local calculated Kc and those reported in the literature (Azevedo et al. [31], 2003; Silva et al. [33], 2009).
4. CONCLUSION
This study evaluates the applicability of the dual crop coefficient method for sugarcane in a tropical region, Brazil, and compares the estimated ET by the single and dual crop coefficients with the ET measured by the field water balance. In a tropical area with sub humid climate, evapotranspiration ranges over a large interval depending on water amount. Crop coefficient and evapotranspiration for sugarcane are found to be linearly related to the leaf area index. The greatest coefficient of determination value (0.88) of the relationship with the LAI is that for Kc compared to r2 value of 0.67 for ET and LAI. However, the r2 value for the relationship between ET and Kc from initial to mid-season stages (0.84) is greater than that for the whole season. The maximum ET rates occurred in the mid-season stage, ranging from 6 to 9 mm·day−1. The daily ET calculated using Kc dual are comparable to ET calculated by soil water balance. The recommended crop coefficient values derived from field soil water balance during the initial, mid-season and late stages for sugarcane growth in tropical region are 0.56, 1.43 and 1.32, respectively. These values are consistently higher than those suggested by FAO-56 for sugarcane. The most commonly used methods for estimating ET demand considerable instrumentation, namely, the soil water balance and micrometeorological methods. Indeed, some methods are more suitable than others in terms of convenience, accuracy or cost for the measurement of ET at a particular spatial and/or a particular time scale. The dual crop coefficient method can provide accurate estimates of sugarcane ET at both daily and seasonal time scales in the tropical regions when appropriate instrumentation is not available. Statistical tests show that the observed differences between values from the estimated ET by Kc dual and ET calculated by field water balance are not significant. However, the ET values calculated from Kc single underestimates those obtained from soil water balance measurements with RQMDM by 36% and EMD by −0.16 mm·day−1.
REFERENCES
- Menossi, M., Siva-Filho. M.C., Vincentz. M.C., VanSluys. M.A. and Souza. G.M. (2008) Sugarcane functional genomics: Gene discovery for agronomic trait development. International Journal of Plant Genomics, 1, 1-11. doi:10.1155/2008/458732
- Pinto, L.F.G., Bernardes, M.S., Stape. J.L. and Pereira, A.R. (2005) Growth yield and system performance simulation of a sugarcane—Eucalyptus interface in a subtropical region of Brazil. Agriculture, Ecosystems & Environment, 105, 77-86. doi:10.1016/j.agee.2004.05.003
- Silva, V.P.R., Sousa, F.S.S., Cavalcanti, E.P., Souza, E.P. and Silva, B.B. (2006) Teleconnections between sea-surface temperature anomalies and air temperature in northeast Brazil. Journal of Atmospheric and Terrestrial Physics, 68, 781-792. doi:10.1016/j.jastp.2005.12.002
- Lebourgeois, V., Chopart, J.L., Bégué, A. and Mézo, L.L. (2010) Towards using a thermal infrared index combined with water balance modeling to monitor sugarcane irrigation in a tropical environment. Agricultural Water Management, 97, 75-82. doi:10.1016/j.agwat.2009.08.013
- Wiedenfeld, N. (2008) Effects of irrigation water salinity and electrostatic water treatment for sugarcane production. Agricultural Water Management, 95, 86-88. doi:10.1016/j.agwat.2007.10.004
- Watanabe, K., Yamamoto, T., Yamada, T., Sakuratani, T., Nawata, E., Noichana, C., Sributta, A. and Higuchi, H. (2004) Changes in seasonal evapotranspiration. soil water content and crop coefficients in sugarcane, cassava and maize fields in Northeast Thailand. Agricultural Water Management, 67, 133-143. doi:10.1016/j.agwat.2004.02.004
- Chabot, R., Bouarf, S., Zimmer, D., Chaumont, C. and Duprez, C. (2002) Sugarcane transpiration with shallow water-table: Sap flow measurements and modeling. Agricultural Water Management, 54, 17-36. doi:10.1016/S0378-3774(01)00139-1
- Inman-Bamber, N.G. and Smith. D.M. (2005) Water relations in sugarcane and response to water deficits, Field Crops Research, 92, 185-202. doi:10.1016/j.fcr.2005.01.023
- Choudhary, O.P., Josan, A.S., Bajwa, M.S. and Kapur, M.L. (2004) Effect of sustained sodic and saline-sodic irrigation and application of gypsum and farmyard manure on yield and quality of sugarcane under semi-arid conditions. Field Crops Research, 87, 103-116. doi:10.1016/j.fcr.2003.10.001
- Inman-Bamber, N.G. and McGlinchey, M.G. (2003) Field Crop coefficients and water-use estimates for sugarcane based on long-term Bowen ratio energy balance measurements. Crop Research, 83, 125-138. doi:10.1016/S0378-4290(03)00069-8
- Omary, M. and Izuno, F.T. (1995) Evaluation of sugarcane evapotranspiration from water table data in the everglades agricultural area. Agricultural Water Management, 27, 309-319. doi:10.1016/0378-3774(95)01149-D
- Van den Berg, M., Burrough, P.A. and Driessen, P.M. (2000) Uncertainties in the appraisal of water availability and consequences for simulated sugarcane yield potentials in São Paulo State. Brazil. Agriculture, Ecosystems & Environment, 81, 43-55. doi:10.1016/S0167-8809(00)00167-5
- Rodrigues, F.A., Laia, M.L. and Zingaretti, S.M. (2009) Analysis of gene expression profiles under water stress in tolerant and sensitive sugarcane plants. Plant Science, 176, 286-302. doi:10.1016/j.plantsci.2008.11.007
- Pereira, L.S., Perrier, A., Allen, F.G. and Alves, I. (1999) Evapotranspiration: Concepts and future trends. Journal of Irrigation and Drainage Engineering, 125, 45-51. doi:10.1061/(ASCE)0733-9437(1999)125:2(45)
- Doorenbos, J. and Pruitt, W.O. (1977) Crop water requirements. FAO Irrigation Drainage Paper No. 24, FAO, Rome.
- Allen, R.G., Pereira, L.S., Raes, D. and Smith, M. (1998) Crop evapotranspiration. Guidelines for Computing Crop Water Requirements. FAO Irrigation Drainage Paper No. 56, FAO, Rome.
- Kashyap, P.S. and Panda, R.K. (2001) Evaluation of evapotranspiration estimation methods and development of crop-coefficients for potato crop in a sub-humid region. Agricultural Water Management, 50, 9-25. doi:10.1016/S0378-3774(01)00102-0
- Qiu, G.Y., Momii, K., Yano, T. and Lascano, R.J. (1999) Experimental verification of a mechanistic model to partition evapotranspiration into soil water and plant evaporation. Agricultural and Forest Meteorology, 93, 79-93. doi:10.1016/S0168-1923(98)00115-4
- Allen, R.G. (2000) Using the FAO-56 dual crop coefficient method over an irrigated region as part of an evapotranspiration intercomparison study. Journal of Hydrology, 229, 27-41.
- López-Urrea, R., Olalla, F.M.S. and López-Fuster, A.M. (2009) Single and dual crop coefficients and water requirements for onion (Allium cepa L.) under semiarid conditions. Agricultural Water Management, 96, 1031-1036. doi:10.1016/j.agwat.2009.02.004
- Liu, Y. and Luo, Y. (2010) A consolidated evaluation of the FAO-56 dual crop coefficient approach using the lysimeter data in the North China Plain. Agricultural Water Management, 97, 31-40. doi:10.1016/j.agwat.2009.07.003
- Flumignan, D.L., Faria, R.T. and Prete, C.E.C. (2011) Evapotranspiration components and dual crop coefficients of coffee trees during crop production. Agricultural Water Management, 98, 791-800. doi:10.1016/j.agwat.2010.12.002
- Silva, V.P.R. (2004) On climate variability in Northeast of Brazil. Journal of Arid Environments, 58, 575-596. doi:10.1016/j.jaridenv.2003.12.002
- Qi, Z. and Helmers, M.J. (2010) The conversion of permittivity as measured by a PR2 capacitance probe into soil moisture values for Des Moines lobe soils in Iowa. Soil Use and Management, 26, 82-92. doi:10.1111/j.1475-2743.2009.00256.x
- Jonckheere, I., Fleck, S., Nackaerts, K., Muys, B., Coppin, P., Weiss, M. and Baret, F. (2004) Review of methods for in situ leaf area index determination Part I. Theories, sensors and hemispherical photography. Agricultural and Forest Meteorology, 121, 19-35. doi:10.1016/j.agrformet.2003.08.027
- Bodner, G., Loiskandl, W. and Kaul, H.P. (2007) Cover crop evapotranspiration under semi-arid conditions using FAO dual crop coefficient method with water stress compensation. Agricultural Water Management, 93, 85-98. doi:10.1016/j.agwat.2007.06.010
- Silva, V.P.R., Silva, R.A., Cavalcanti, E.P., Braga, C.C., Azevedo, P.V., Singh, V.P. and Pereira, E.R.R. (2010) Trends in solar radiation in NCEP/NCAR database and measurements in northeastern Brazil. Solar Energy, 84, 1852-1862. doi:10.1016/j.solener.2010.07.011
- Medeiros, G.A., Arruda, F.B., Sakai, E. and Fujiwars, M. (2001) The influence of crop canopy on evapotranspiration and crop coefficient of beans (Phaseolus vulgaris L.) Agricultural Water Management, 49, 211-224. doi:10.1016/S0378-3774(00)00150-5
- Williams, L.E. and Ayars, J.E. (2005) Grapevine water use and the crop coefficient are linear functions of the shaded area measured beneath the canopy. Agricultural and Forest Meteorology, 132, 201-211. doi:10.1016/j.agrformet.2005.07.010
- Trambouze, W., Bertuzzi, P. and Voltz, M. (1998) Comparison of methods for estimating actual evapotranspiration in a row-cropped vineyard. Agricultural and Forest Meteorology, 91, 193-208. doi:10.1016/S0168-1923(98)00072-0
- Azevedo, P.V., Silva, B.B. and Silva, V.P.R. (2003) Water requirements of irrigated mango orchards in northeast Brazil. Agricultural Water Management, 58, 241-254. doi:10.1016/S0378-3774(02)00083-5
- Moroizumi, T., Hamada, H., Sukchan, S. and Ikemoto, M. (2009) Soil water content and water balance in rainfed fields in Northeast Thailand. Agricultural Water Management, 96, 160-166. doi:10.1016/j.agwat.2008.07.007
- Silva, V.P.R., Campos, J.H.B.C. and Azevedo, P.V. (2009) Water-use efficiency and evapotranspiration of mango orchard grown in northeastern region of Brazil. Scientia Horticuturae, 120, 467-472. doi:10.1016/j.scienta.2008.12.005