International Journal of Geosciences
Vol. 4 No. 1 (2013) , Article ID: 27157 , 19 pages DOI:10.4236/ijg.2013.41016
Analysis and Tectonic Implication of DEM-Derived Structural Lineaments, Sinai Peninsula, Egypt
Geology Department, Faculty of Science, Suez Canal University, Ismailia, Egypt
Email: tarekseleem73@yahoo.com
Received November 4, 2012; revised December 2, 2012; accepted December 31, 2012
Keywords: Sinai Peninsula; Structural Lineaments; Statistical Analysis; SRTM; Image Processing; GIS
ABSTRACT
Sinai Peninsula has fascinating geologic setting and is displaying a diversity of structural lineaments that have greatly influenced the distribution of natural resources and hazards. Shaded relief images derived from SRTM-DEM mosaics were used for the identification, extraction, and mapping of these structural lineaments. Statistical parameters particularly, azimuth frequency, lineament intersection, lengths, and density distribution were analyzed using SPSS software. Two additional new statistical indices; Lineament Relative Abundance Index (LRAI) and Lineament Majority-Minority Index (LMMI) were applied. Moreover, the distribution of the different statistical parameters was illustrated as contour maps through GIS environment. Basically, two dominant clusters; NW-SE and NNE-SSW trends were detected. These trends are related to major fracture systems that are characterized by extensive mean lengths and high proportion values. Furthermore, the northern and central parts of Sinai Peninsula have lower density and intersection of structural lineaments that gradually increase towards the southern part. However, the northern part of Sinai displays wider areas of majority zones than the southern part. This could be attributed to the lower density of lineaments and little tendency for multiple lineament populations. The majority zones are usually associated with NE and NW-SE in the northern part of Sinai, whereas the majority zones are of less abundance in the central and southern parts of Sinai due to the multiple orientations of lineament populations which reduce the tendency for majority. Eventually, the results of the present work could be applicable in the different geologic and environmental aspects that are based on a good understanding of the genetic and spatial relationships of fracture systems. These aspects encompass geodynamics, exploration for mineralization and groundwater, in addition to the mitigation of natural hazards such as flush flooding and earthquakes.
1. Introduction
Sinai Peninsula is located at the northeastern corner of Egypt occupying a surface area of about 61.000 km2. It is bounded from the west by the Gulf of Suez and the Suez Canal, from the east by Gulf of Aqaba, while bordered from the north by the Mediterranean Sea and from the south by the Red Sea (Figure 1).
The geology and tectonics of Sinai are largely affected and controlled by the geodynamic processes that have created the Red Sea rift. Sinai Peninsula is characterized by variable geologic and geomorphologic features where the southern part is occupied by igneous and metamorphic rocks, whereas the central and northern parts are occupied by Phanerozoic rocks. The subhorizontal Mesozoic to Tertiary sediments of Tih Plateau are the main exposed rock units at the central parts, whereas, northward the Mesozoic to Tertiary sediments of “Syrian Arc” structures sink seaward due to Tertiary down-to-the-basin faulting and are hidden under the Quaternary coastal plain and continental deposits, shown in Figure 1.
The extraction and analysis of lineaments from digitally enhanced satellite images and shaded relief maps derived from DEMs can provide valuable sources for regional structural and tectonic studies [1-3]. In arid and semiarid terrains where well-exposed bed rocks are present, as the case of Sinai Peninsula, brittle structures can be easily observed on satellite images.
Although the detection and treatment of lineaments have been applied for mineralization, hydrological, structural and tectonic purposes in limited areas, few attempts have been applied in order to delineate the lineaments of the Sinai Peninsula as a whole. [4,5] used ERTS-1 satellite images and Landsat-1 imagery interpretation techniques to construct a structural lineaments map of Sinai Peninsula on scales 1:500,000 and 1:1,000,000. [6] used Landsat composite image mosaic of Sinai Peninsula in the assessment of the orientation characteristics using frequency histograms for the total numbers and total lengths. [7] studied Um Alawi area in south Sinai and clarified that the NE-trending structural lineaments are easily de-

Figure 1. Location map of the study area.
tectable and have a high percentage of azimuth-frequency. On the other hand, the NE and NW trend sets are the most prevalent ones in both aerial photographs and field measurements.
The statistical treatment of structural lineaments was carried out by [8] who introduced a new technique based on defining the optimal cell dimension for counting LTL (Lineament To Lineaments intersection) and LTC (Lineaments To Cell intersection) and preparing the different density maps. They applied this new technique on the structural lineaments exposed in Wadi El-Arish region in the northern part of Sinai. Also, [9] applied the same technique on the extracted and enhanced lineament by using filtering technique in the western side of the Gulf of Aqaba.
[10] defined three essential lineaments parameters (total number, total length and sum of number of directional lineaments) to determine the photolineament factor that plays an important role in controlling the distribution of mineral occurrences in Saint Catherine area in South Sinai. The selection of optimal cell node and the weighting estimation of each parameter had verified the computability of photolineamnet factor anomalies with the mineralized centers in the investigated area.
[11] used image processing by filtering technique for extraction and mapping structural lineaments of southwestern Sinai. Consequently, the extracted structural lineaments, are classified into major five populations; N30˚E, N50˚E, N30˚W, N60˚W, N-S, and E-W. He proposed a new technique of statistical treatment of lineaments which compromises the counting of the desired lineament populations relative to others in a certain cell dimension putting into consideration that the value of 1 means the complete appearance of lineament in the gird cell and zero value expresses the disappearance of structural lineament. The resulting percentage values were contoured to construct the Relative Abundance map of the desired lineament population. According to the results of Relative Abundance technique, it is found that N30˚E-trending lineaments are prominent in the basement rocks with moderate to high Relative Abundance. On the contrary, the N30˚W and N60˚W trending lineaments are prominent in sedimentary rocks. However, lineament populations including N-S, E-W are not distinctive where they constitute very low to low grades in the major part of the study area.
[2] used SRTM for the auto-detection of the morphotectonic lineaments observed on the Sinai Peninsula and gravity grid data where they are analyzed to characterize the tectonic trends that dominated the geologic evolution. The approach employed consists of DEM shading, segment tracing, grouping, statistical analysis of the distribution and orientation of the lineaments, fault plane characterization, and smooth representation techniques. Statistical quantification of counts, mean lengths, densities, and orientations was used to infer the relative severity of the tectonic regimes. The NW and NE trends showed relatively equal abundances in the Precambrian and the Cambrian whereas the prominence of the NW trends prevailed from the Carboniferous to the Holocene. Lineaments in all formations were near vertical and on average, about 65% showed as strike-slip, 22% as reverse, and 13% as normal faulting styles. Furthermore, the recent significance of the broad structural zones was confirmed by the foci of the earthquake epicenters along and at the intra-plate intersections of the broad lineament zones and at the plate boundaries. The spatial distribution of trends with varying styles of faulting distinguished four main tectonic provinces of marked geodynamics variances.
The main objective of the present study is to extract and map the structural lineaments by using the shaded relief technique applied on SRTM mosaics of Sinai Peninsula. The statistical analysis of extracted lineaments compromised azimuth, mean length, frequency, and intersection of the lineaments. Additional parameters of Relative Abundance Index (RAI) and Majority-Minority Index (MMI) of structural lineaments have been applied. The distribution of the different parameters was displayed as contour maps through GIS environment. Moreover, the tectonic significance of the different lineament populations has been described.
2. Methodology
2.1. Lineament Extraction and Mapping
The study of lineaments extracted from satellite images was carried out in two steps, i.e., lineament extraction and derivation of lineament properties. For extraction and mapping the structural lineaments, a shaded relief image processing technique of SRTM-DEM mosaics of Sinai Peninsula, has been used. This image has an advantage of the possibility of setting up the position (azimuth and inclination) of scene illumination, thus emphasizing the different existing structural lineaments orientations due to the enhancement of directions perpendicular to lighting in spite of parallel ones. Shaded relief images created from digital elevation models (DEMs) are helpful in identifying lineaments in different distinct relief and topography. The first step was to identify linear topographic features from the DEM, where eight separate shaded relief mosaics were produced and then combined into one image (Figure 2).
In the present study, the structural lineaments were extracted from compiled shaded relief derived-SRTM mosaics with different sun azimuth values including 0, 45, 90, 135, 180, 225, 270 and 315. The sample area (represented as square in Figure 2) with different sun azimuth is shown in Figures 3(a)-(h), respectively. Sinai Peninsula was divided into grids and the different statistical parameters of extracted structural lineaments were counted. Moreover, a complete mosaic of shaded relief images was created and displayed through a GIS environment by using Arc/GIS 9.3 software, where 3991 structural lineaments have been identified, (Figure 4). Finally, the different lineament density maps were constructed by counting the lineaments within a moving 10' × 10' search window (grid cell).
2.2. Statistical Analysis of Structural Lineaments
Conventionally, statistical analysis of lineaments is done by using frequency or length against azimuth histograms, rose diagrams and the different lineament density maps. In the present study, two additional statistical factors were used; the Lineament Relative Abundance Index (LRAI) and the Majority-Minority Index (MMI) of structural lineaments. Also, SPSS program was used to analyze the statistical relationships between the different lineament groups.
The term of Relative Abundance is described by [11] to describe the ratio of the total number of a specific structural lineament in a certain azimuth group relative to

Figure 2. Shaded relief mosaics covering Sinai Peninsula, the square indicates a sample area of applying shaded relief with different sun azimuth values, shown in Figure 3.
other counted lineament in a definite grid cell dimension. In structural studies with complex relationships between the different structural trends, it is preferable to count the density of lineament populations in terms of their relations to other azimuth groups.
In the Relative Abundance method of counting lineaments, the value of relative abundance ranges between 0 and 1. The zero value indicates the absence of the lineament in certain azimuth group in the grid cell relative to others, whereas the value of one expresses the complete appearance of the desired lineament population relative to others putting into consideration that the lower the value of this ratio the higher the possibility of intersection of the different populations and vice versa, (Figure 5).
In the present study, it is suggested for the Relative Abundance (RAI) values to be converted into zones of majority and minority expressed as percentages. These values are termed Lineament Majority Minority Indices (LMMI), based on a critical value delimiting or defining the level of majority and minority of a definite azimuth group. In the next section, the distribution of the different statistical parameters will be described, followed by the description of spatial relationship between the different lineaments populations.
3. Results
3.1. Distribution of Statistical Parameters
3.1.1. Lineaments Azimuth
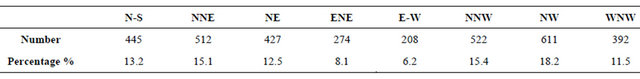
In the present study, lineaments were initially classified into eight azimuth groups or lineament populations; N, NNE, NE, ENE, E, NNW, NW, and WNW. The extracted structural lineaments map is shown in Figure 4, and the analysis is listed in Table 1. Four major structural trends are obviously identified, these are: NW, NNW, NNE, N-S, and to a less extent NE. On contrary, structural trends like WNW, ENE, and E-W appear to be of less abundance. Simply, there are two main dominant clusters; NNW-SSE to NW-SE and N-S to NNE-SSW that representing the regional fracture systems controlling the tectonics of Sinai.
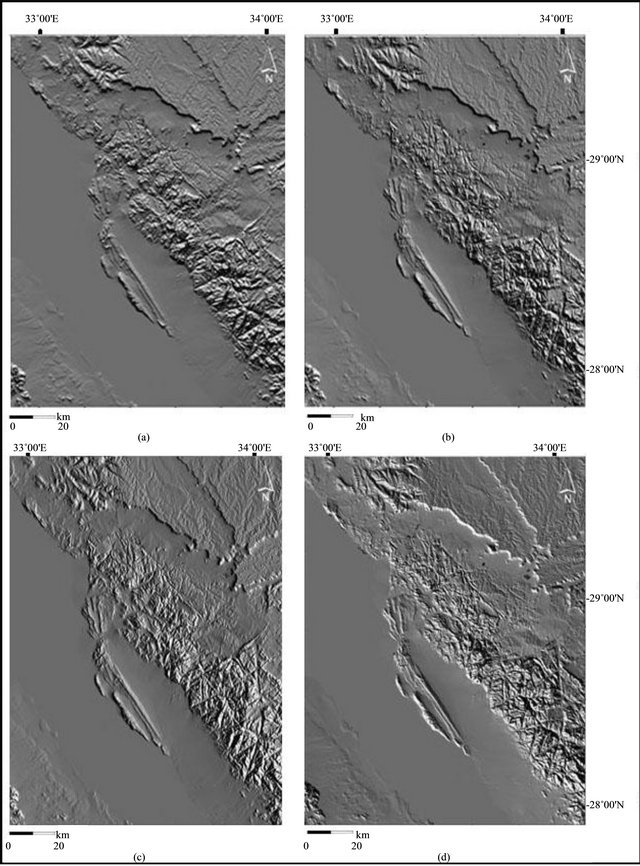

Figure 3. Applying shaded relief with different sun azimuth (0, 45, 90, 135, 180, 225, 270 and 315) denoted from (a) to (h), respectively.
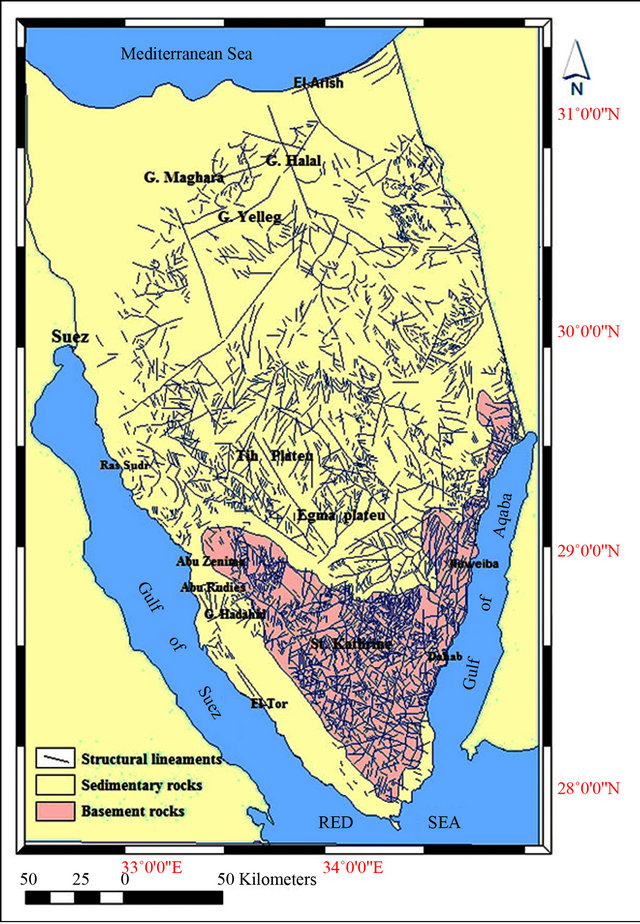
Figure 4. Structural lineaments map of Sinai Peninsula, derived from shaded relief image mosaics.

Figure 5. Counting relative abundance of N-S structural lineament.
Table 1. The number and percentage of the extracted structural lineaments.
3.1.2. Lineaments Mean Length
The lineament lengths were measured through a GIS environment and expressed as mean lengths. The mean length was calculated within each cell and then the resulting values were contoured allover Sinai.
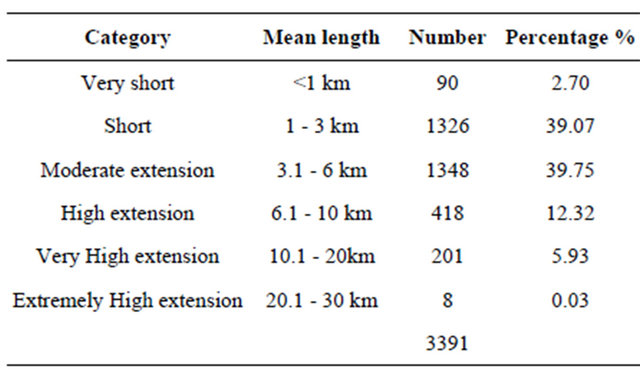
The mean length values were classified into 5 categories; very short < 1 km/cell , short, (1 - 3 km), moderate extension (3.1 - 6 km), high extension (6.1 - 10 km), very high extension (10.1 - 20 km) and extremely high extension (20.1 - 30 km). The mean length contour map is illustrated in Figure 6(a) and Table 2.
3.1.3. Lineament Density
The lineament density can be expressed in variable ways, in the present study it is expressed as the number of lineaments per grid unit area. The resulted lineament density was classified into five categories; low (0 - 20), moderate (21 - 40), high (41 - 60), very high (61 - 80), and extremely high (>80).
The major part of Sinai is characterized by low to moderate lineament density. The lineament density increases toward the southern and southeastern sectors where the values range from high to extremely high density (Figure 6(b)). This could be attributed to the presence of basement rocks which have high capabilities to express the different fracture systems.
3.1.4. Lineament Intersection
The lineament intersection contour map is principally used to estimate the areas of diverse lineament orientations, and the same categories used for describing lineament density are also used for lineament intersection. The lineament intersection intensity contour map (Figure 6(c)), shows that the major parts of Sinai, particularly the northern and middle sectors, are characterized by low to moderate intersection values. However, the values increase gradually towards the southern part of Sinai where maximum values were recorded.
3.1.5. Lineaments Relative Abundance Index (LRAI)
The Relative Abundance index of the structural lineaments of different azimuth groups was calculated allover Sinai and the values are contoured. The resulted contour maps shows five categories; very low (0 - 0.20), low (0.21 - 0.4), moderate (0.41 - 0.60), high (0.61 - 0.8), and very high (0.81 - 1).
By applying the factor analysis technique on the different lineament populations, it is possible to combine the groups that have a significant correlation coefficient equal or greater than 0.5. These groups will have more or less similar (LRAI) values, thus avoiding the repetition (Tables 3 and 4). Moreover, these groups are found to have close tectonic relationship.
Actually, azimuth groups like N, NNE, NW, and NNW will be described as pair groups (where r ≥ 0.5). According to the values of the factor analysis technique, the grouping pairs will include N-NNE and NNW-NW. On the other hand, azimuth populations like E, ENE, NE, and WNW will be described individually (r < 0.5).
The analysis of the Principal Component (PC) (Tables 3 and 4) showed that the correlation between the different lineament populations is affected mainly by two factors; F1 and F2. The first factor (F1) is suggested to be the lineament length and the second is attributed to either lineament density or intersection. As the lineament density increases, the possibility of intersection also increases, which will have a negative effect on the lengths of the different lineament populations.
As described above, there are four major azimuth groups which correspond to NW, NNW, NNE, and N-S lineament populations. In addition, a subordinate set of NE-trending lineaments can also be identified.
The N-S and NNE-SSW structural lineaments have maximum correlation coefficient values r = 0.62 (Table 3). The major part of Sinai is characterized by very low to low relative abundance (less than 0.4) of both N-S and NNE-SSW structural trends. The moderate values (0.4 - 0.6) of NNE-SSW have limited extension represented by dispersed spots in the northern and middle sectors of Sinai. Lineaments belonging to NNE-SSW populations are generally common in some spots in the northern part and along the topmost part of the Gulf of Aqaba where it attains its maximum values. However, the middle part of Sinai exhibits low relative abundance of N-S trend (Figures 7(a) and (b).
The NW-SE and NNW-SSE structural lineaments have a correlation coefficient of (r = 0.56) The NW-SE trending structural lineaments define one of the most important lineament populations of Sinai. The NNW-SSE structural lineaments, to a large extent, follow the distribution pattern of NW-SE lineament population especially in areas that are associated with moderate to higher values. The NW-SE and NNW-SSE lineament populations consist of long and continuous structural lineaments, which may reach several tens of kilometers.
However, higher concentration of NW-SE and NNW-

Figure 6. Distribution contour map of (a) Mean length, (b) Density, and (c) Intersection of structural lineaments.
SSE structural lineaments, relative to other directions, is noticeable in the western parts of Sinai especially along the Gulf of Suez. Whereas, in other parts, they are merged with other populations with different proportions. In contrast to several of other lineament populations, the lineaments of NNW-SSE and NW-SE trends are more or less distributed all over Sinai Peninsula (Figures 7(c) and (d)).
The northern sector of Sinai displays well-defined populations of NE-SW trend where the values reach maximum values. In other parts, this trend is mainly absent except for some spots in southern Sinai which have moderate values (0.4 - 0.6). Basically, lineaments of this trend are usually associated with large-scale faults (Figure 7(e)).
ENE-WSW & WNW-ESE structural lineaments are more common in the northern sector of Sinai than the central and southern sectors. The moderate to higher values are dispersed in some definite zones in the northern sector. ENE-WSW structural lineaments reach their maximum values in the eastern part of North Sinai. Mainly, the moderate and higher values of the WNWESE trend are concentrated at some spots in the northern sectors of Sinai, particularly, the western part. Also, there is a decrease in relative abundance towards the central sector and once again the southern sectors show moderate and
Table 2. Categories, counts, and percentage of mean length of structural lineaments.
higher values (Figures 7(f) and (g)). E-W structural lineaments have very low to low relative abundance at the major part of Sinai. On contrary, a moderate relative abundance of lineaments of E-W trend was recorded at one spot in the northern sector of Sinai, (Figure 7(h)).
3.1.6. Lineament Majority Minority Index (LMMI)
In the present study, it is suggested to convert the Lineaments Relative Abundance (LRA) to express the majority tendency of the different lineament populations through Majority Minority Index (MMI). The conversion method and results constitute the following steps:
1) Overlaying the different relative abundance contour maps of the different lineaments populations through GIS environment. The resulting map represents the minority and majority zones allover Sinai Peninsula with different grades.
2) Obtaining the critical value that delimits the boundary between minority and majority level. The majority (the maximum frequency) is defined in each grid cell all over Sinai and then the average value is calculated.
3) According to the estimated critical value (0.4), the minority zones encompass the relative abundance values of all populations of less than 0.4. This will be equal to
Table 3. Factor analysis of the different lineament populations.
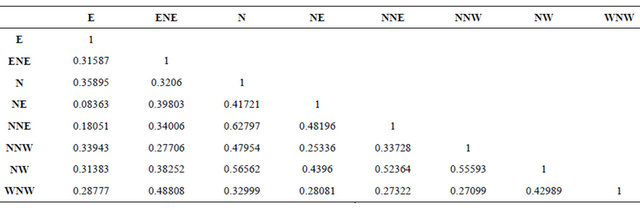
Table 4. The principal component (PC) factors of the different lineaments populations.
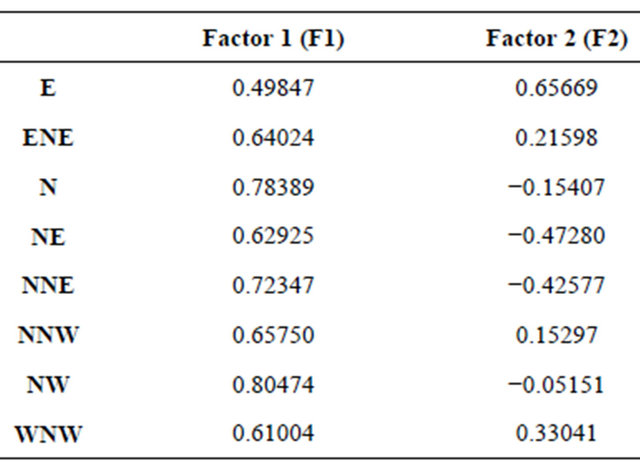
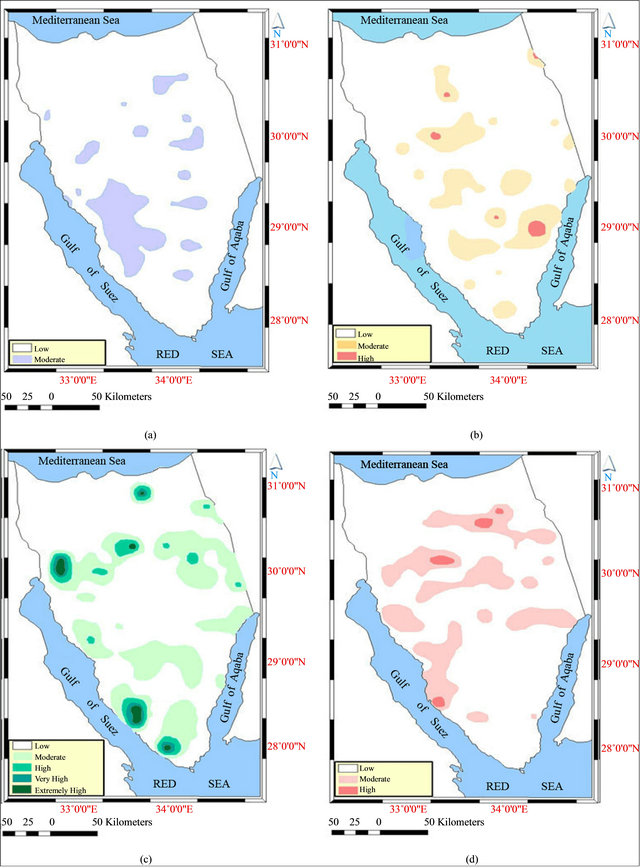
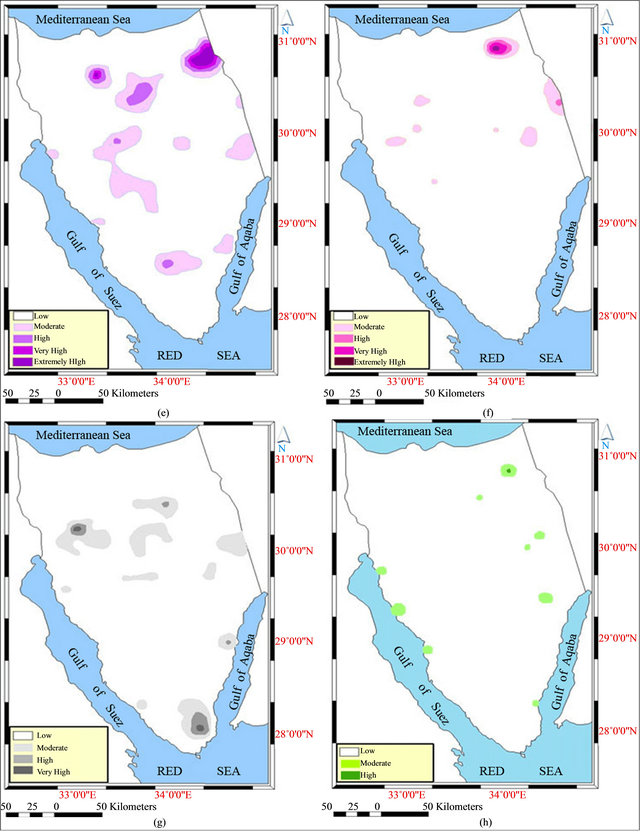
Figure 7. Relative abundance contour map of (a) N-S, (b) NNE-SSW, (c) NW-SE, (d) NNE-SSW, (e) NE-SW, (f) ENE-WSW, (g) WNW-ESE, and (h) E-W structural lineaments.
very low to low grade relative abundance value, represented by white color in Figure 8 which will be neglected from further processing. Nevertheless, the majority zones compromise values greater than 0.4 which is equal to moderate to extremely high values of relative abundance (Figure 8) which will be combined together for obtaining the majority zones of the different populations.
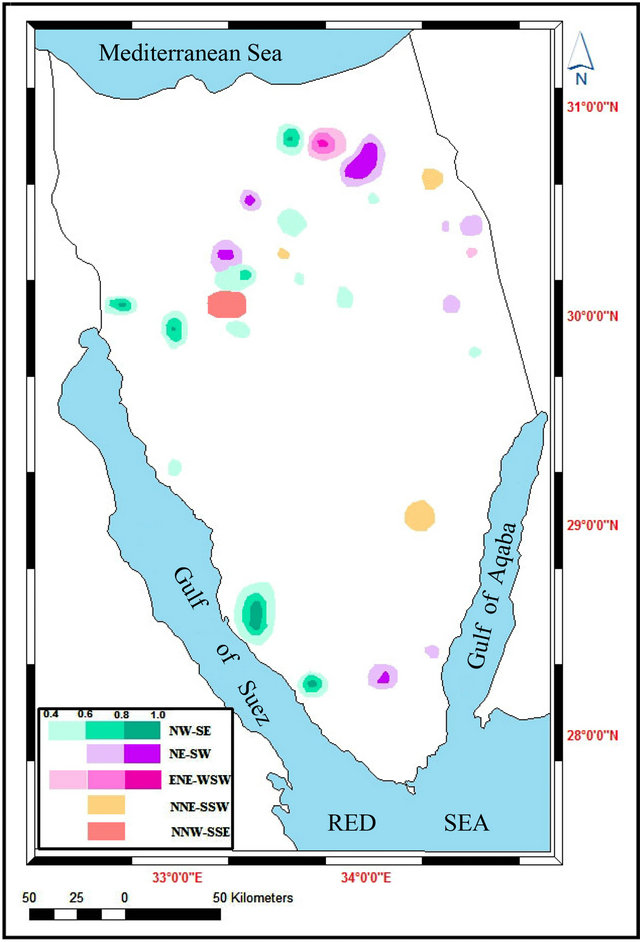
Figure 8. Majority-Minority index map of structural lineaments.
4) The integration of the different relative abundance layers resulted in the intersection of all layers of different grades of relative abundance ranging from moderate to extremely high values; majority zones. The areas with relative abundance equal or greater than 0.4 for a certain lineament population will express the majority zones of such population whereas values less than 0.4 will define the minority zones of the desired population. It is of worth mention to infer the high capability of GIS to carry out these steps.
5) The Lineaments Majority Minority Index (LMMI) map (Figure 8), shows that the azimuth populations encompass NW-SE, NE-SW, NNE-SSW, NNW-SSE, and ENE have a tendency for majority. Whereas, groups like E-W, WNW-ESE, and N-S are considered to be of minority tendency.
6) The northern part of Sinai displays majority zones, while in south Sinai these zones are localized in small spots. It is worthiness to mention that NW-SE has the maximum abundance of majority zones allover Sinai, followed by NE structural trends. The NW majority zones are mainly concentrated in the western sector of Sinai Peninsula, but the NE and NNE are mainly concentrated in the northern part in addition to one spot encountered in the southern part.
3.2. Relationship between the Different Statistical Parameters
3.2.1. Mean Length and Azimuth
The relationship between azimuth and mean length is represented in Table 5. The results can be summarized as follows:
1) Only 2.65% of the structural lineaments of Sinai have length less than 1 km, 79.82% have short to moderate length (1 - 6 km), and 18.53% have extensive to extremely high lineament length (6.1 - 30 km).
2) The low proportion and short lengths of structural
Table 5. The relationship between azimuth and mean length of structural lineaments.

lineaments are assigned mainly to E-W and ENE-WSW. Moreover, lineaments of NW-SE, NNE-SW, and to a less extent N-S and NE-SW are characterized by extensive mean lengths and high frequencies.
3) The structural populations (major trends) which have the highest frequency are found to have the highest standard deviation values. These major trends are attributed to NNE and NW which are more or less tectonically activated and reactivated. On the other hand, the lowest values is attributed to the least frequency of structural lineaments such as ENEto E-trend.
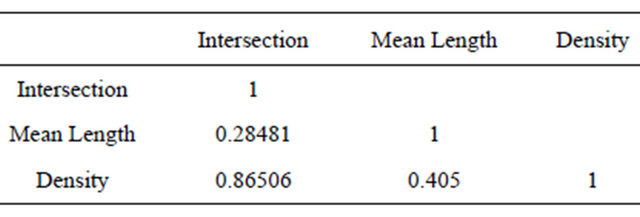
3.2.2. Mean Length, Density and Intersection
The results of factor analysis of the mean length, density, and intersection, in addition to the visual comparison of contour maps, show that both density and intersection contour maps of structural lineaments are nearly similar. This similarity is particularly encountered, in areas of high to very high grade values which may give a clue to the significant relationship between them (Table 6). An insignificant or weak relationship is recorded between mean length and both of density and intersection. It could be concluded that as the values of lineament density increase, the intersection probability will increase.
3.2.3. Relative Abundance Index, Minority Majority Index, and Other Parameters
The comparison of the Relative Abundance (RA) lineament maps of the different azimuth groups with that of mean length shows that the higher values of mean length is mainly concentrated in the southern and southeastern parts. The existence of higher values is associated with NNE-SSW and NE-SW structural trends in the northern and northeastern parts and the presence of NNW-SSE and NW-SE in the southern parts of Sinai.
Moreover, the higher grades of both lineament density and intersection are mainly related to minority zones allover Sinai. Some exception is encountered, where one spot along the Gulf of Suez that have moderate to high values of both density and intersection are attribute to the presence of NW-SE majority zones.
4. Tectonic Significance of Structural Lineaments
There are four major lineament populations that include
Table 6. Factor analysis of lineament intersection, mean length, and density.
NW, NNW, NNE, and N-S. In addition, a subordinate set of NE-trending lineaments can also be identified. These major trends played a great role in controlling the tectonic development of the Sinai subplate which is mainly related to the Red Sea rifting. This rifting is characterized by the presence of two different tectonic phases. The first phase (Red Sea and Gulf of Suez) is characterized by passive subsidence of a continental graben since early Oligocene [12]. The second phase (Red Sea and the Gulf of Aqaba) was initiated by strike slip movements along the newly formed Aqaba Dead Sea transform system. A description of the different lineament populations in the different localities in Sinai Peninsula will be shown in the following paragraphs putting into consideration that the description will emphasis on the major lineament populations.
4.1. N-S and NNE-SSW Structural Lineaments
The Pre-rift history of the Gulf of Suez encompasses N-S faults that are of left-lateral displacement and ESEWNW faults that have right-lateral movement. A similar phase of strike-slip tectonics are observed in other areas of Sinai. The early Miocene faulting is characterized by sinistral extensional movement along the N-S trending faults and oblique extensional movement along NW-SE trending normal faults. NNE-SSW major faults play an important role where they separate the three basins composing the Gulf of Suez; northern, central, and southern ones. On either side of these fault zones, the direction of tilting of fault blocks is reversed. Moreover, at the southern edge of the Gulf of Suez, the N-S faults determine the transition between the shallow water Suez basin and the deep northern Red Sea basin [13]
The N-S and NNE-SSW structural populations have been proposed by many authors to be belonging to the formation of the Gulf of Suez. The presence of the two populations in the Pre-rift rocks and absence in the Synrift rocks may indicate its older age. This phase is related to the early onset of the Gulf of Suez during Late-Eocene-Early Oligocene time [14] The populations of faults striking NS and NNE are characterized by dip-slip sense of movement. The N-S fault segments have their impact on the physiography of Gabal Hadahid area especially in its western part giving the cliff shape of Hadahid monocline. The stress regime prevailed during Late-Cretaceous time which is related to the early onset of the Gulf of Suez [11]. In other localities such as Abu Zenima area some investigators like [15] proved the presence of strikeslip stress pattern as a result of reactivation on the N-S to NNE-SSW normal faulting regime which was prevailing during the Late-Oligocene-Early Miocene with leftlateral slip movement related to the Gulf of Aqaba tectonics.
[16] recorded the same phase in the Gulf of Aqaba and dated it to be of PlioceneRecent time which is not correctable with the tectonics of the Gulf of Suez. The major N-S faults affecting Abu Rudies area show slickensides showing left-lateral movement followed by normal faulting. On the western side of the Gulf of Aqaba where the Neogene outcrops are almost absent so the fault patterns affect mainly the Pre-Cambrian rocks and their Mesozoic-Lower Tertiary sedimentary cover. Numerous N-S strike-slip faults have produced rotation of the minor blocks [17].
Most of the previous works, at the middle and eastern parts of the central province of Sinai Peninsula, attributed the N-S and NNE-SSW structural lineaments to the Gulf of Aqaba trend that is characterized by left-lateral strike slip movement. Wadi Saal area, which is located in the central province, two conjugate shears were recorded. The first is left lateral strike slip fault set trending N to NNE, whereas the second is right lateral strike slip fault set trending NW. Fault-slip data reveal that N25˚W-oriented, subhorizontal compression stress caused the formation of these conjugate shear planes [18]
In the Gulf of Aqaba, the faults trend mainly N-S to NNE-SSW [19,20] which are characterized by left-lateral transform movement linking the Zagros-Tauros area of plate convergence with the Red Sea opening. [21-23] argued for a 105 km left-lateral movement between Arabia and Sinai. The 1800 m deep Gulf of Aqaba is considered to be a succession of NNE-SSW pull apart basins by [24].
The NNE trend in the Precambrian basement is related to the later left-lateral movement distinguished into two phases of offset; 62 km in the Miocene and 45 km in the Pliocene to Recent associated with the Dead Sea Transform fault initiated since the Late Miocene [23] The N-S and E-W trends form subordinate sets likely resulting from older N-S-directed compressional regimes [25]
Large-scale sinistral movements are recorded along the N-S trending steeply (70˚ - 90˚) dipping faults where the displacements on single faults range from a few hundred meters to several kilometers [26] Most of the major N-S faults show at least two successive movements where the last motion is normal and post dates the Late Miocene left-lateral slip where Cretaceous-Eocene and Miocene rocks outcrop, may result from normal faulting along N-S trend.. The E-W extensional tectonics produce the N-S trend narrow grabens of the eastern Sinai by normal motion as well as left-lateral movements in the NESW trending faults [17].
4.2. NW-SE and NNW-SSE Structural Lineaments
The NW-SE fault populations characterized by normal faulting in north Sinai, which postdate the first generation of folding and predates the second one. The trend of theses populations is more or less parallel to the axial trace of the first folding generation. Later, they become curved due to the NW compressive stresses accompanied the formation of the second folding and thrusting. Also, some rotational faults have NW-SE strike direction [27].
[28] clarified that theses folds have an echelon arrangement. The existence of the NW-dipping thrust within and between theses en echelon fold belts probably indicates that the wrenching was convergent E-W to WNW oriented right-lateral strike-slip faults accompanying the folds, whereas the NWnormal faults are related to the tectonic uplift of the folds.
The opening of the Gulf of Suez in the first phase occurred in the early Miocene associated with NNE-SSW extension oblique to the Suez rift trend. Subsequent tectonic events beginning in the Middle Miocene were associated with ENE-WSE extension that shaped the Suez rift [16].
The structure of the Suez rift is dominated by normal faults with sinuous trends that strike roughly parallel to the rift (NW-SE direction) and delimit many tilted blocks [29]. The dominant tectonic movements, especially along the southern portion of the rift, have been extensional. Northward, the rift bends to attain a more northerly strike and the pronounced rift valley disappears, showing that the extension is decreasing markedly.
A thermal activity and basaltic volcancity were dominant through the early stage of the Gulf of Suez rift representing the main event in the development of the NWoriented faults. The strike slip regime trigged some major NW-oriented faults in a right-lateral phase of displacement (e.g. the local faults in south Hadahid, and the major faults in the offshore southern part of the Gulf of Suez) [16]. The focal mechanism solutions of earthquakes on the Suez rift area (proved that those earthquakes have a common fault plane solution characterized by dip-slip normal faulting movements along NW-SE trending faults with a light strike-slip left-lateral components.
At Abu Zenima area, in the central part of the Gulf of Suez, a wide extensional stress regime is prevailing characterized by normal faults trending NW-SE and NNWSSE directions parallel more or less to the Gulf of Suez trend [7]. At Hammam Faroun area, the NW-oriented fault population exits before the Neogene opining of the Suez rift. This NW-oriented Pre-rift fault has been rejuvenated in the Oligocene-Miocene time as a diagonal-slip faults. Field data indicate that these NW-oriented faults are normal, right-lateral or left-lateral diagonal slip. The NNW-oriented normal faults are formed by the ENE-oriented extension in the Oligocen-Miocene time [30].
The NW and the E-W trends dominated in the Holocene with subordinate contributions from the NNE and NNW trends [2]. These trends favor a compressional regime with a horizontal field minimum stress oriented roughly N-S with a mixture of normal and sinistral strikeslip faulting predominant in both the Gulf of Suez rift area. (Active Quaternary fault zones include the NW to NNW fault swarms delimiting tilted blocks and uplifted shoulders along the Gulf of Suez, sometimes very active since the Late Pleistocene [31].
4.3. NE-SW Structural Lineaments
In the northern Sinai, the style of deformation is complex where large uplifted blocks of Mesozoic domes and asymmetrical anticlines oriented N65˚ - 85˚E, as part of the Syrian Arc System, dictate the distribution and character of the Quaternary alluvial plains. The southerly limbs of the anticlines are markedly steeper and crossed by normal and reverse faults that commonly trend at large angles and less commonly are aligned parallel to the fold axis [32]. The reverse and thrust faults are mainly assigned to NNE to NE with maximum peak of N40˚ - 50˚E that accompanied the formation of the second generation of folding [27]. The trend of the open, plying folds with axial trace NE-SW (Syrian arc system) in the Suez area implies left-lateral strike slip motion along the Gulf of Suez [16].
In the Gulf of Suez region, the NE-SW trending faults are essentially normal faults that have affected the stratigraphic sequence from the Precambrian basement to Miocene rocks. The most prevailing fault trends are N25˚E and N65˚E (NE to ENE) i.e. perpendicular to the direction of the Gulf of Suez [15].
In south Sinai, the NW-oriented spatial distribution (80% of the basement) and orientation of the metamorphic core complexes, their mesoscopic and macroscopic structures as well as the fold axes, the associated NEoriented normal faults, and the NE-trending basic and felsic dyke swarms (latest Neoproterozoic to Early Cambrian) are commonly aligned along or parallel to the detected Precambrian tectonic trends [33,34]. These belts were formed during extensional tectonism [34,35].
In many localities in the basement rocks of southern Sinai the NE-SW fault populations are of extensional origin that have been rejuvenated by left-lateral strikeslip faults [36]. However, some investigators have considered the evidences for left-lateral strike slip motion along NE-SW trending faults are limited e.g. [37,38]. Other authors attributed NE-trending fault sets to the Gulf of Aqaba tectonics that took place during the Late Miocene time [7,39]. At Wadi Regeita, the mineralized bodies in an old Copper mine are mainlly controlled by extensional regime of two intersecting fault zones; NWSE and NW-SE. This intersection led to the concentration of intensive mineralization of high potentiality [36].
4.4. E-W Structural Lineaments
Many E-W-striking extensional faults were reactivated as reverse faults and local thrusts at mountains of Maghara, Halal, and Yeleg in northern Sinai [40-42]. Strike-slip movement accompanied by drag folds occurred along EW-trending, dextral transcurrent fault zones in Central Sinai (Themed fault zone) [1]. The major shortening direction in the Late Eocene was oriented nearly NW-SE.
In the central part of Sinai Peninsula, the most prominent structural feature is the Ragabet El-Naam-Themed E-W-oriented wrench fault cutting through the peninsula from the Gulf of Suez to its eastern border with a variable displacement up to 2.5 km [43,44]. This shear zone was detected as two segments [2], the western Ragabet El-Naam and the eastern Themed, with the latter showing a minimum displacement of 300 - 750 m [32]. Southward downthrows differentiate the Ragabet El-Naam segment from the Themed segment where downthrows are to the north [43]. This fault marks the southernmost border of the Early Mesozoic passive continental margin and the front of the Syrian Arc structures in the north. This has been rejuvenated in association with the continued closure of the Eastern Mediterranean basin that proceeded by pure wrenching in the Post-Middle Eocene to PreEarly Miocene [45].
[46] suggested that E-W structures were probably active in the Pre-Rift history of the Gulf of Suez area when they controlled the formation of the Eocene rocks. At Gabal Hadahid area the E-W normal faults are characterized by dip-to diagonal sense of movement where faults of this group play the role of transfer zone of N-S trending faults [11]. However, At Abu Zenima area, the trending E-W with N-S extension has followed the Suez rift but has a local distribution which are associated by monoclines that were suggested to be draped over these normal faults since the Eocene time [7].
In the Gulf of Aqaba region, the normal motion has been recorded on some E-W fault planes resulted from submeridian extension observed in the Cretaceous-Eocene sediments, the Pre-Cambrian basement, and Raham conglomerates of assumed Middle Miocene age [47]. This submerdian extension pre-dates the main strike slip tectonic event in the Gulf of Aqaba fault system. The fault populations on the central province of the Gulf of Suez show younger strike-slip movements (dextral-slip on the NW-, ENE-, and E-W-oriented faults, and sinistral-slip on the N-S and NNE-oriented faults) [14].
4.5. ENE-WSW and WNW-ESE Structural Lineaments
ENE-WSW and WNW-ESE structural trends have little effect in the tectonic evolution of Sinai. [48,49] suggested that the Gulf of Suez consists of WNW-ESE trending ridge segments and perpendicular transform faults with right-lateral movements. In some localities such as Wadi El-Rusis, the ENE-WSW to E-W trending fractures and NW-SE trending Riedel fractures are obviously controlling the mineralization [36].
5. Discussion and Conclusion
The shaded relief technique is vital in enhancing and extraction of structural lineaments, in particular, with different sun azimuth values. In the present study, Shuttle Radar Topographic Mission (SRTM) mosaics are used to map regionally developed structural lineaments in Sinai Peninsula. Lineaments that have geologic significant are remotely extracted and statistically analyzed. The statistical parameters encompass both conventional ones including azimuth frequency, mean length, intersections, and density distribution of lineaments. Moreover, two new statistical indices; Relative Abundance Index (RAI) and Lineament Majority-Minority Index (LMMI) are introduced.
The statistical parameters were contoured to define their distribution and also the factor analysis technique was applied in order to reveal the statistical characteristics of lineaments and the relationships between the different azimuth populations.
The statistical analysis revealed the following characteristic features and important remarks of the extracted structural lineaments:
1) The directional analysis of the azimuth frequency of structural lineaments revealed that the NW and NNE are the most extensive and distinct sets. These two lineaments sets closely related to two major sets of fault systems affected the tectonics of Sinai. On the contrary, structural lineaments of E-W and ENE-WSW are considered to be of less abundance and have low to moderate length extension.
2) The northern and central parts of Sinai Peninsula are characterized by low density and intersection of structural lineaments and remarkable increase was recorded in the southern parts.
3) The northern part of Sinai displays wider areas of majority zones than the southern part. This could be related to the lower density of lineaments and little tendency for multiple lineament population. The majority zones are usually associated with NE and NW-SE in the northern part of Sinai, whereas the majority zones are of less abundance in the central and southern parts of Sinai due to the multiple orientations of lineament populations which reduce the tendency for majority. Moreover, NW and NE are the most abundant lineament populations of majority which are clearly close to the tectonics of Red Sea.
4) The factor analysis indicated a significant correlation between NS and NNE (r = 0.65) where these two directions are tectonically related to the Gulf of Aqaba tectonic trend, whereas in the Gulf of Suez region they are treated as the oldest tectonic event that predate the Gulf rifting. NNE and NW trends have the highest standard deviation values due to the reactivated movements that resulted in the dispersion of the fracture’s direction from the mean. On the other hand, the least reactive trends seems to have the lowest standard deviation.
Finally, the results of the present work could be applicable in the different geologic and environmental aspects that are based on a good understanding of the genetic and spatial relationships of fracture systems. These aspects encompass geodynamic, exploration for mineralization and groundwater, in addition to the mitigation of natural hazards such as flush flooding and earthquakes.
6. Acknowledgements
The author is greatly indebted to Prof. Ahmed M. Hegazi, and Dr. Nabil N. El-Masry, Geology Department, Suez Canal University for fruitful discussion and reviewing of the manuscript.
REFERENCES
- A. Masoud and K. Koike, “Tectonic Architecture through Landsat-7 ETM+/ SRTM DEM-Derived Lineaments and Relationship to the Hydrogeologic Setting in Siwa Region, NW Egypt,” Journal of African Earth’s Sciences, Vol. 45, No. 4-5, 2006, pp. 467-477. doi:10.1016/j.jafrearsci.2006.04.005
- A. Masoud and K. Koike, “Morphotectonics Inferred from the Analysis of Topographic Lineaments Auto-Detected from DEMs: Application and Validation for the Sinai Peninsula, Egypt,” Tectonophysics, Vol. 510, No. 1-2, 2011, pp. 291-308. doi:10.1016/j.tecto.2011.07.010
- S. Solomon and Gh. Ghebreab, “Lineament Characterization and Their Tectonic Significance Using Landsat TM Data and Field Studies in the Central Highlands of Eritrea,” Journal of African Earth Sciences, Vol. 46, No. 4, 2006, pp. 371-378. doi:10.1016/j.jafrearsci.2006.06.007
- E. M. El-Shazly, M. Abdel Hady, M. El Ghawaby and I. A. El Kassas, “Geologic Interpretation of ERTS-1 Satellite Images for West Aswan Area, Egypt,” Proceedings of the Ninth International Symposium on Remote Sensing of the Environment, Ann Arbor, 15-19 April 1974, pp. 119- 131.
- E. M. El-Shazly, M. Abdel Hady, M. El Ghawaby, I. A. El Kassas, M. M. El-Shazly, A. B. Salman and M. ElRakaiby, “Mapping of Sinai Peninsula by Landsat-1 Satellite Imagery interpretation,” 13th International Symposium on Remote Sensing of Environment, Ann Arbor, 23-27 April 1979.
- A. Sobhy, “Interpretation of the Geomorphic Provinces and Structural Elements in Sinai Peninsula by using Landsat images,” Master’s Thesis, Zagazig University, Zagazig, 1983.
- A. M. Hegazi, “Analysis and Tectonic Significance of the Structural Lineaments of Umm Alawi Area, South Sinai, Egypt,” Proceeding of the Fifth Conference, Geology of Sinai Development, St. Catherine, 27-30 October 1998, pp. 19-30.
- E. M. Moustafa and M. Y. Qari, “An Exact Technique of Counting Lineaments,” Engineering Geology, Vol. 39, No. 1-2, 1995, pp. 5-16. doi:10.1016/0013-7952(95)00003-X
- A. M. Hegazi and S. Ahmed, “Application of Remote Sensing Techniques to Extract and Analysis the Structrual Lineaments along the Gulf of Aqaba, South Sinai, Egypt,” Proceeding of the Fifth Conference, Geology of Sinai Development, St. Catherine, 27-30 October 1998, pp. 1-17.
- M. A. El-Ghawaby, A. M. Hegazi and M. O. Arnous, “Photolineament Factor an Indicator for Probable Sites of Mineralization in Saint Catherine Area, Egypt,” Egyptian Journal of Geology, Vol. 45, No. 1, 2001, pp. 1-10.
- T. A. Seleem, “Structural Analysis and Tectonic Evolution of Southwestern Sinai, Egypt,” Ph.D. Thesis, Suez Canal University, Suez, 2005.
- H. J. Bayer, H. Hotzl, A. R. Jado, B. Rocher and W. Vogenreiter, “Sedimentary and Structural Evolution of the Northwest Arabian Red Sea Margin,” Tectonphysics, Vol. 153, 1988, pp. 137-151. doi:10.1016/0040-1951(88)90011-X
- A. R. Moustafa, “Block Faulting in the Gulf of Suez,” Proceedings of the 5th Egyptian General Petroleum Corporation Exploration Seminar, Cairo, 1976.
- A. Sehim, W. Frisch and A. Noufal, “Paleostress Status and Rifting Events of the Gulf of Suez Basin, Egypt,” 4th International Conference, Geology of the Arab World, Cairo University, Egypt, 1999, pp. 64-79.
- A. M. Hegazi, “Structural Analysis and Metamorphic Evolution of East Abu Zeneima Area, Sinai, Egypt,” Ph.D. Thesis, Suez Canal University, Suez, 1995.
- N. Lyberis, “Tectonic Framework,” In: R. Said, Ed., The Geology of Egypt, A. A. Balkena, Rotterdam, 1988, pp. 113-155.
- M. Eyal, Y. Bartov, G. Steinitz and Y. Folkman, “The Origin of the Bir Zrier Rhombo-Shaped Graben, Eastern Sinai,” Tectonics, Vol. 5, No. 2, 1986, pp. 267-277. doi:10.1029/TC005i002p00267
- A. M. Hegazi, “Tectonic Evolution of the Polydeformed Sa`al Belt, South Sinai, Egypt,” Acta Geologica Hungarica, Vol. 49, No. 3, 2006, pp. 1-14. doi:10.1556/AGeol.49.2006.3.5
- Z. O. Ben-Avraham, “Structural Framework of the Gulf of Elat (Aqaba), Northern Red Sea,” Journal Geophysics Research, Vol. 90, No. B1, 1985, pp. 703-726.
- Z. O. Ben-Avraham, Z. Garfunkel, G. Almager and J. K. Hall, “Continental Break by a Leaky Transform: The Gulf of Elat (Aqaba),” Science, Vol. 206, 1979, pp. 214-216. doi:10.1126/science.206.4415.214
- R. Freund, E. Zak and Z. Gerfunkel, “Age and Rate of the Sinistral Movement along the Dead Sea Rift,” Nature, Vol. 220, No. 5164, 1968, pp. 253-255. doi:10.1038/220253a0
- R. Freund, Z. Garfunkel, I. Zak, I. Goldberg, T. Weisbrod and B. Derin, “The Shear along the Dead Sea Rift,” Royal Society of London Philosophical Transactions, Vol. 267, No. 1181, 1970, pp. 107-130.
- A. M. Quennel, “Tectonics of the Red Sea Rift,” The 20th International Geology Congress, Mexico—The Association of Utah Geological Survey in Africa, 1959, pp. 385- 405.
- Z. Garfunkel, J. Zak and R. Freund, “Active Faulting in the Dead Sea Rift,” Tectonophysics, Vol. 80, No. 1-4, 1981, pp. 1-26. doi:10.1016/0040-1951(81)90139-6
- M. I. Youssef, “Structural Pattern of Egypt and Its Interpretation,” Bulletin of the American Association of Petroleum Geologist, Vol. 52, No. 4, 1968, pp. 601-614.
- M. Eyal, Y. Eyal, Y. Bartov and G. Steinitz, “The Tectonic Development of the Western Margin of the Gulf of Elat (Aqaba) Rift,” Tectonophysics, Vol. 80, 1981, pp. 39-66.
- M. A. Selmi, “Reconstruction of the Structural Pattern along N-S Profiles in Northern Sinai, Egypt,” Master’s Thesis, Suez Canal University, Suez, 2003.
- A. R. Moustafa and M. H. Khalil, “North Sinai Structures and Tectonic Evolution. MERC,” Ain Shams University, Earth Science Series 3, 1989, pp. 215-231.
- R. Said, “The Geology of Egypt,” Elsevier Publishing Company, Amsterdam, 1962.
- F. I. Khedr, “Structural Studies on the Northeastern Sector of the Gulf of Suez, Egypt,” Ph.D. Thesis, Zagazig University, Zagazig, 2003.
- W. Bosworth and M. Taviani, “Late Quaternary Reorientation of Stress Field and Extension Direction in the Southern Gulf of Suez, Egypt: Evidence from Uplifted Coral Terraces, Mesoscopic Fault Arrays, and Borehole Breakouts,” Tectonics, Vol. 15, No. 4, 1996, pp. 791-802. doi:10.1029/95TC03851
- A. R. Moustafa and M. H. Khalil, “Superposed Deformation in the Northern Suez Rift, Egypt: Relevance to Hydrocarbons Exploration,” Journal of Petroleum Geologists, Vol. 18, No. 3, 1995, pp. 245-266. doi:10.1111/j.1747-5457.1995.tb00905.x
- M. El-Shafei and T. M. Kusky, “Structural and Tectonic Evolution of the Neoproterozoic Feiran-Solaf Metamorphic Belt, Sinai Peninsula: Implication for the Closure of Mozambique Ocean,” Precambrian Research, Vol. 123, No. 2-4, 2003, pp. 269-293. doi:10.1016/S0301-9268(03)00072-X
- A. Fowler and I. Hassan, “Extensional Tectonic Origin of Gneissosity and Related Structures of the Feiran-Solaf Metamorphic Belt, Sinai, Egypt,” Precambrian Research, Vol. 164, No. 3-4, 2008, pp. 119-136. doi:10.1016/j.precamres.2008.03.007
- B. Blasband, S. White, P. Brooijmans, H. De Boorder and W. Visser, “Late Proterozoic Extensional Collapse in the Arabian-Nubian Shield,” The Geological Society, Vol. 157, No. 3, 2000, pp. 615-628. doi:10.1144/jgs.157.3.615
- T. A. Seleem and I. H. Khalifa, “Structural Control of Sulphide Mineralization in Wadi El-Rusis and Wadi Remthi localities, South Sinai, Cairo,” Egyptian Journal of Geology, Vol. 50, 2006, pp. 289-303.
- P. Y. Chenet, B. Colletta, J. Letouzey, G. Desforges, E. Qusset and E. A. Zaghloul, “Decollement and Extensional Tectonics on the Eastern of the Suez Rift,” University of Durham, Durham, 1985.
- Z. Garifunkel and Y. Bartov, “The Tectonics of the Suez Rift,” Geological Survey of Israel Bulletin, Vol. 71, 1977, pp. 1-44.
- T. A. Seleem, “Structural and Geotechnical Evaluation of Wadi Sanad Industrial Granite, South Sinai, Egypt,” Master’s Thesis, Suez Canal University, Suez, 2001.
- A. A. Aal, R. A. Day and J. J. Lelek, “Structural Evolution and Styles of the Northern Sinai, Egypt,” 11th EGPC Exploration Seminar, Vol. 1, 1992, pp. 546-563.
- M. El Toukhy, H. Charmy and M. Studer, “Structural Evolution of the Eastern Part of the Western Desert and Its Implications for Hydrocarbon Exploration,” Proceedings of 14th Petroleum Conference October Exploration Egyptian General Petroleum Corporation, Cairo, 1998, pp. 156-177.
- R. Guiraud and Y. Bellion, “Late Carboniferous to Recent Geodynamic Evolution of the West Gondwanian Cratonic Tethyan Margins,” In: A. Nairn, J. Dercourt and B. Vrielynck, Eds., The Ocean Basins and Margins, 8: The Tethys Ocean. Plenum Press, New York, 1995, pp. 101-124.
- S. G. Abd El Samie and M. A. Sadek, “Groundwater Recharge and Flow in the Lower Cretaceous Nubian Sandstone Aquifer in the Sinai Peninsula, Using Isotopic Techniques and Hydrochemistry,” Hydrochemistry Journal, Vol. 9, No. 4, 2001, pp. 378-389. doi:10.1007/s100400100140
- V. Corchete, M. Chourak and H. M. Hussein, “Shear Wave Velocity Structure of the Sinai Peninsula from Rayleigh Wave Analysis,” Surveys in Geophysics, Vol. 28, No. 4, 2007, pp. 299-324. doi:10.1007/s10712-007-9027-6
- A. R. Moustafa and M. H. Khalil, “Rejuvenation of the Eastern Mediterranean Passive Continental Margin in Northern and Central Sinai: New Data from the Themed Fault,” Geological Magazine, Vol. 131, 1994, pp. 435- 448. doi:10.1017/S0016756800012085
- R. A. Abul-Nasr, “Biostratigraphy and Facies Analysis of Some Eocene Exposures, West Central Sinai, Egypt,” Middle East Research Center, Ain Shams University, Earth Sciences Series 4, 1987, pp. 234-247.
- Z. Garfunkel, J. Barton, Y. Eyal and G. Steinitz, “Raham Conglomerate, New Evidence for Neogene Tectonism in the Southern Part of the Dead Sea Rift,” Geological Magazine, Vol. 111, 1974, pp. 55-64. doi:10.1017/S0016756800000455
- M. I. Youssef, “Structural Pattern of Egypt and Its Interpretation,” Bulletin of the American Association of Petroleum Geologist, Vol. 52, No. 4, 1968, pp. 601-614.
- X. LePichon, J. Francheteau and J. Bonnin, “Developments in Tectonics (Plate Tectonics),” 2nd Edition, Elservier, Amsterdam, 1976.