Health
Vol.5 No.8(2013), Article ID:35544,8 pages DOI:10.4236/health.2013.58176
Choices of health care financing schemes for resource poor country: An analysis of Nepal’s experiences
![]()
Department of Economics, Patan Multiple Campus, Tribhuvan University, Lalitpur, Nepal; *Corresponding Author: sssadhikari@yahoo.com
Copyright © 2013 Shiva Raj Adhikari. This is an open access article distributed under the Creative Commons Attribution License, which permits unrestricted use, distribution, and reproduction in any medium, provided the original work is properly cited.
Received 23 May 2013; revised 24 June 2013; accepted 15 July 2013
Keywords: Health Care Financing; Benefit Incidence; Cost; Poor; Nepal
ABSTRACT
An appropriate health care financing scheme can improve the efficient, equitable, and effective use of health care resources; however, each popular health care financing scheme has some advantages and disadvantages. The designing of health care financing strategy to fit with the country specific features is not straightforward. In resource poor country, allocation of resources for health care services are always critical and frequently unstable due to nuances annual budget process, small fiscal space, uncertainties in contributions of external development partners. Considerable quantities of country specific researches require for the choice of an appropriate health care financing scheme. The paper illustrates possible better options for the government to pursue the goal of ensuring that the poor receive more benefits. The paper compares the benefit incidences and cost of services with different options purposed for primary health care services by utilizing recently collected data from different hospitals in Nepal. The paper offers an alternative policy such as a universal free care below the district level services; but in the district level which is top level of primary care, “extended targeted free health care” may be an efficient, fair, and relatively simple approach.
1. INTRODUCTION
Considerable quantities of researches have explored extensive policy debates on health care financing mechanism to improve efficiency in resource use, mobilizing new resources and to ensure equity in health care in developing countries [1-5]. Health care services are frequently less offered to poor people and even the services are frequently underutilized by the poor people due to financial and non-financial barriers [6,7]. No doubt, health care financing has a key role to reform health care delivery and to mobilize the health care inputs; however, it remains challenging to guarantee efficient, equitable and effective use of health care resources [8,9]. Each popular financial mechanism has some advantages and disadvantages that create debates among the policy makers. For example, user fees vs. eliminating user fee which has created lively debates in developing countries since long time ago [2,3]. Recently, debates are heightening on universal free health care services-providing all segments of the population with a wide range of government-operated health services with free of charge, in Nepal, similar to other developing countries; because it is still not clear about who gets the benefits from the provision of universal free care. Again, general tax revenue remains the main source of financing for public health facilities in most of the developing countries where contribution of alternative health care financing is negligible. Allocations of resources for health care services are always critical and frequently unstable due to nuances annual budget process, small fiscal space, uncertainties in contributions of external development partners in the developing countries [6,7], although the government has made some efforts to improve access of the services to the poor people to promoting equity. However, evidences suggest conflicting results: benefits of health care services are disproportionately concentrated among the better-off [8].
An important question is, therefore, what will be the better option to promote equity with a reasonable number of health resources to spend from the general tax revenue and how we can design innovative health care financing mechanism from which poor people can get more benefit, especially in primary health care services in developing countries, like Nepal. The objective of this paper is to illustrate possible better options for the government to pursue the goal of ensuring that the poor receive more benefits (subsidy) through alternative approaches to resource allocation and purchasing. The paper compared the benefit incidences and cost of services with different options purposed for primary health care services by utilizing recently collected data from different hospitals in Nepal. As an alternative, the paper offers an alternative policy such as a universal free care below the district level services; but in the district level which is top level of primary care, “extended targeted free health care” may be an efficient, fair, and relatively simple approach.
2. HEALTH SYSTEM IN NEPAL
Nepal’s health care system is hierarchically structured could be compared to four-layer pyramid: primary care at below district level, primary care at district level, secondary care and tertiary care, from bottom level to top level respectively. Ministry of Health and Population (MOHP), which operates a nationwide system of facilities and programmes, provides largest capacity for health care services. The government health care system consists primarily of a network of hospitals and public health offices throughout the country. Public health care providers are heavily subsidized and dominate health care market; however, the private health care providers are playing important role in delivery of health particularly in urban area. Primary care at below district level includes sub-health post (SHP), health posts (HP) and primary health care centers (PHCC) provide clinical and preventive services at free of cost with good coverage of rural areas. Primary care at district level includes district hospitals and district public health offices. District hospital (DH) provides inpatient, emergency and outpatient services whereas the district public health offices are primarily responsible for providing preventive services. Secondary care is provided by zonal and sub regional hospitals with various degree of specialization in curative care. Finally, tertiary care is at the top level of health service pyramid that includes central hospitals, university teaching hospital and large private hospitals. Our attention in this study is district hospital services because DHs play a key role in providing outpatient, inpatient, and emergency services throughout the country at affordable prices, and serve as the referral point for primary health care below district level. Child health, maternal healthcommunicable and non communicable diseases related services, pathology tests and diagnostic services, x-ray services and among others are available at DHs. DH, therefore, is considered as backbone of curative services in Nepal.
DHs are run by the hospital development committee (HDC). The members of the HDC are appointed from the local bodies and civil society. Government subsidy and user fee are two major sources of financing for DH services. The HDC can generate other sources of financing from the local level; however, its contribution is negligible and it is not the regular source for health financing.
Recent Nepal national health account (NNHA) [10] report suggests that the ratio of total health care expenditure (THE) with gross domestic product is almost five percent and private financing is the principle means of health financing in Nepal. The contribution of out of pocket payment (OOP) to THE is almost 55 percent. The share of total government expenditure that contributes almost one fourth of THE devoted to the health sector has been increasing over time. Contribution of health insurance is negligible and remaining share is contributed by the external development partners [10].
The Government of Nepal (GON) has adopted a Free Health Care Scheme (FHCS) as a risk protection scheme to primary level facilities of the public health system since 2008 [11]. The Box 1 describes the development of free health care policy in Nepal.
3. METHODS AND MATERIALS
The paper used exploratory and descriptive research design. Policy documents, income expenditure reports of Government and the district health facilities, district health facility survey and consumer survey were principle sources of information for this study. The data from primary sources were collected in August-September 2008. The data were collected data at the district health facility to minimize recall bias as far as possible:
3.1. Sampling Procedures
Both random and non-random sampling methods were employed in the sampling procedures of the study. The distributional criteria were used to reflect diversity in development regions, ecological belts and low or betteroff human development districts, and size of the hospital (number of beds) with ensuring the national representation. Within the distributional criteria, almost 10 percent of 72 DHs (7 DHs) were randomly selected that has shown in Table 1.
The exit interview was conducted at the sampled DHs where the consumers were receiving outpatient, emergency, and inpatient services. At each hospital, up to 20 in-patients with the longest stays were chosen in the Box 1. Major policy changes towards the journey of free health care in Nepal.
| National health policy: A major health care reform in 1991 had brought completely new regulatory mechanisms and structures to the Nepalese health care system with an objective of providing the opportunity to the rural people to enable them to obtain the benefit of modern medical facili- ties by making the facilities accessible to them. Second Long-Term Health Plan (SLTHP): The plan for 1997-2017 has focused to ensure equity in gender, socioeconomic, social inclusion in healthcare and access to quality healthcare services with focusing on essential healthcare services (EHCS) in the districts. Nepal Health Sector Program – Implementation Plan (NHSP-IP) 2004: The Implementation Plan had been developed in light of the National Health Policy 1991 and the SLTHP with special emphasis on improving access to health care for poor and vulnerable groups. The EHCS was reprioritised into 4 elements: a) Family Planning, Safe motherhood and Neonatal health; b) Child Health; c) Communicable Disease Control; d) Out-patient Care Interim Constitution of Nepal: In 2007, the Interim Constitution of Nepal 2063 has explicitly endorsed health care as a basic human right in Nepal. Universal Free Essential Health Care below District Level: In October 2007, the government of Nepal declared all health services at health posts and sub-health posts free of charge to all to remove financial barrier and to increase utilization of basic health services. In 2008 free essential health care was expanded to PHCC. Targeted free at the district hospital:The targeted program was introduce to increase the utilization of health care services and to reduce impact of out of pocket payment for the poor. The emergency and indoor services in 35 districts with the lowest Human Development districts were free of cost for hard core poor, fifty percent discount in user fee for poor, fee charge for better off; however, prices of services were heavily subsidized. In the DHs of remaining 40 districts, emergency and out-patient services are free of charge for hard core poor, fifty discounts for poor and fee charge for better off. The free services scheme has also covered senior citizens and FCHV. Extended targeted free at the district hospital: In 2008, the targeted programs are extended that all services in all DHs. The curative services are provided at free of charge with enlisted essential drugs for hard core poor, fifty percent free of charge for poor. Universal free care: Universal free care at DHs has not been decided yet; however, it is a topic of hot policy debates among the policy makers in the country due to limited fiscal space and matter of equity goal of the country |
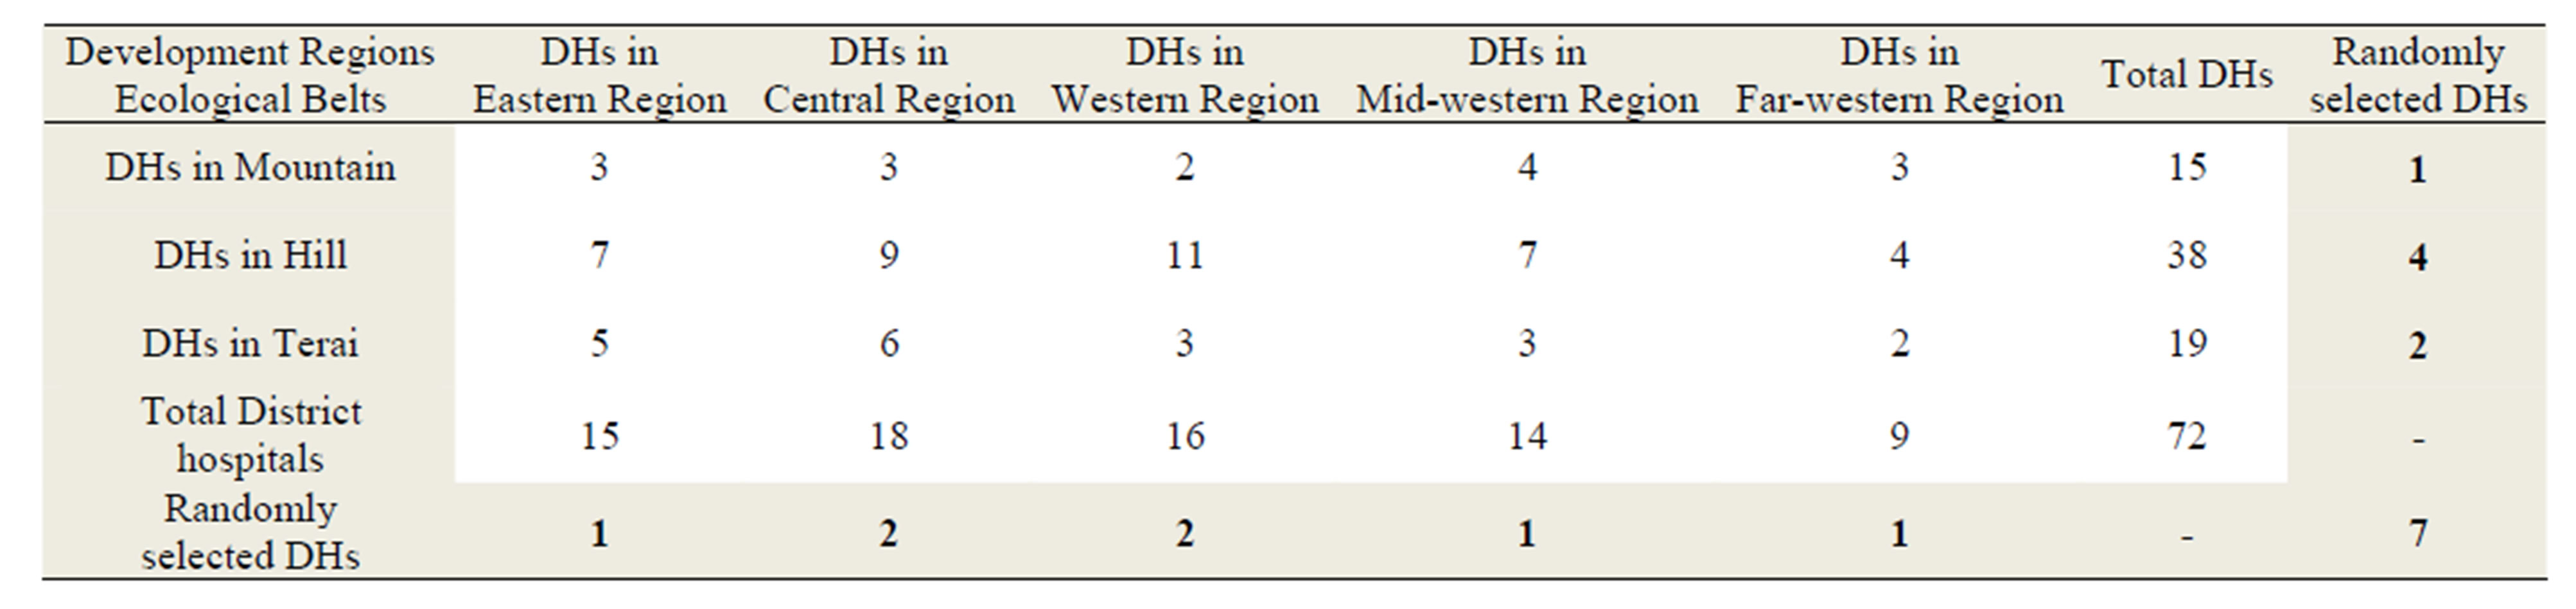
Table 1. Distributional criteria and sample selection process.
study sample. Thirty consumers for outpatient or emergency services were randomly selected in an exit interview in each hospital. In the two months period, the interviews with four hundred and three consumers were conducted.
3.2. Method of Data Collection
Two set of structured and pre-tested questionnaires were administered by trained researchers at the public facilities to collect the required data. The facility survey related questionnaire captured the information on all inputs and value of resources used for production of services, sources of financing and expenditure, collection and allocation of user fees and utilization of services among others. The instruments for consumer survey were designed similar to Nepal demographic and health survey (NDHS) to capture the information on category of utilization of services, cost of services, cost of drugs, individual and household characteristics and durable asset ownership such as roof material, walls materials, floor material, water and sanitation, toilet, radio, television, motorcycle and computer among others.
3.3. Data Management and Analysis
Rigorous mechanisms were in place at all stages of the survey and data collection to ensure quality of data collected. For example, questionnaires were designed in a way so that all the questions are in a logical order, easy to understand and phrased in local language. Data were entered into the Census and Survey Processing System (CSPro.3 program) with controlling mechanism developed to prevent entering errors. Data were double checked by the researcher and author during data collection period to ensure the data free from inconsistency and incompleteness. Survey data were double checked and coded on daily basis before and after being entered on the computer. Statistics/data analysis (Stata Corp., Texas) STATA version 10.1 was used for data management and analysis. Asset index was constructed by utilizing the methods suggested in the literatures [12-14] to measure the living standard.
Asset index was based on the indicators of living standards and determining indicators of the living standards for the household collected in the user exit interviews. Principal components analysis (PCA) is used to construct the asset index. The PCA method is a popular approach in the health sector to measure living standards based on asset-ownership data [12-14]. Once the asset index is constructed, all the users were grouped into five categories, each representing 20 percent of the total user population. The lowest 20 percent or quintile was considered the poorest (or ultra poor) of all users and the second 20 percent was considered poor group. The higher three quintiles were considered non-poor and the highest 20 percent was considered the richest of all users. With this classification of household wealth of all the users, the paper examined the use of health services for each of the five groups, from the poorest to the richest. Quintile group created from asset index was used the base of equity analysis.
The benefit incidence analysis (BIA) examines the distribution of subsidy among different groups of the population and measures how much each group benefits from the public-supported services [15,16]. Benefit of a service is defined as the subsidy provided by the government for the service, which is the difference between unit cost of the service and payment for the service. Ingredient method was used to estimate the unit cost of services by utilizing facility survey data. The details of estimation methods and unit cost were discussed elsewhere [11]; however, some required data were exhibited in Figure 1.
We adopted the methods to estimate BIA in terms of concentration indices as suggested by O’Donnell et al. [13]. This describes the distribution of public spending across individuals ranked by their living standard index. Measurement of BIA can be illustrated by concentration index that gives a measure of magnitude of inequality. The index varies −1 to +1 and if the concentration index is zero, there is no socioeconomic-related inequality. The sign of the concentration index indicates the direction of any relationship between the subsidy received and position in the living standards distribution and its magnitude suggests both the strength of the relationship and the degree of variability in the subsidy variable. The negative
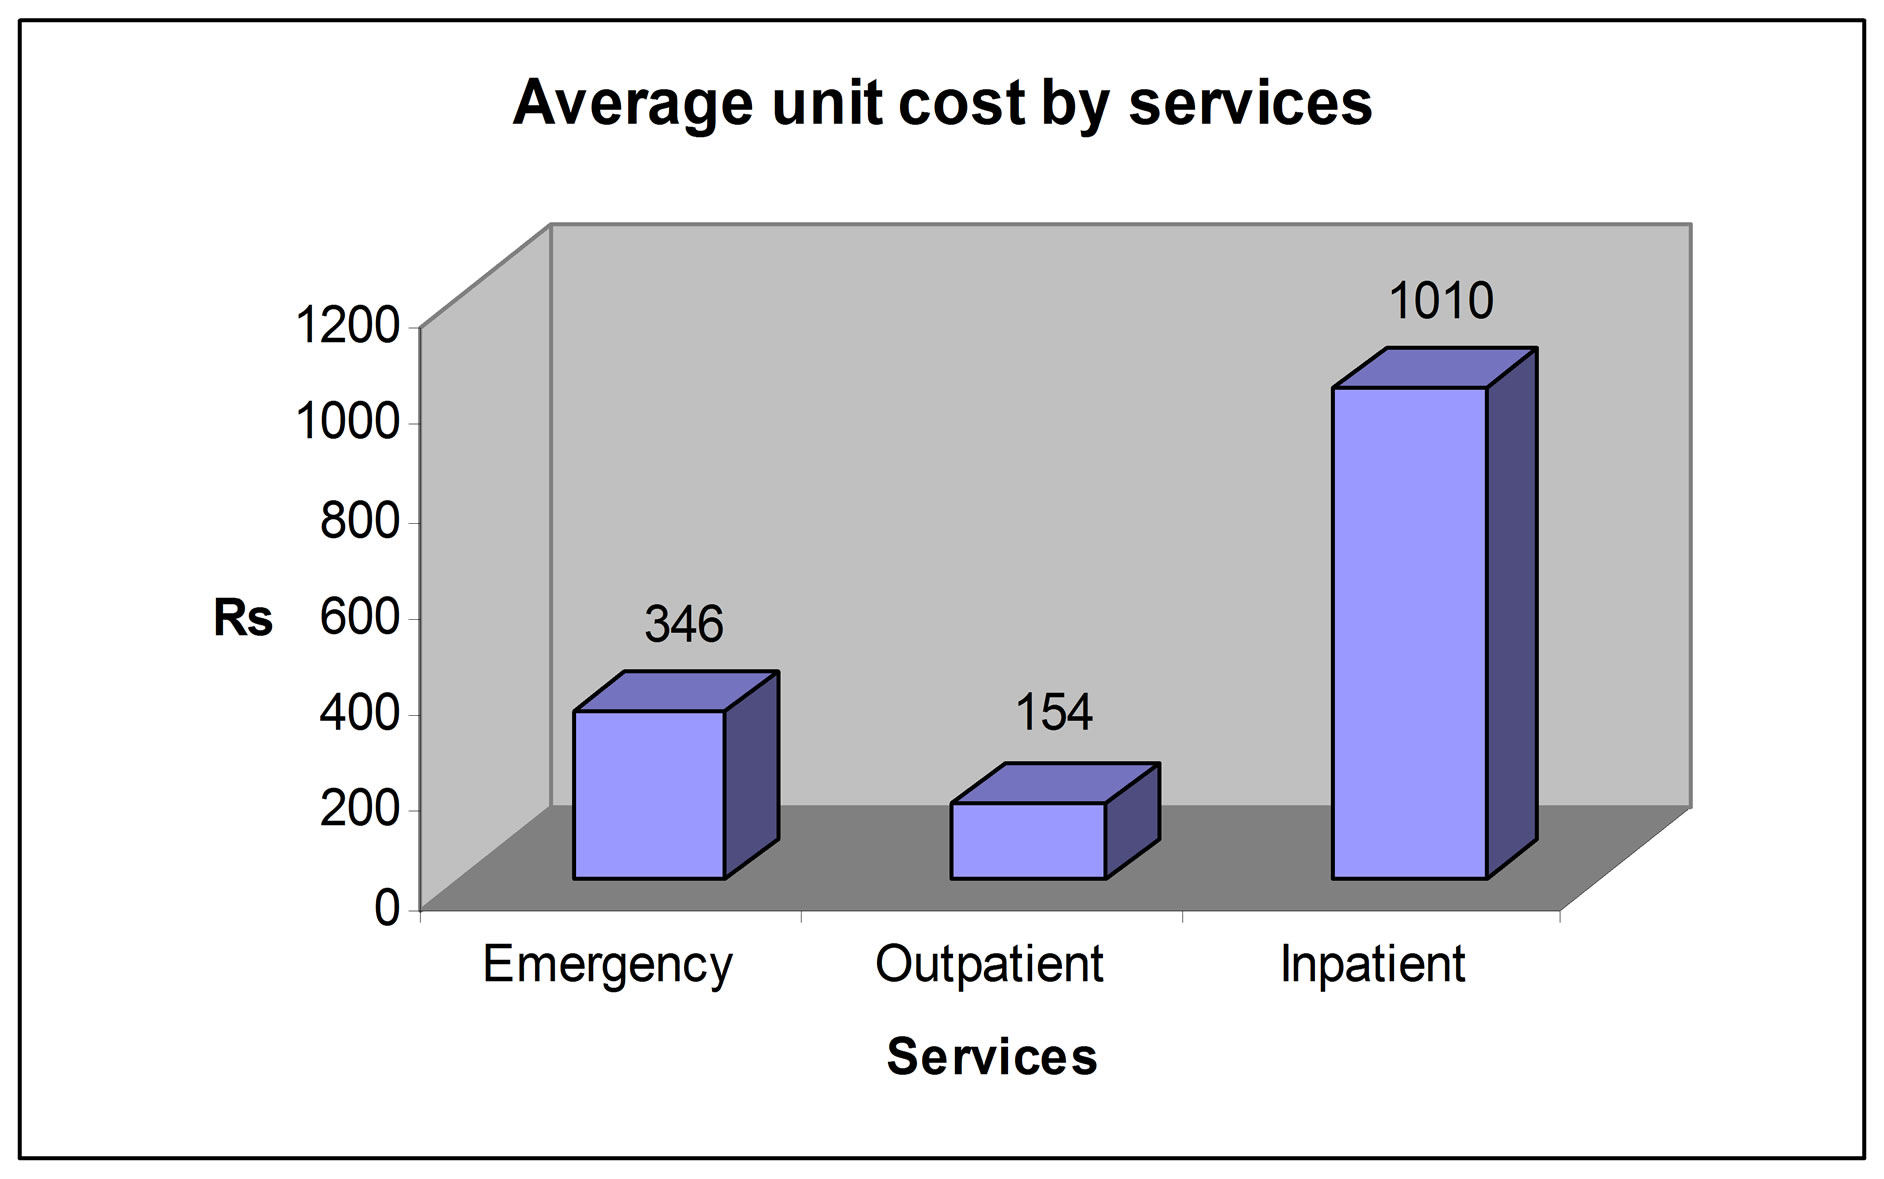
Figure 1. Average unit cost by services.
concentration index reflects the subsidy concentrated among poor.
Again, the paper estimated the government budget required for implementation the given alternative health financing policies: current policy (targeted policy), extended target policy and universal free policy by utilizing the unit cost of services and routinely collected national data for utilization of services. Targeted free, extended targeted free and universal free policies are designed to remove the financial barrier to utilize health care services. Current policy offers health care services and listed drugs at the DHs to the poorest of the poor (the first quintile) at free of cost. Under this policy, DH provides the health care services and listed drugs to poor (second quintile) with 50 percent discount. Remaining group of the people should pay to get health care services and drugs from DH. The paper offers two alternative health care financing policies: extended target policy and universal free policy. Under the extended target policy, the poorest of the poor (first quintile) as well as the poor (second quintile) groups will receive health care services and listed essential drugs at the DH free of charge and while the non-poor (the three higher quintiles) should pay to get health care services and drugs in the hospitals. Under a universal free policy, all services and the listed essential drugs in the DHs will be provided to all the population at no cost.
What would happen to the use of DHs under each of the two new scenarios? How many more patients would come to the DHs for services when user fees are abolished for the poor or for all? Would there be more poor patients or more non-poor patients? There are two potential sources of new patients for the DHs: people who are currently using private hospitals and those who are currently not using DH services at all. It is assumed that the individuals who need health care utilize the service at private and public hospital. Almost all patients who previously visited to private hospital may utilize DH services if the services are provided at free of cost. Generally, targeted people will utilize more health services if the services are free of charge for certain group of the people. The paper used some proxy indicators to estimate the effect of elimination user fee for different groups or for all because the elasticity of demand for health care services which can help to estimate the price effect on health care utilization is not available. The possible scenarios are simulated based on available data from public and private facilities, new utilization rate of below district level services when services are provided free of cost, asset index and presented in the table. The government recently introduced free health policy in low district level facility. Free services encouraged to utilizing the services at below district level; therefore the paper used the incremental utilization rate of below district level service after introduction of free health care to estimate demand for health care of DH. Particularly for the poor people, they are facing financial barrier to utilize the services. The utilization rate of poor group may be higher in the extended target policy; however same utilization rate for the poor group was used for this study.
Simulation techniques were used to present the BIA of each policy and budget required for implementation of respective policy. To estimate possible changes in utilization rate after introduction new policy, the paper used reported data of utilization of rate of below district level services after abolishing the user fee.
4. ANALYSIS
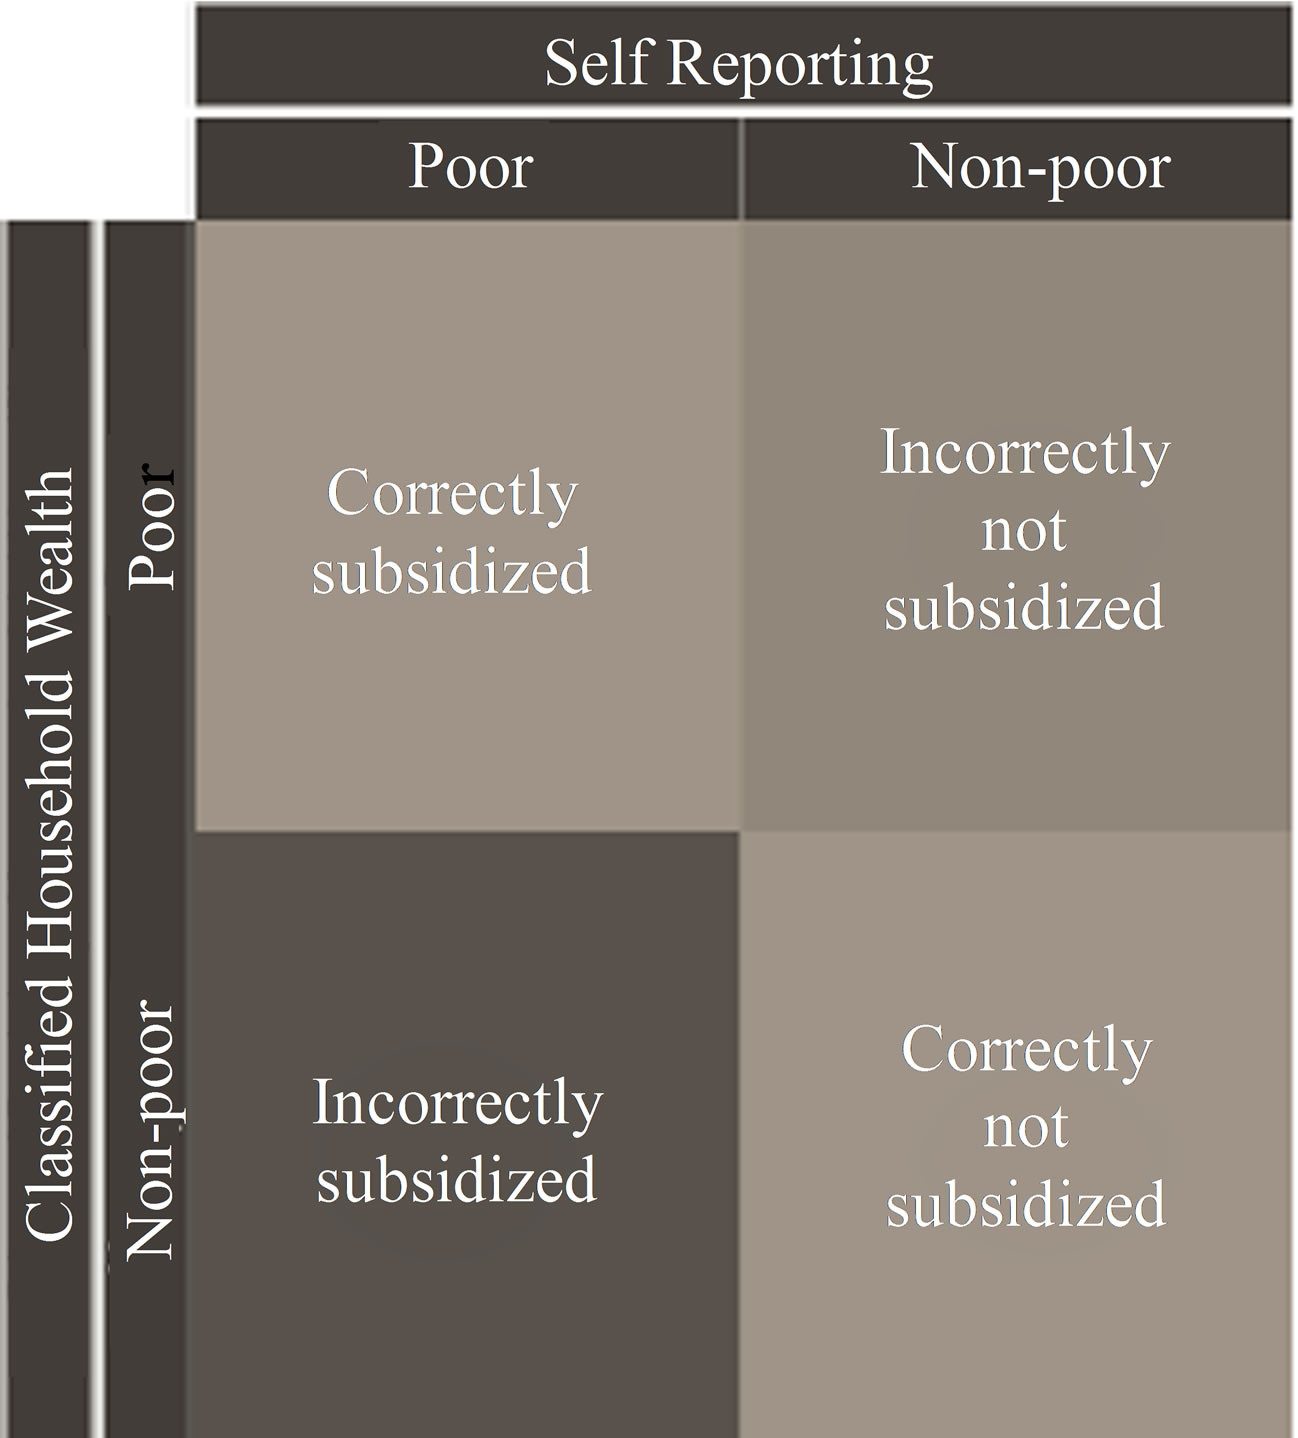
The current targeted policy has been implemented based on self-reported household income (poverty) status in DHs. If the patient’s current household income is adequacy for less than six months consumption for the household, the household or individual is categorized as a ultra poor, then the health care services are provided at free of charge. Similarly, if the household income is sufficient for more than six months but less than 12 month, the household/ individual is categorized as poor, the health services are provided with fifty percent discount of existing prices at the district hospital [16]. Matching the poorest quintile based on asset index with self-reported ultra poor, there are four possible outcomes during the implementation of programmes: 1) poor people received free services as poor; 2) non-poor received services as non-poor and paid the full user fee; 3) poor people received services as non-poor and paid the full user fee; and 4) non-poor received services as poor and did not pay for the user fee as illustrated in the Figure 1. In the first two cases, the targeted policy is correctly implemented in DHs. The latter two cases are mismatches where the poor paid for services and the non-poor got them free. Obviously both have negative implications on health equity.
Figure 2(b) showed how the five asset index groups reported their poverty status. The horizontal axis represents the five household asset index groups and the vertical axis shows how each group self-reported their living standard (poverty status) while visiting hospital. For example, the poorest quintile groups based on asset index means all people within the group are poorest of the poor (or ultra poor); however, only 31 percent out of them reported ultra poor while visited to hospital. In other words, among the ultra poor people, only 31 percent poor utilized services as ultra poor category. Fifty one % of them self-reported as non-poor and only 41% of them self-reported as poor or ultra poor. It observed a general trend that as the asset index went from the poorest to the richest, more people (from 52 percent to 94 percent)
 (a)
(a)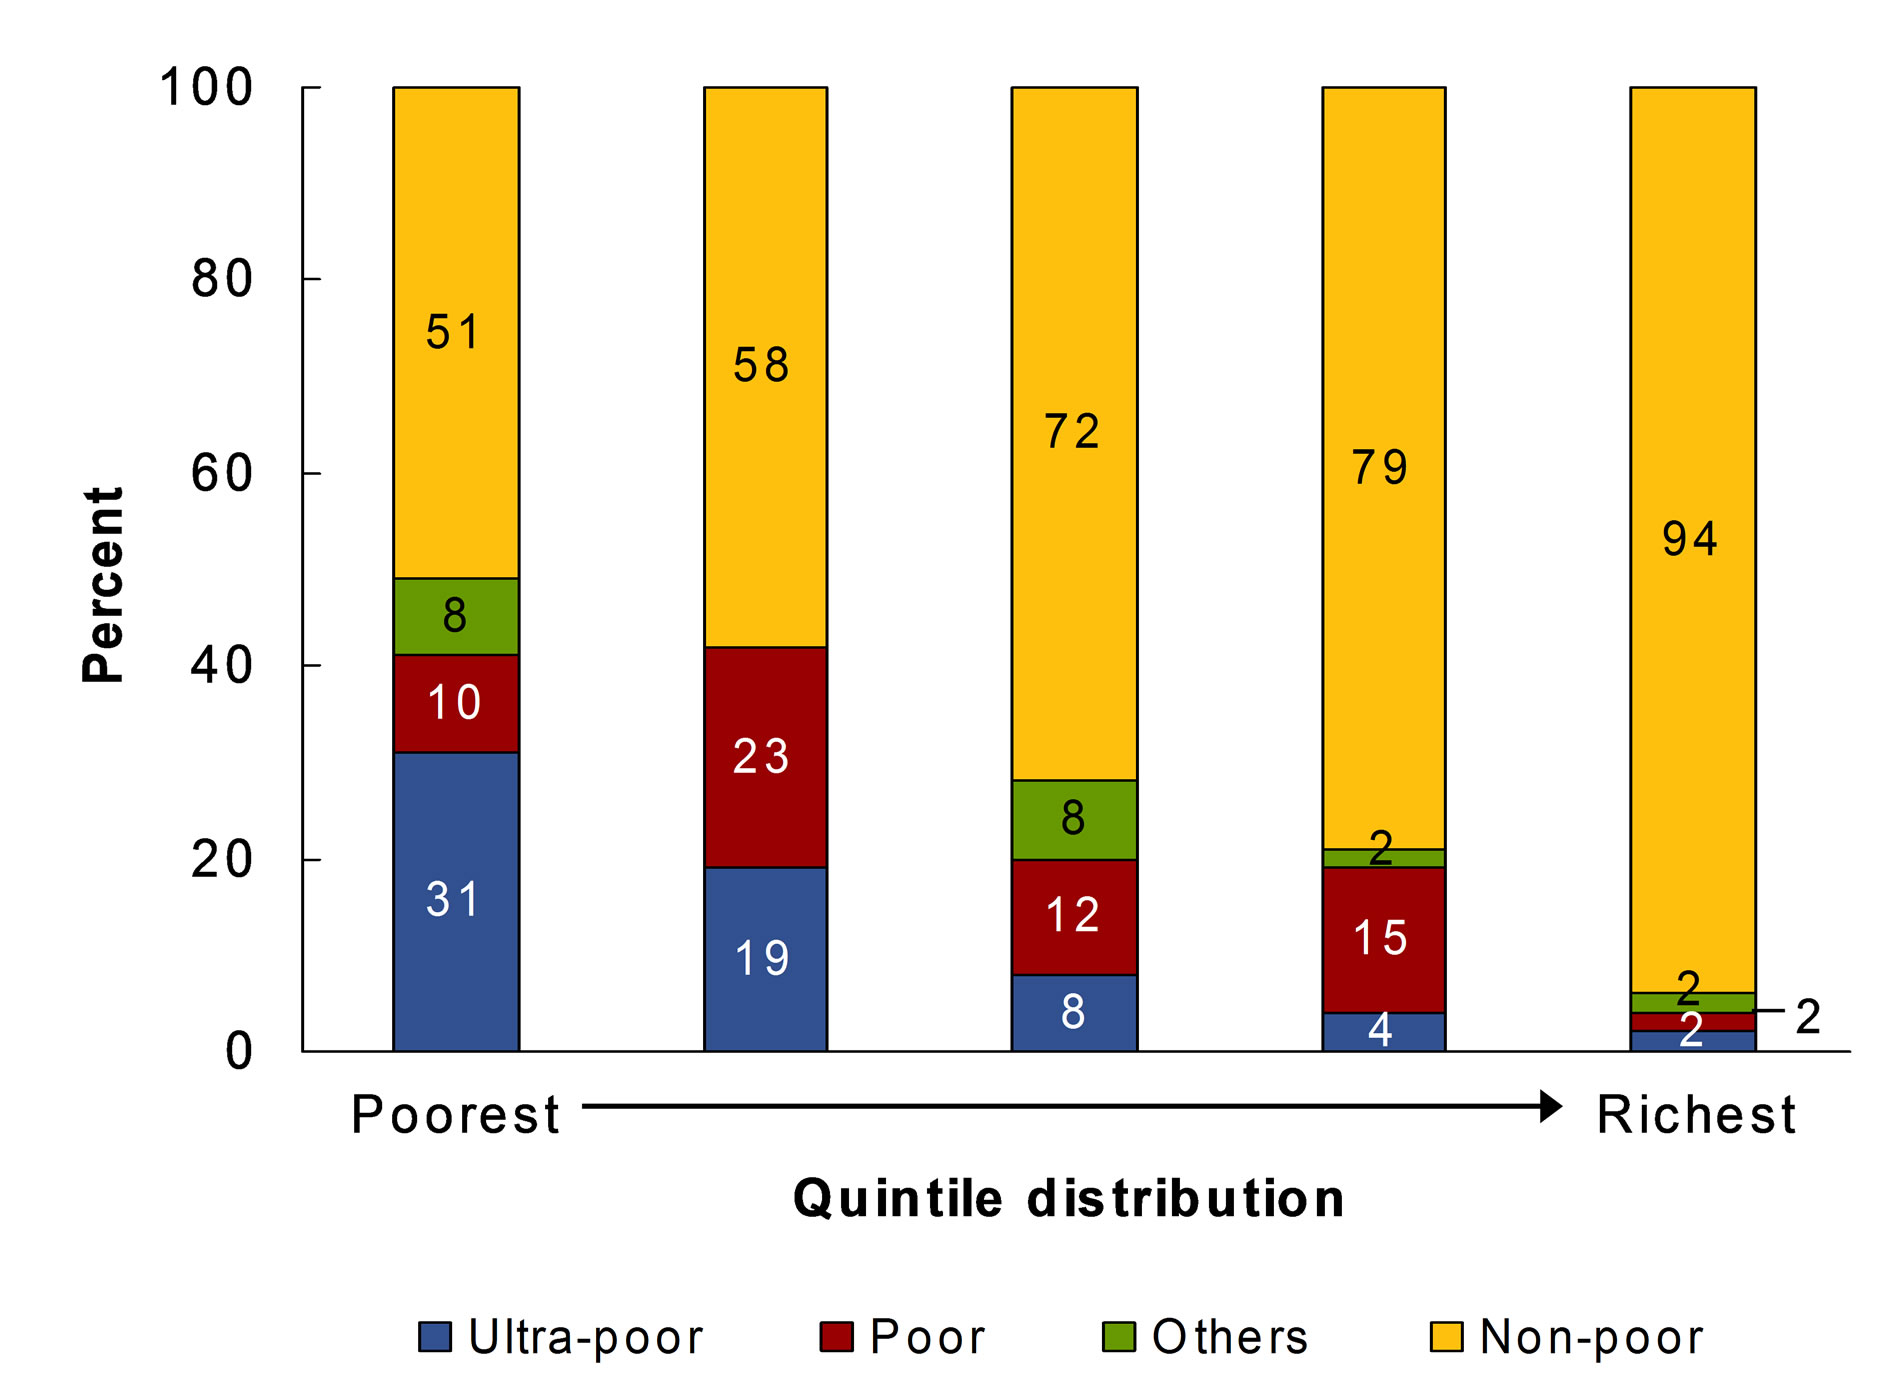 (b)
(b)
Figure 2. (a) and (b) Self-reporting vs. classification by standard of living.
reported themselves as non-poor, and fewer people (from 41 percent to 4 percent) reported themselves as poor or ultra poor. It should be pointed out that a significant proportion of the poorest of the poor and the marginal poor reported themselves as non-poor.
4.1. Benefit Incidence Analysis
Table 2 compares the distribution of health benefits for alternative health financing policies and suggests that more health resources will go to the poor at the DH level if the extended target policy is implemented and more health resources will go to the richer if the universal free policy is adopted.
The calculated CIs are reported in Figure 3. The CI decreases from the current −0.146 to −0.260 if the extended target policy is implemented. If a universal free policy is adopted, the concentration index would be −0.120, indicating less pro-poor compared to targeted policies. The size and sign of CIs indicate that extended targeted policy is more pro-poor than currently targeted
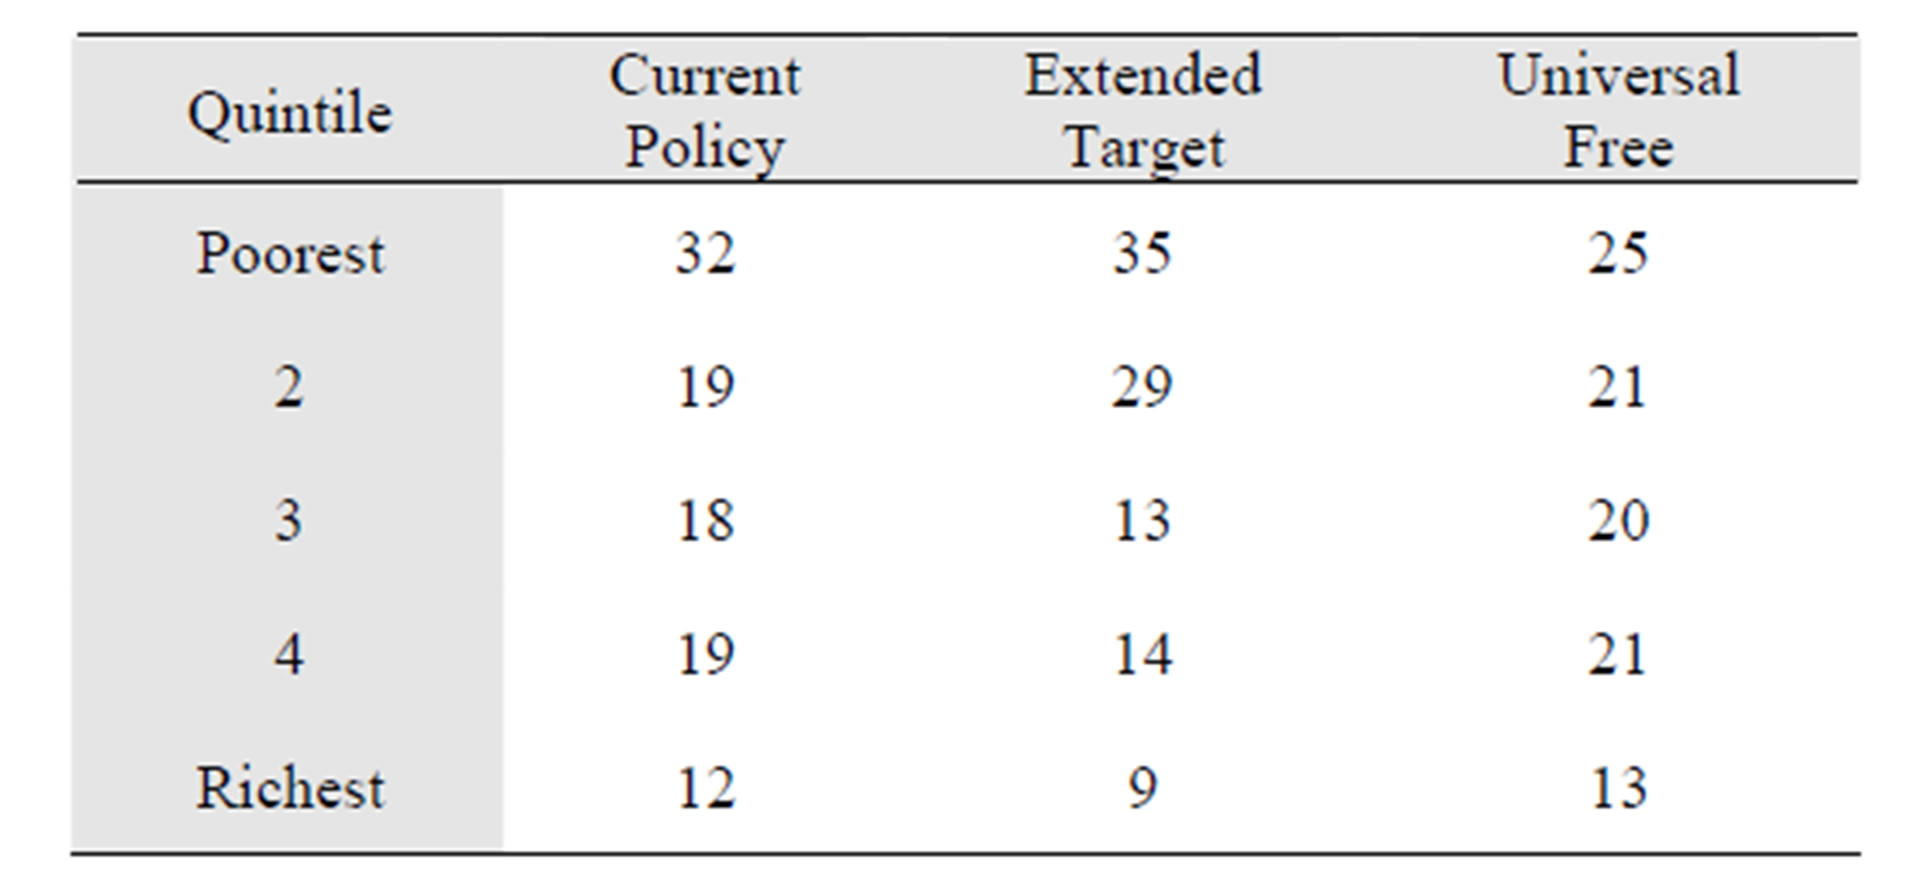
Table 2. Quintile distribution of health benefits under alternative policies.
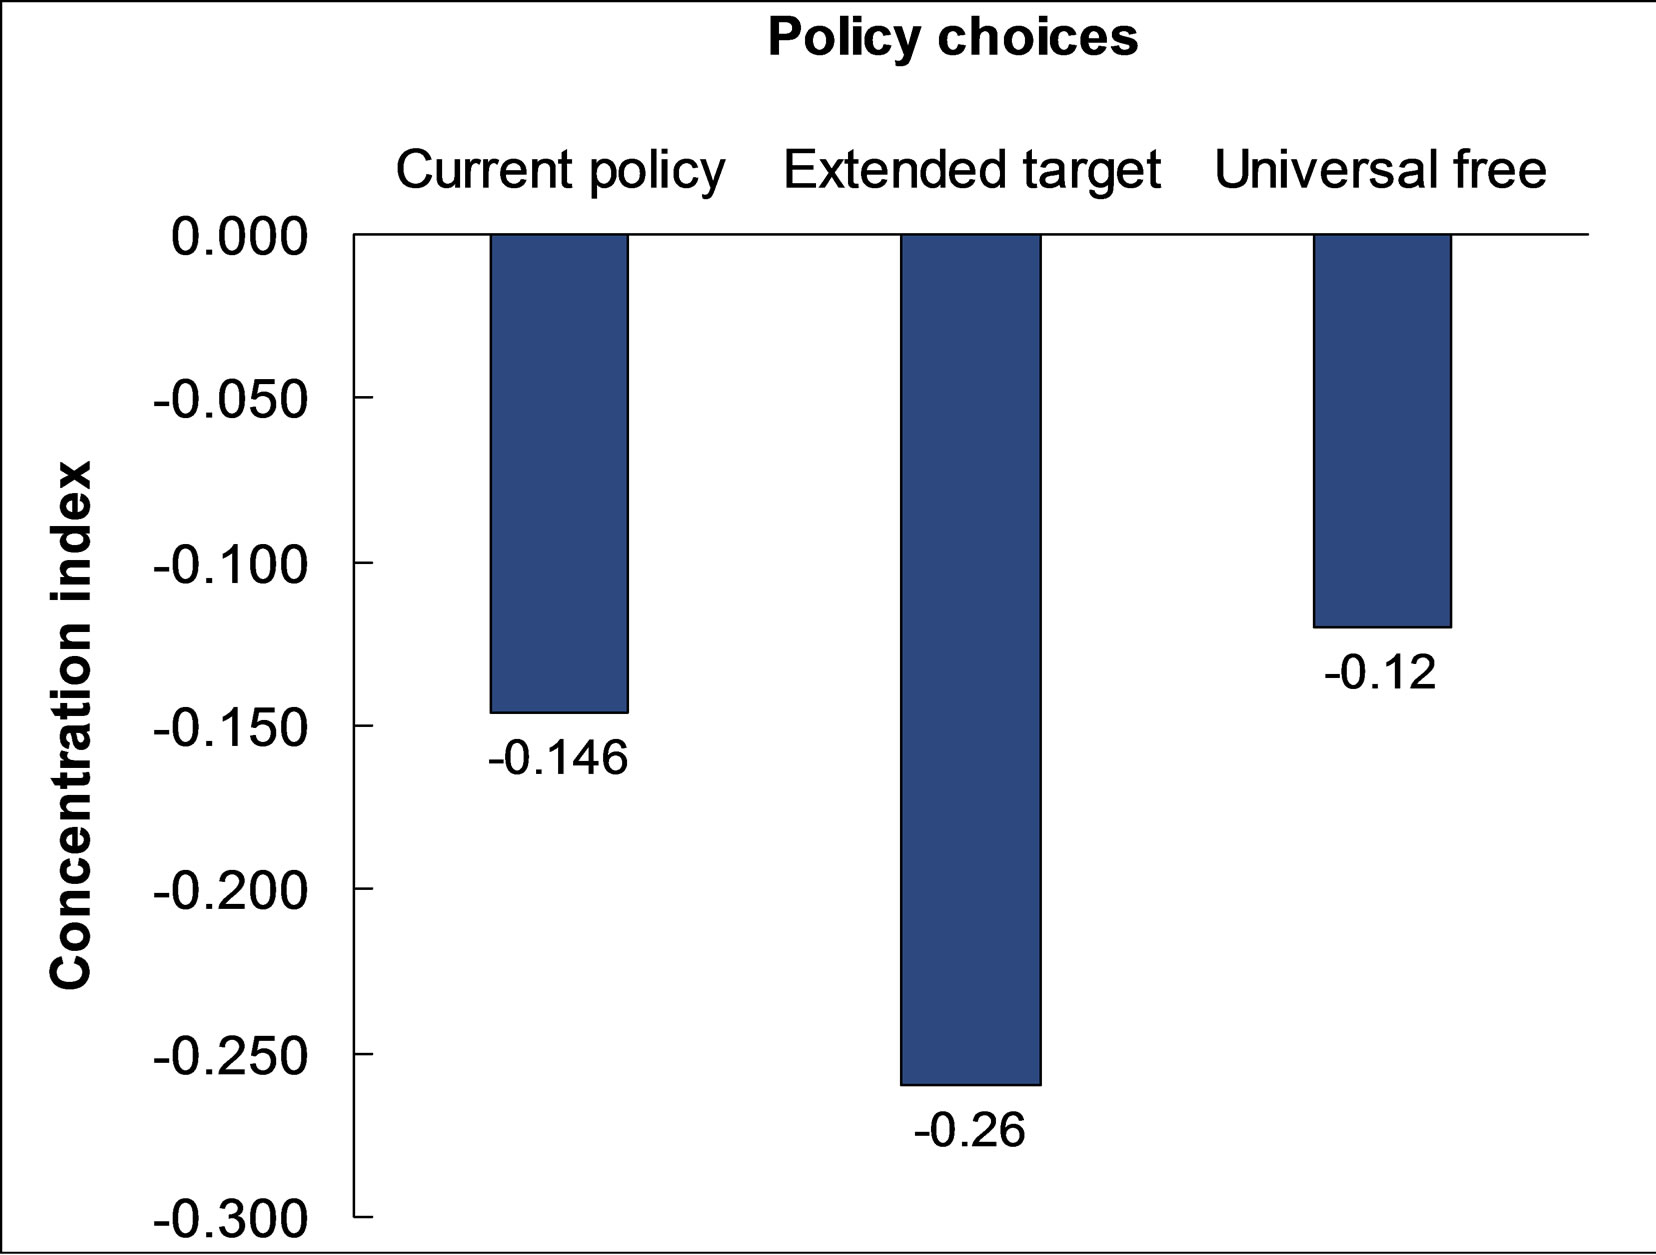
Figure 3. Concentration curves for alternative policies.
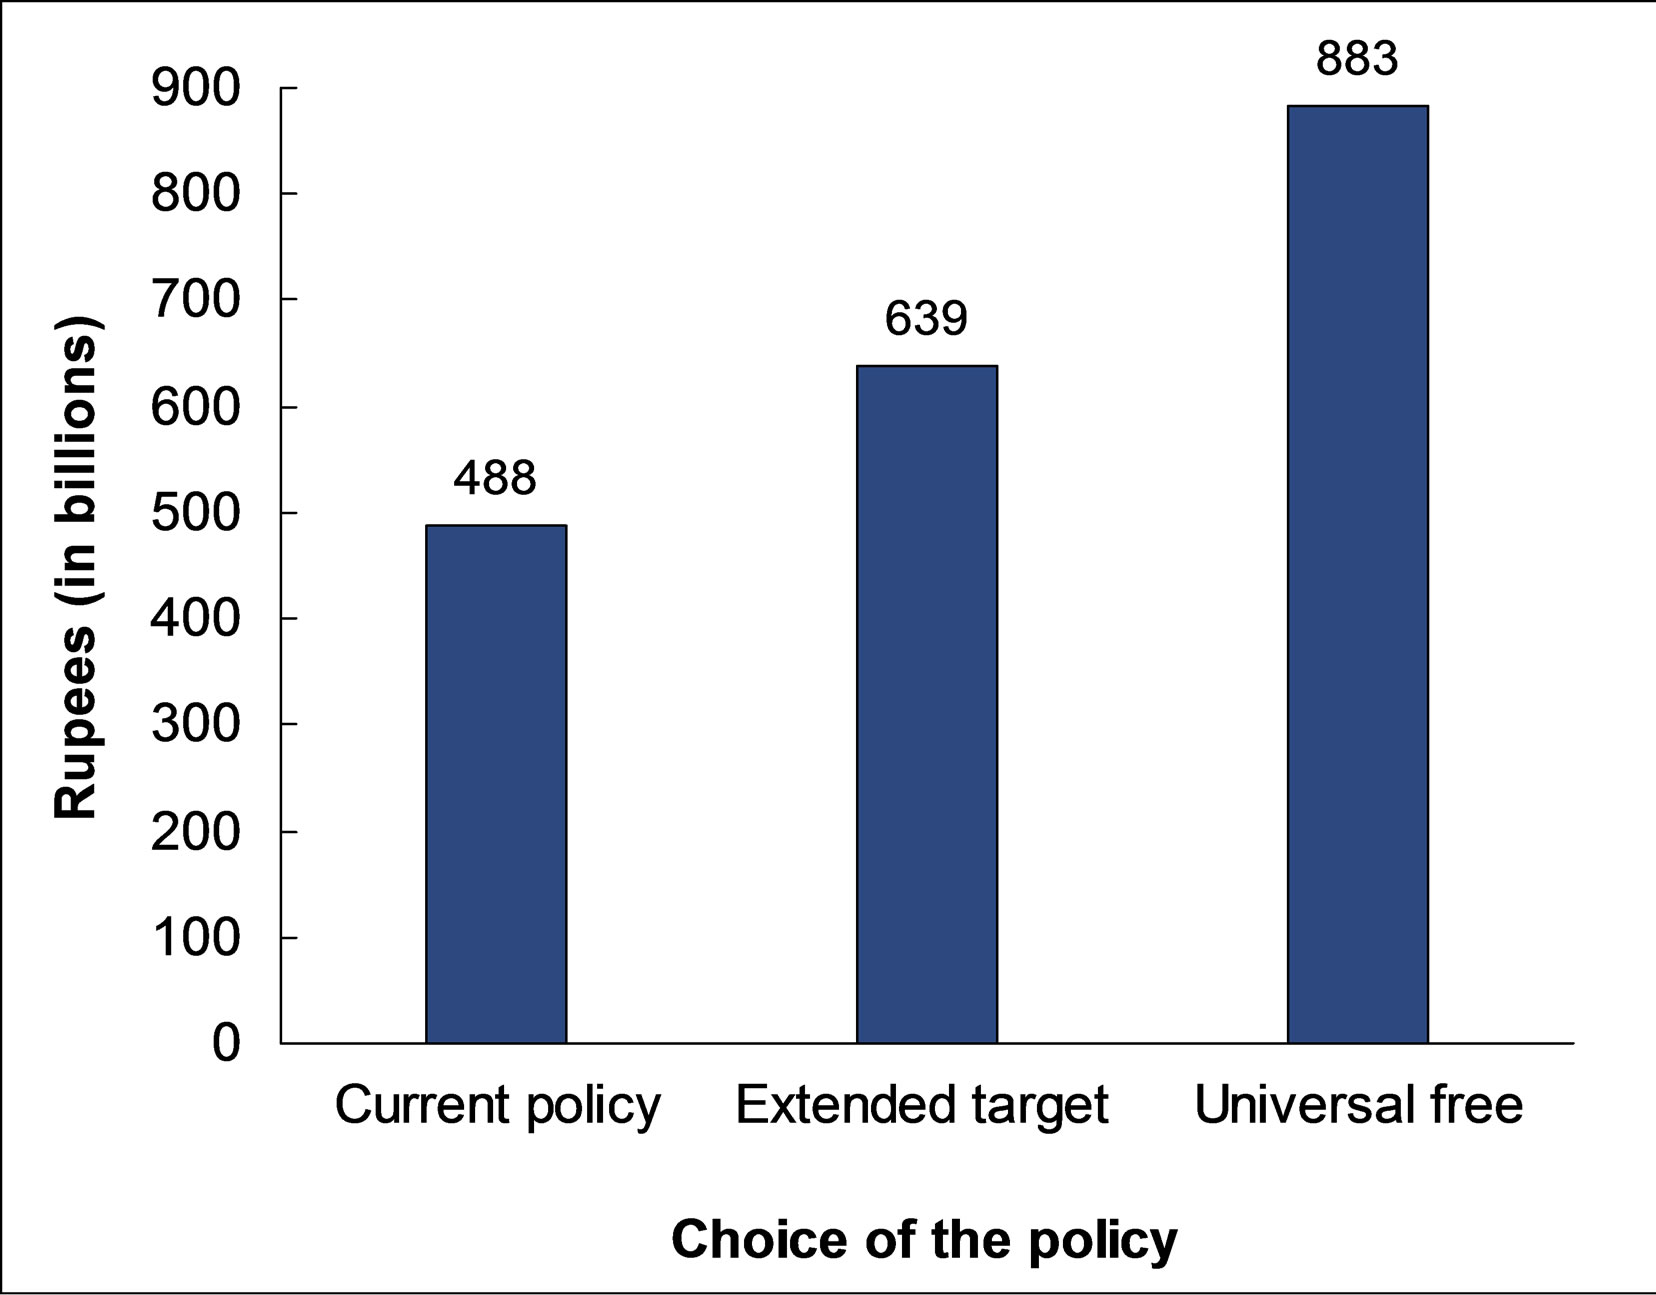
Figure 4. Estimated total budget for all district hospitals under three alternative policies.
policy.
4.2. Budget Estimation According to Policy Options
In order to have the proper perspective of budget sizes, projections of the total budget requirements for all 72 DHs in Nepal are made under the three policy scenarios. The budget for the current policy is estimated and its implementation based on estimated unit costs of the three services, as mentioned above and number of users of the services for these 72 DHs from health management and information system (HMIS) records of national data. The estimated total budget for current policy and implementation is NRs 488 billion. Without the knowledge of elasticity of demand for hospital services by household wealth groups, we applied the same observed percentage increase in service utilization after user fees are abolished at health posts and sub-health posts to the services at DHs. With more estimated users from the poorest and the poor quintiles, the estimated total budget for the new extended target policy for 72 DHs is NRs 639 billion. If the universal free policy is adopted, the estimated budget requirement for the 72 DHs would be NRs 883 billion. Figure 4 compares the projected total annual budget for DHs for the three alternative scenarios.
5. DISCUSSIONS
Implementation mechanism of targeted free care is based on self-reported poverty status that seems very crude method to make the efforts to reach poor; but it is acceptable. The result suggested that only 2 percent non poor utilized services as poor category. Over 40 percent poor had utilized services as either hard core poor or poor category in the country where 31 percent are poor reported in government document [17]. The percentage of utilization of targeted free care is decreasing with increase of wealth quintiles. Current health care policy is pro-poor compared to previous policy [18]. It is quite clear that at the DH level, the extended target approach of free care with a focus on the poor is the best policy choice among the alternatives. When the extended targeted free care policy is compared to the universal free care policy, the government should increase the budget by almost 40 percent, but pro-poor subsidy incidence will be reduced by more than 50 percent. Additional 151 million Nepalese rupees (30 percent additional) require for extended targeted free care compared to targeted free care; consequently, pro-poor subsidy incidence is increased by more than 75 percent. No doubt poor people are more sensitive with prices of services and prefer the medicine rather than services [19,20]. The extended targeted free care, therefore, ensure more subsidy to reach the poor and to reduce inappropriate self treatment and use of drugs without prescriptions. Not only the BIA perspective, there are a number of advantages from the extended targeted free care policy because there is still user fee for the better off. User fee revenue has contributed almost 25 percent of total expenditure of DHs [11], abolishing user fees and replacing the loss of revenues with government budget allocations may affect provider motivation and the accessibility and quality of services. The experiences of other developing countries, for example, Uganda and Cambodia, supported the findings and arguments [21]. An in-depth understanding of local needs, constraints and opportunities is most important before designing the policy. The policy can minimize the constraints and utilize the opportunities at the same time, for example, one-fourth of user fees is used to give incentives to the health staff, which is crucial in enhancing staff’s morale and increasing productivity. Funds from the government budget are not allowed to be used to pay for incentives. On the other hand, although it is not sufficient, the crude method to diagnose the poor is working because it indicates the culture of Nepalese people is not to provide false information.
A number of studies confirmed that out of pocket expenditure should not be exceed 30 to 40 percent of THE to achieve universal coverage of health care services in Asian region [22]. It will be ambitious goal for Nepal to reduce contribution of OOP almost by 40 percent within the given situation. Again, in this situation, extended targeted free care might be the best option for policy makers.
Finally, there are some limitations of the study. We collected data from hospital settings to minimize possible recall bias. In the analysis, we have implicitly assumed that the consumers present in the hospitals represent the population in the community. The sample size of the DHs may be the national representative; however, it difficult to say the representation of sample size of consumers for the national scenarios. The qualitative characteristics of national scenario are represented by the results of sample size, for example, poverty incidence, castes, population distribution among the ecological belt among others; therefore, the conclusions of the study may not be affected
6. CONCLUSIONS
At least 3 points are worth highlighting in the conclusions. First, the results support the current targeted free care policy adopted by the government. In comparison with other alternative strategies, the newly announced extended targeted policy stands out as the best alternative. The extended target policy would be even more effective in achieving higher level of benefit incidence if it can attract the poor who are currently not utilizing the public health services. Second, the extended target policy supports not only maintain the quality of services, but also improve equity and efficiency in DH services. Third, DH services are the referral essential health care services from under district level health care which are universal free. Expectations of the people for referral services in term of quality might be high and they may be ready to pay for this, but access to DH care services will be limited by resources. This approach of health care financing constitutes a desirable cross-subsiding from the nonpoor to the poor.
7. ACKNOWLEDGEMENTS
This study was financially supported by health sector reform support programmes implemented by RTI international and funded by DFID. We would like to thank Robert Timmons, Dennis N W Chao, Devi Prasad Prasai, Bishnu Prasad Sharma and Indu Joshi for providing valuable comments and supports on this research. The findings of this paper were presented at the meetings of Government of Nepal and External development partners, Joint annual review (JAR) meetings in Nepal.
REFERENCES
- Xu, K., Evans, D.B., Kadama, P., Nabyonga, J., Ogwal, P.O., Nabukhonzo, P. and Aguilar, A.M. (2006) Understanding the impact of eliminating user fees: Utilization and catastrophic health expenditures in Uganda. Social Science & Medicine, 62, 866-876. doi:10.1016/j.socscimed.2005.07.004
- Yates, R. (2009) Universal health care and the removal of user fees. Lancet, 373, 2078-2081. doi:10.1016/S0140-6736(09)60258-0
- Andrew, C. (1997) User fees: They don’t reduce costs, and they increase inequity. British Medical Journal, 315, 202- 203. doi:10.1136/bmj.315.7102.202
- Lagarde, M. and Palmer, N. (2008) The impact of user fees on health service utilization in lowand middle-income countries: How strong is the evidence? Bulletin of the World Health Organization, 86, 839-848. doi:10.2471/BLT.07.049197
- Laterveer, L., Munga, M. and Schwerzel, P. (2004) Equity implications of health sector user fees in Tanzania. Do we retain the user fee or do we set the user f(r)ee? Analysis of literature and stakeholder views. Research for Poverty Alleviation (REPOA), ETC Crystal Leusden.
- Gilson, L. and McIntyre, D. (2005) Removing user fees for primary care in Africa: The need for careful action British Medical Journal, 331, 762-765. doi:10.1136/bmj.331.7519.762
- RTI International (2010) Health care financing in Nepal Research. RTI International, Triangle Park.
- O’Donnell, O. (2007) Access to health care in developing countries: Breaking down demand side barrier. Rio de Janeiro, 23, 2820-2834.
- Adhikari, S.R. and Maskay N.M. (2004) Health sector policy in the first decade of Nepal’s multiparty democracy: Does clear enunciation of health priorities matter? Health Policy, 68, 103-112. doi:10.1016/j.healthpol.2003.09.008
- MOHP (2012) Nepal national health account 2007-2009. Ministry of Health and Population, Kathmandu.
- RTI International (2009) Cost and Equity Implications of Public Financing for Health Services at District Hospitals in Nepal. RTI International, Research Triangle Park.
- Filmer, D. and Pritchett, L.H. (2001) Estimating wealth effects without expenditure dataor tears: An application to educational enrollments in States of India. Demography, 38, 115-132.
- O’Donnell, O., van Doorslaer, E., Wagstaff, A., and Lindelow, M. (2008) Analyzing health equity using household survey data: A guide to techniques and their implementation. World Bank, Washington DC.
- Vyas, S. and Kumaranayake, L. (2006) Constructing socioeconomic status indices: How to use principal components analysis. Health Policy and Planning, 21, 459-468. doi:10.1093/heapol/czl029
- Pearson, M. (2002) Benefit incidence analysis: How can it contribute to our understanding of health system performance? UK Department for International Development, London.
- MOHP (2009) Free care operational guidelines 2008. Ministry of Health and Population, Government of Nepal, Kathmandu.
- MOF (2008) Economic survey 2007/08. Ministry of Finance Government of Nepal, Kathmandu.
- O’Donnell O., van Doorslaer, E., Rannan-Eliya, R.P., Somanathan, A., Adhikari, S.R., Harbianto, D., Garg, C.C., et al. (2007) The incidence of public spending on healthcare: Comparative evidence from Asia. The World Bank Economic Review, 21, 93-123. doi:10.1093/wber/lhl009
- Gertler, P. and van der Gaag, J. (1990) The willingness to pay for medical care: Evidence from two developing countries. Johns Hopkins University Press for the World Bank, Baltimore and London.
- Mwabu, G., Ainsworth, M. and Nyamete, A. (1993) Quality of medical care and choice of medical treatment in Kenya: An empirical analysis. Journal of Human Resources, 28, 838-862. doi:10.2307/146295
- Meessen, B., Van Damme, W., Tashabya, C.K. and Tiouti, A. (2006) Poverty and user fees for public health care in low income countries: Lesson from Uganda and Cambodia. Lancet, 368, 2253-2257.
- WHO (2009) South East Asian region and western pacific region health financing strategies for the Asia Pacific region 2010-2015. South East Asian Region and Western Pacific Region, World Health Organization.