Engineering
Vol.4 No.11(2012), Article ID:25109,4 pages DOI:10.4236/eng.2012.411105
Shear Stress Variation at Scour Hole of Circular Pier
Water Resource Research Department, Korea Institute of Construction Technology, Goyang, South Korea
Email: jgkang02@kict.re.kr, yeo917@kict.re.kr
Received August 25, 2012; revised September 27, 2012; accepted October 7, 2012
Keywords: Local Scour; Bed Material; Flow Velocity Ratio; Shear-Stress Ratio; Time Effect
ABSTRACT
The causes of local scour are generally categorized into flow condition, structure, and riverbed material. A three-dimensional vortex flow generated with the influence of the structure is the main factors of the flow conditions, and the size of the particles is assumed to be the main factor of the riverbed case. Various studies about pier local scour have been carried out by researchers since the 1960s, and a large number of experimental formulas have been suggested. Difficulties were encountered by these past studies, however, in terms of considering the influence of various riverbed materials and scour changes (floods, etc.) on time, with the condition of maximum scour depth. In the case of Korea, especially, scour influenced by various riverbed materials and the frequency of floods have been determined to be very important factors. Therefore, the ultimate purpose of this study on pier scour is to suggest the scour examination method that could consider various riverbed materials and the frequency of floods. In this study, the periodic changes in local scour based on the differences in the diameters of four types of bed materials, and on the hydraulic condition of the initial scour, were determined and compared with those in former studies. Using the results of the comparison, this study aims to determine the changes in the shear-stress around piers for various bed materials through the effect of time on scour depth (S, Smax), the shear-stress around piers, and the particles’ critical shear stress (τc).
1. Introduction
The variables that are usually applied to determine the categories of scour (clear-water scour or live bed scour) are similar to the ratio of the critical flow velocity to the upstream flow velocity and the sediment movement at riverbeds. This ratio, called “flow intensity” is suggested to have two types considering its influence on flow velocity. First, it is formulated as  using shear or riverbed frictional velocity (
 ) and shear velocity (
 ) is in turn defined as
  where τ is the riverbed shear stress. The initial or critical shear velocity,
  , can be formulated using the critical shear stress (τc), and the flow intensity can be expressed as the shear stress of
 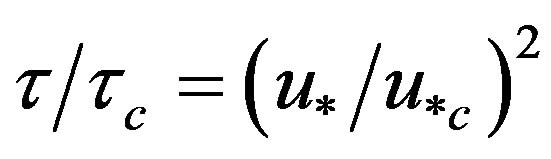 in this equation. Since most transportation equations are riverbed shear-stress clauses in this equation, they have a direct correlation with sediment transportation. Although the critical shear velocity can be determined based on the given similarity, the value cannot be easily derived in the rotating flow condition but can be derived using the assumption of flow field. Second, flow intensity applies the average water depth approaching velocity (V) and critical flow velocity (Vc) on the particles. “Critical velocity” refers to the velocity at which sediment movement takes place for riverbed materials. Generally, clear water scour takes place in the region of
 , while live bed scour takes place in the region of
 . Most researchers have reported that the lower limit for clear water scour is located in regions
  and 0.5. Sheppard [1] used 0.47. Laursen [2], on the other hand, searched the relationship of clear water scour at long contraction with geometry, flow, and the similarity function. He assumed that the function of time is identical to the critical tractive force (τc) which clear water scour restricts when boundary shear stress (tractive force) occurs. He developed the equation of poised scour depth (dse) for piles or bridges.

Here, y0 is the water depth of the approaching flow, D is the diameter of the pile (or bridge), and τ0 is the boundary shear stress. Laursen derived the equation for scour depth along the time function (ds) in tractive force terms, as a time function.

If the diameter of the cone bottom of the scour hole is assumed to be 2.75 ds and the height is ds, the volume ( ) of the scour hole is approximately
  and the transportation rate of the external material of the scour hole is as follows,
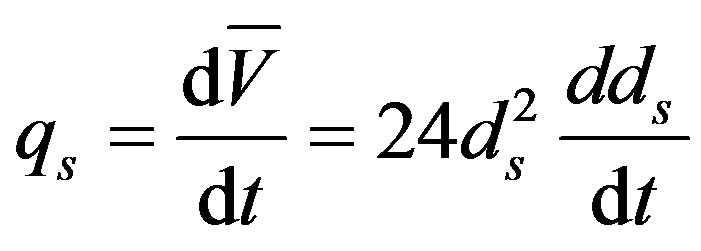
Here, qs is the volume ratio of sediment transportation. Laursen formulated the following transportation relationship of tractive force:

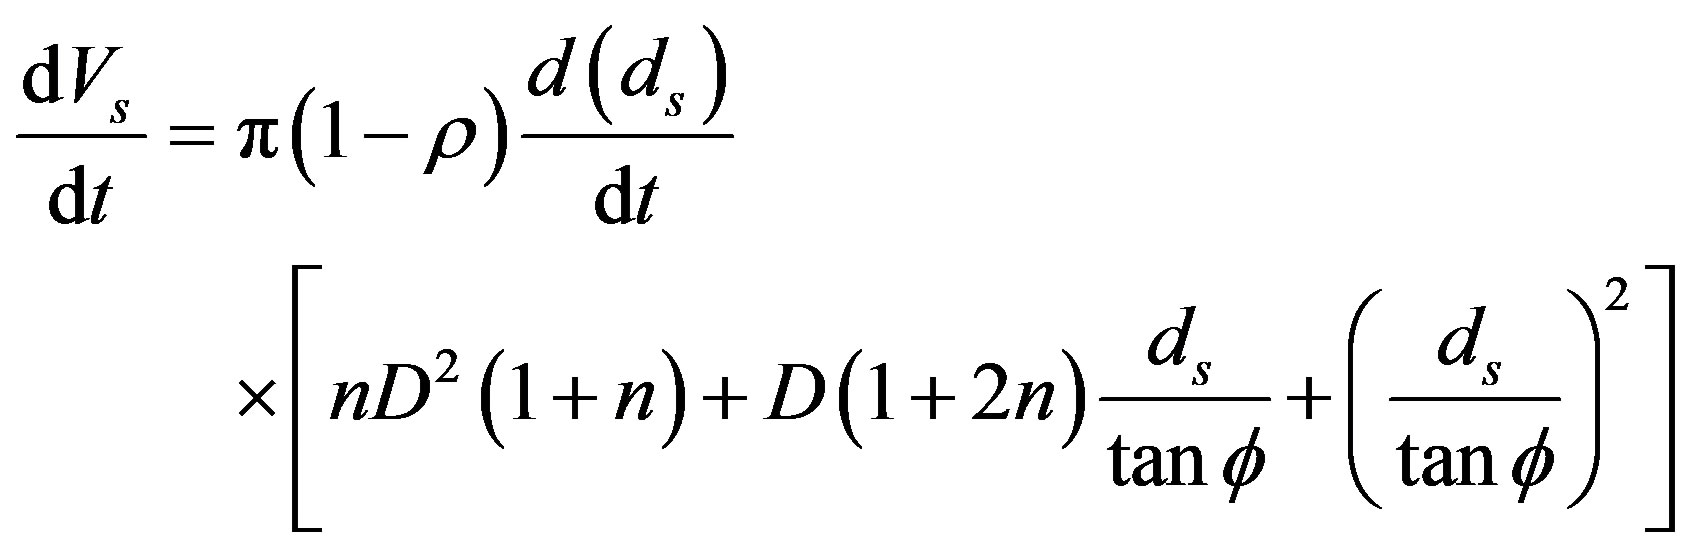
where c is the average sediment diameter at the sediment quantity of percentage by weight and dm (Laursen assumed that the flux of unit width to q = V0 y0 would attain qs) and is V0 the water-depth-averaged approaching flow velocity in this equation. In conclusion, Laursen derived a different equation, which features scour procedure with time. If the equation for circular pile would be transformed, the following formula will be derived:
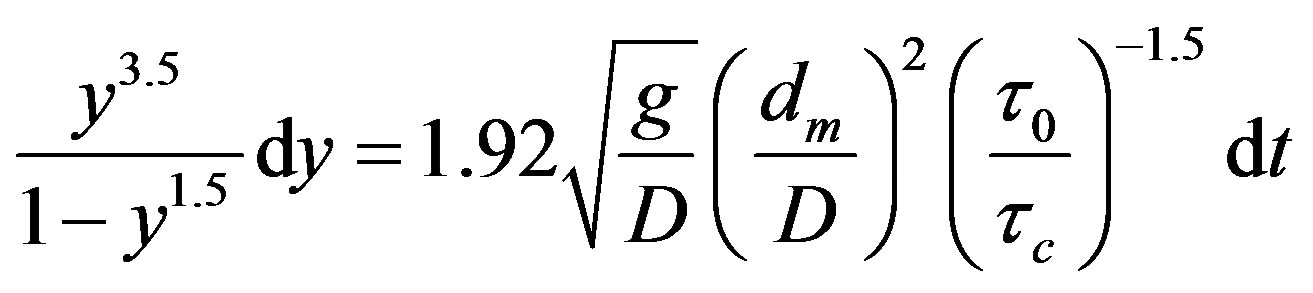
here, .
.
2. Experiment
A two-dimensional electromagnetic hydrometer was used to measure the flow velocity field, and bed-measuring equipment (WH-501; WHT-40, Kenek Co.), a mobile altitude-measuring equipment, was used to measure the riverbed. As shown in Figure 1, the experiment was carried out in a 0.6-m-wide, 16.0-m-long, and 0.7-m-high alternative inclined canal. A 0.1-m-diameter transparent acrylic pole was used for the model pier to enable the recording of the scour via CCD, as shown in Figure 2. Experiments involving seven types of particles were carried out, and the experiment conditions can be seen in Table 1. Figure 3 shows the scour hole and shape on experiment.

Figure 1. View of the test canal.
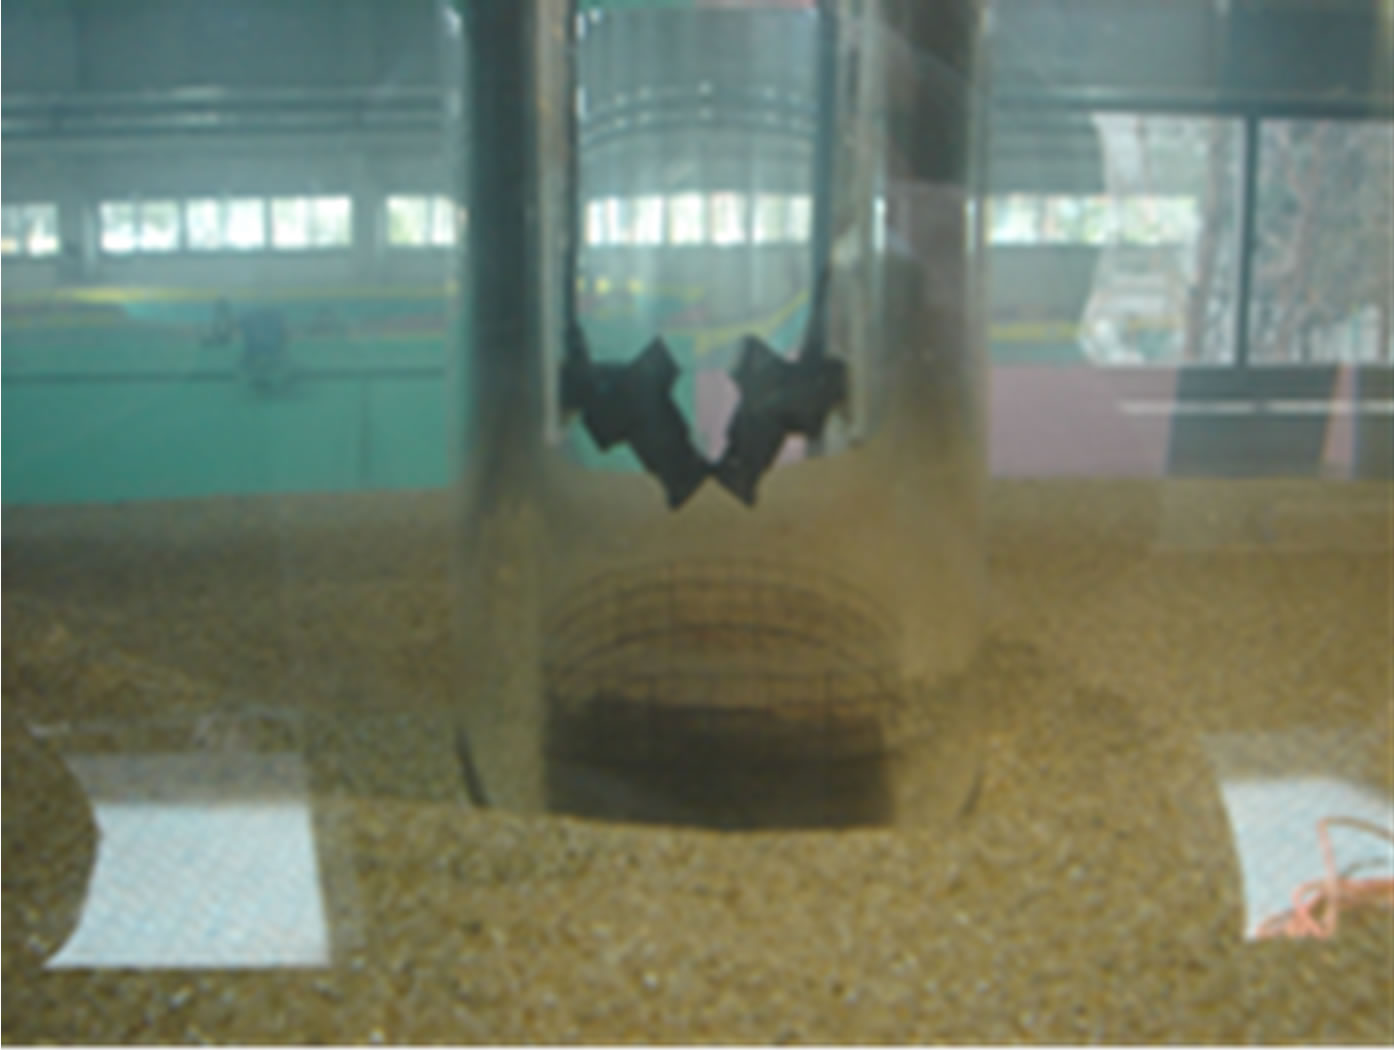
Figure 2. CCD in the model pier.
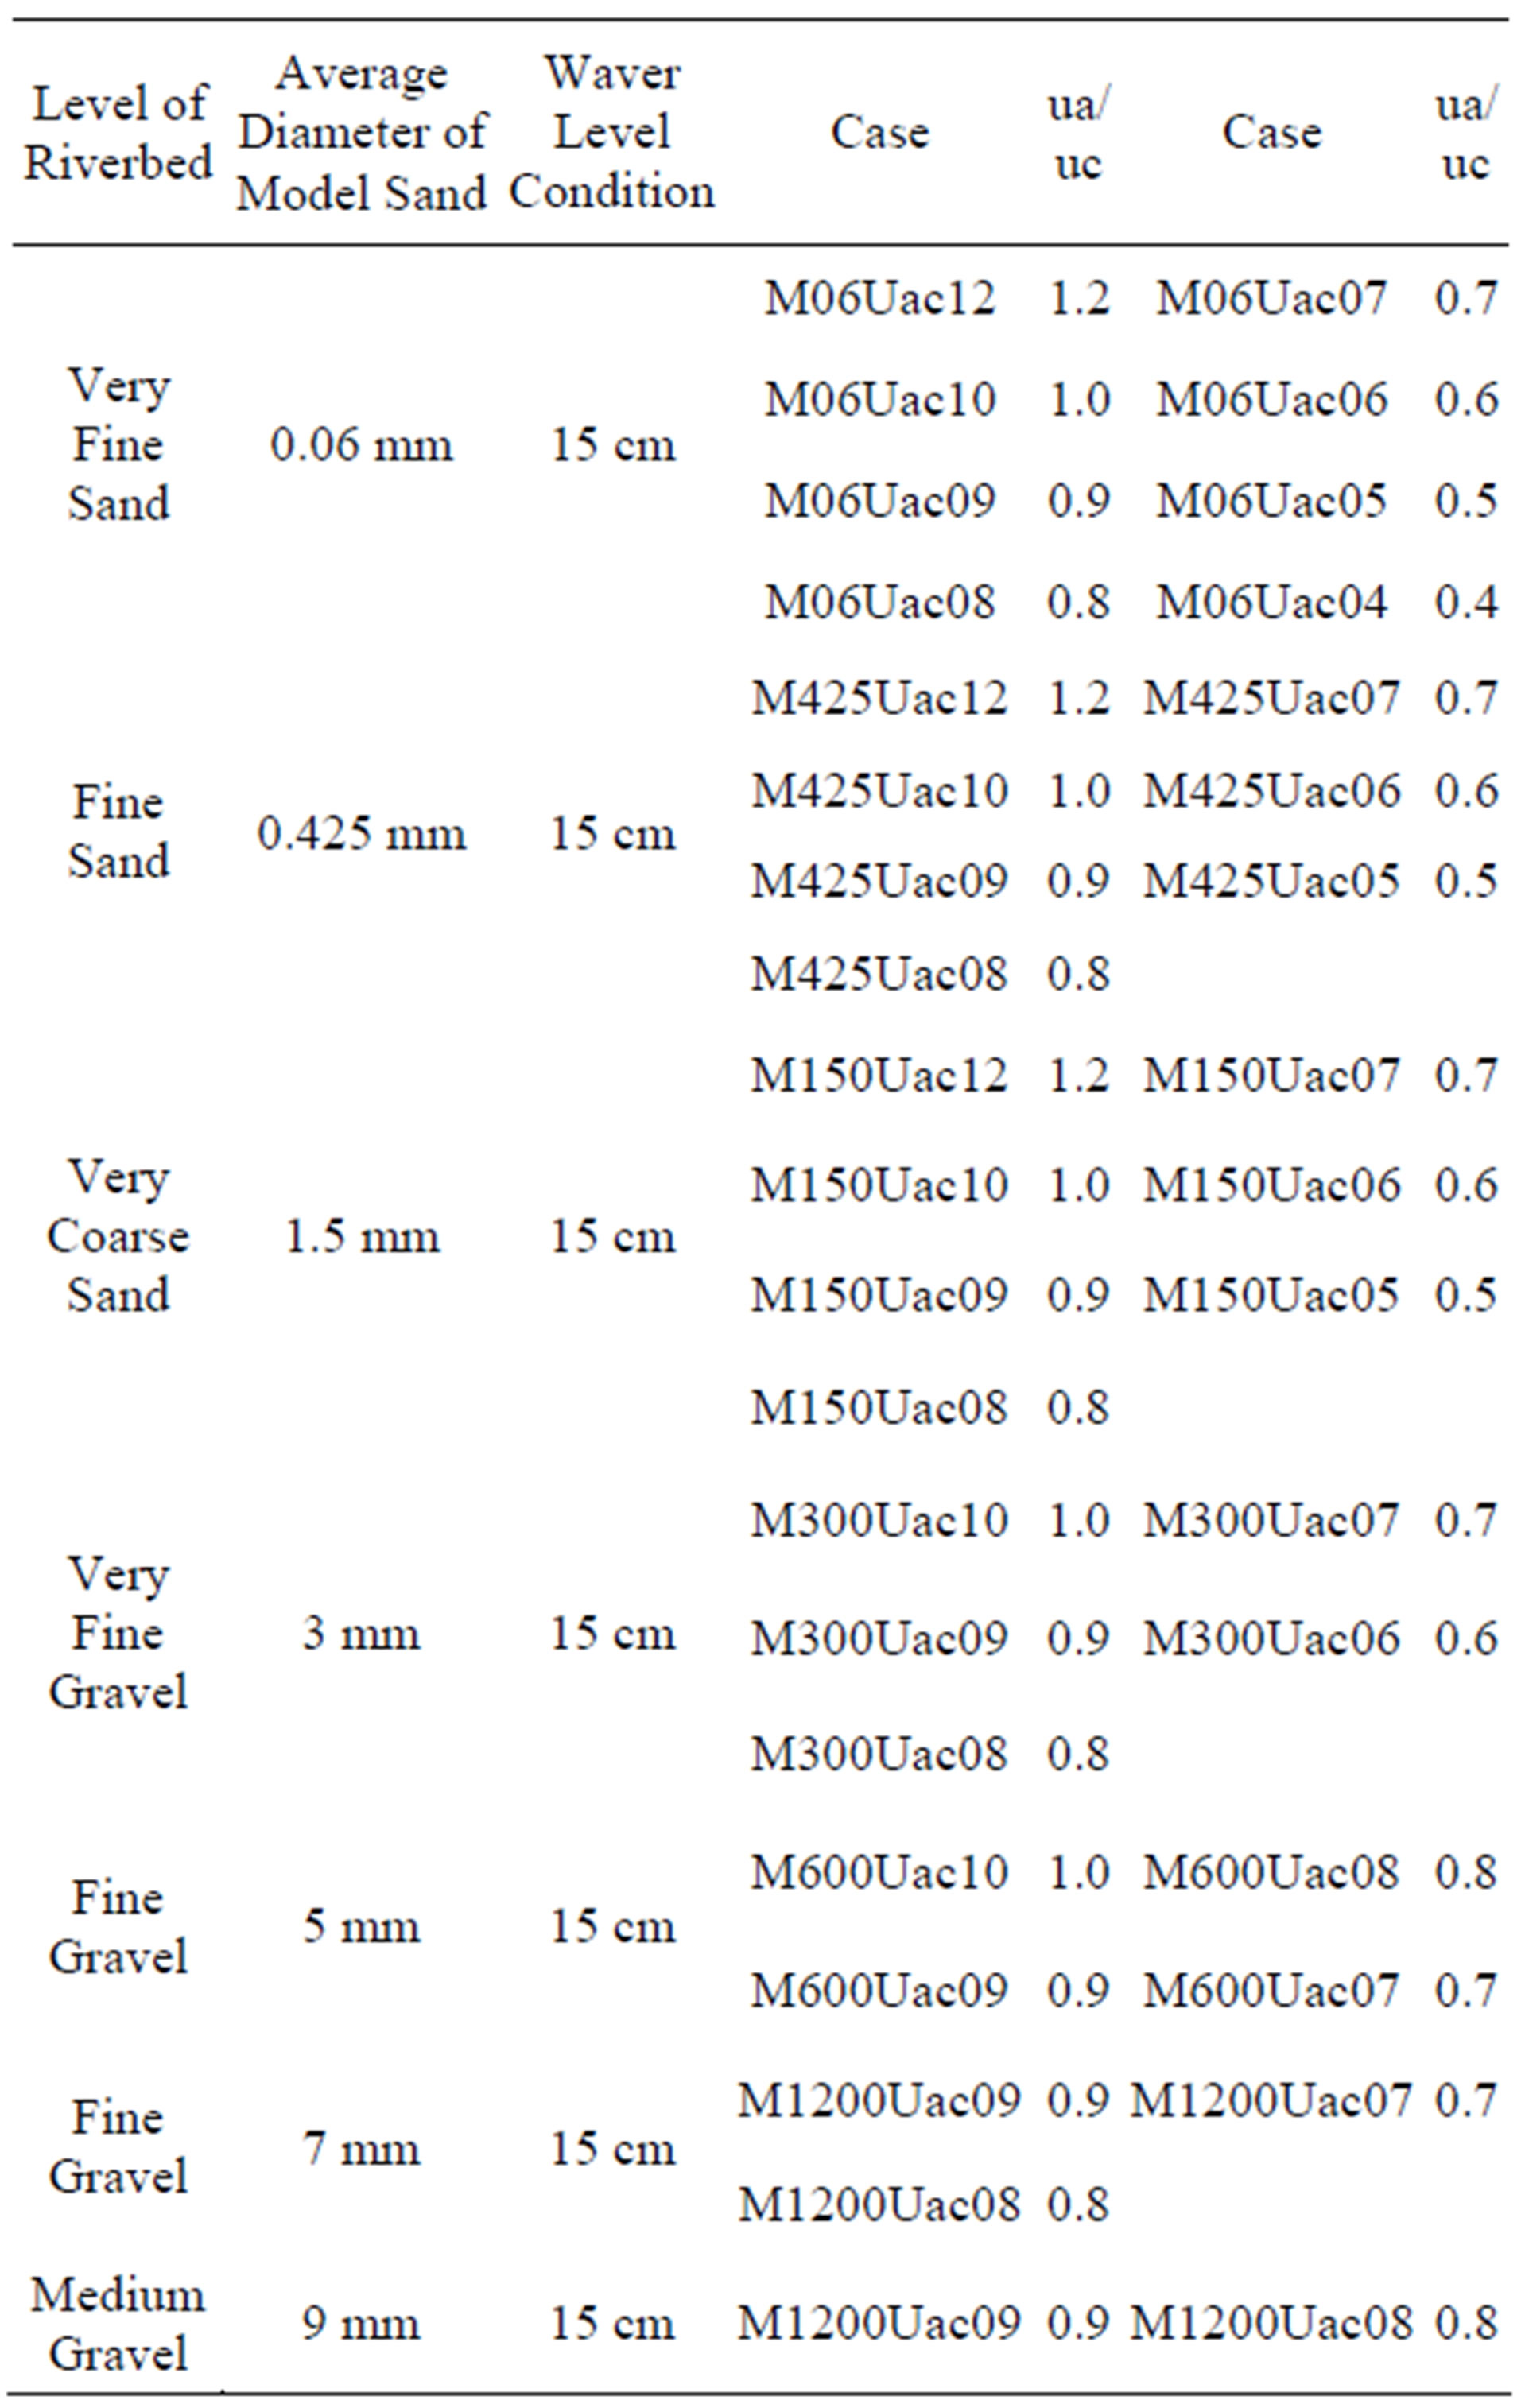
Table 1. Experiment conditions.
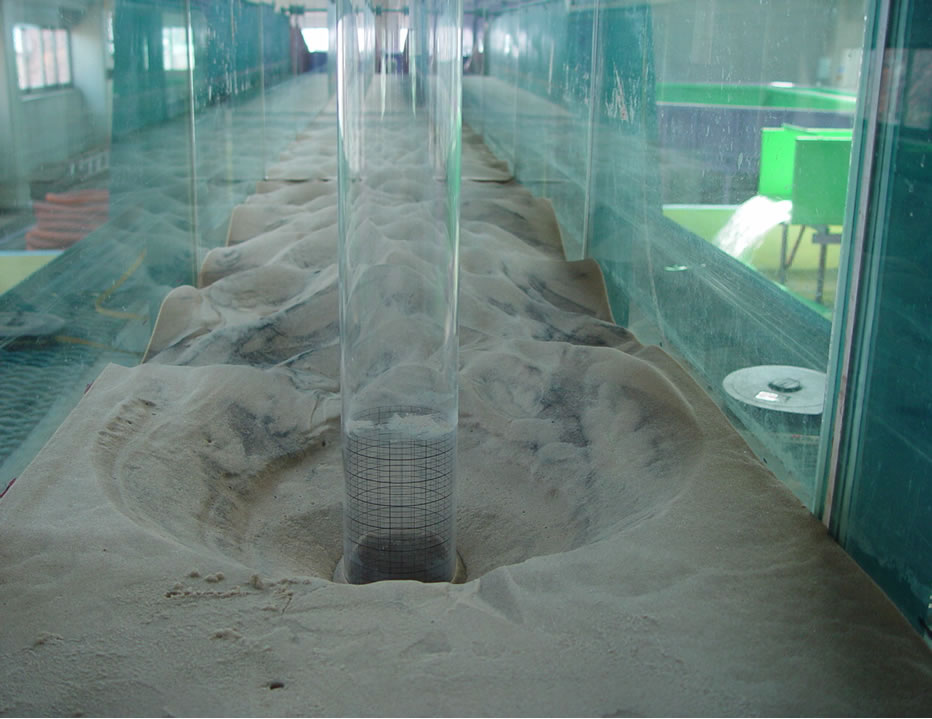
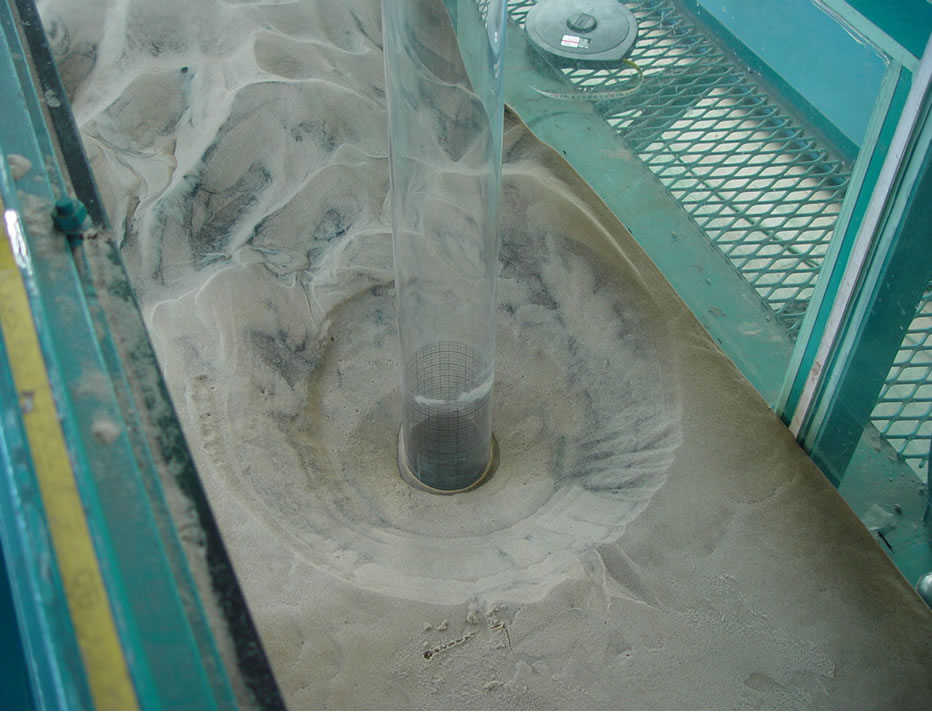
Figure 3. Scour hole and shape.
3. Analysis of Results
The corrosion process is assumed to be influenced by the shear stress applied on the boundary between the riverbed of the pier hole and the flow. The shear stress of the riverbed becomes the maximum value at the initial condition of scour generation, and it gradually decreases while the scour depth increases, until it approaches the equilibrium scour depth or the maximum scour depth Zmax. When the scour depth is z at time t, with the scour still proceeding, the shear stress is distributed along the vicinity of the pier. The maximum value of shear stress at the point, with the scour depth assumed to be z, is defined as τ(z) is defined as instantaneous maximum shear stress τ(z). Since the value of τ(z) becomes the highest right before the scour emerges, the initial maximum shear stress (t = 0) is defined as τmax.
The critical value of sand corrosion is called “critical shear stress τc”, and the scour emerges when the shear stress is bigger than the critical shear stress. The τc of sand is not changed when a scour hole develops, unlike the decrement of general shear stress τ(z), which is its characteristic. Based on the above analysis, an explanation of the development process of scour was derived, as shown in Figure 4.
The change in scour depth along time is compared with the change along flow intensity in Figure 5. Flow intensity indicates the ratio of the critical velocity of the pier, approaching flow velocity, and of the riverbed material. The interrelationship between the scour depth and the time recursion formula for each condition is very positive. However, it is very difficult to suggest a generalized recursion formula for scour depth and time.
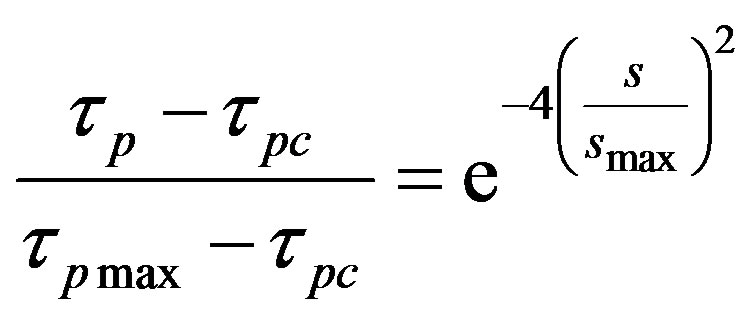
The ratio of scour depth and shear stress from Figure 6, which show a decrement model of shear stress, were compared. In Figure 7, τp (z) is assumed to have the biggest value right before the scour emerges, the initial maximum shear stress (t = 0) is defined as τpmax, and the
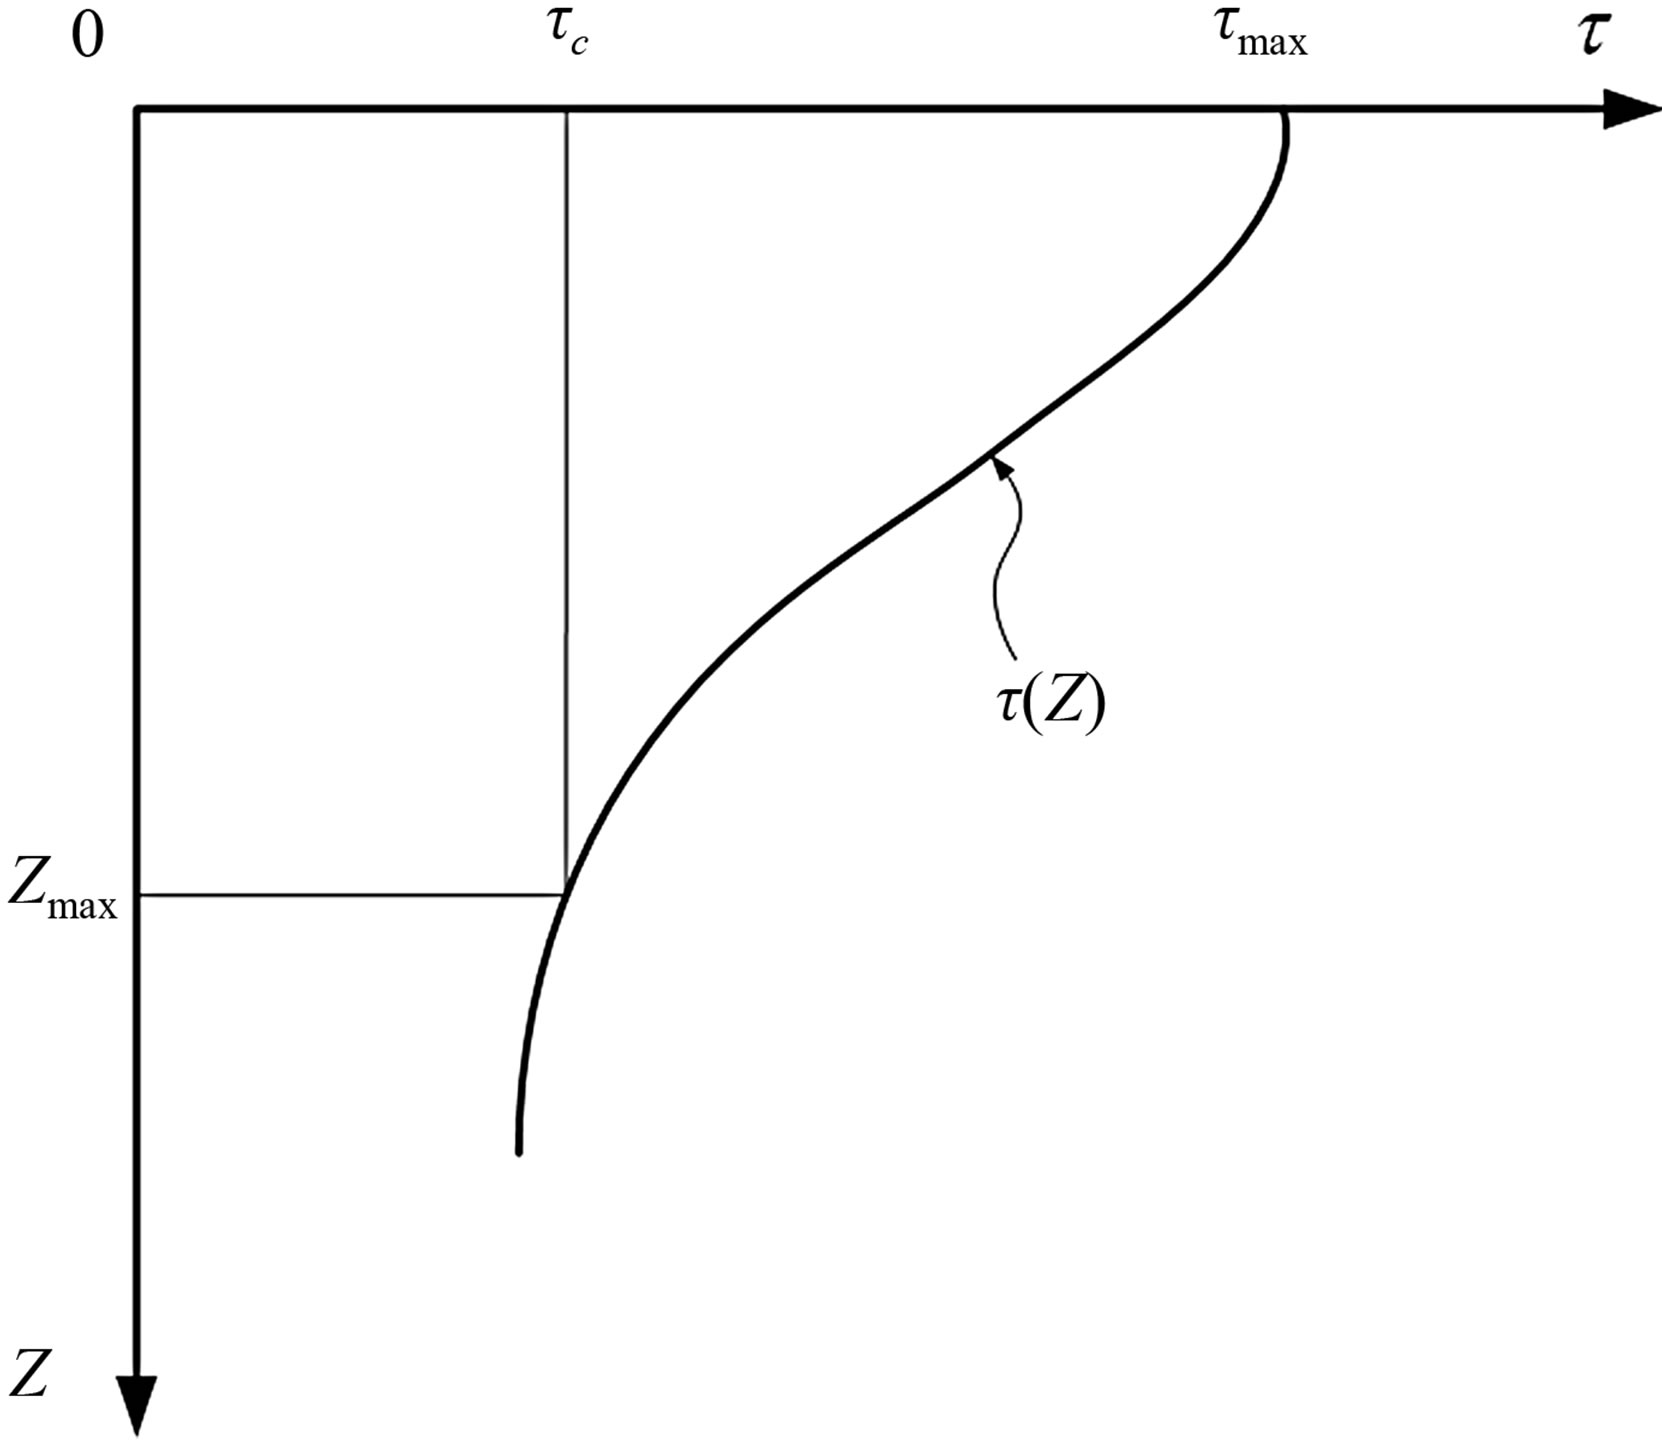
Figure 4. The process of developing scour.
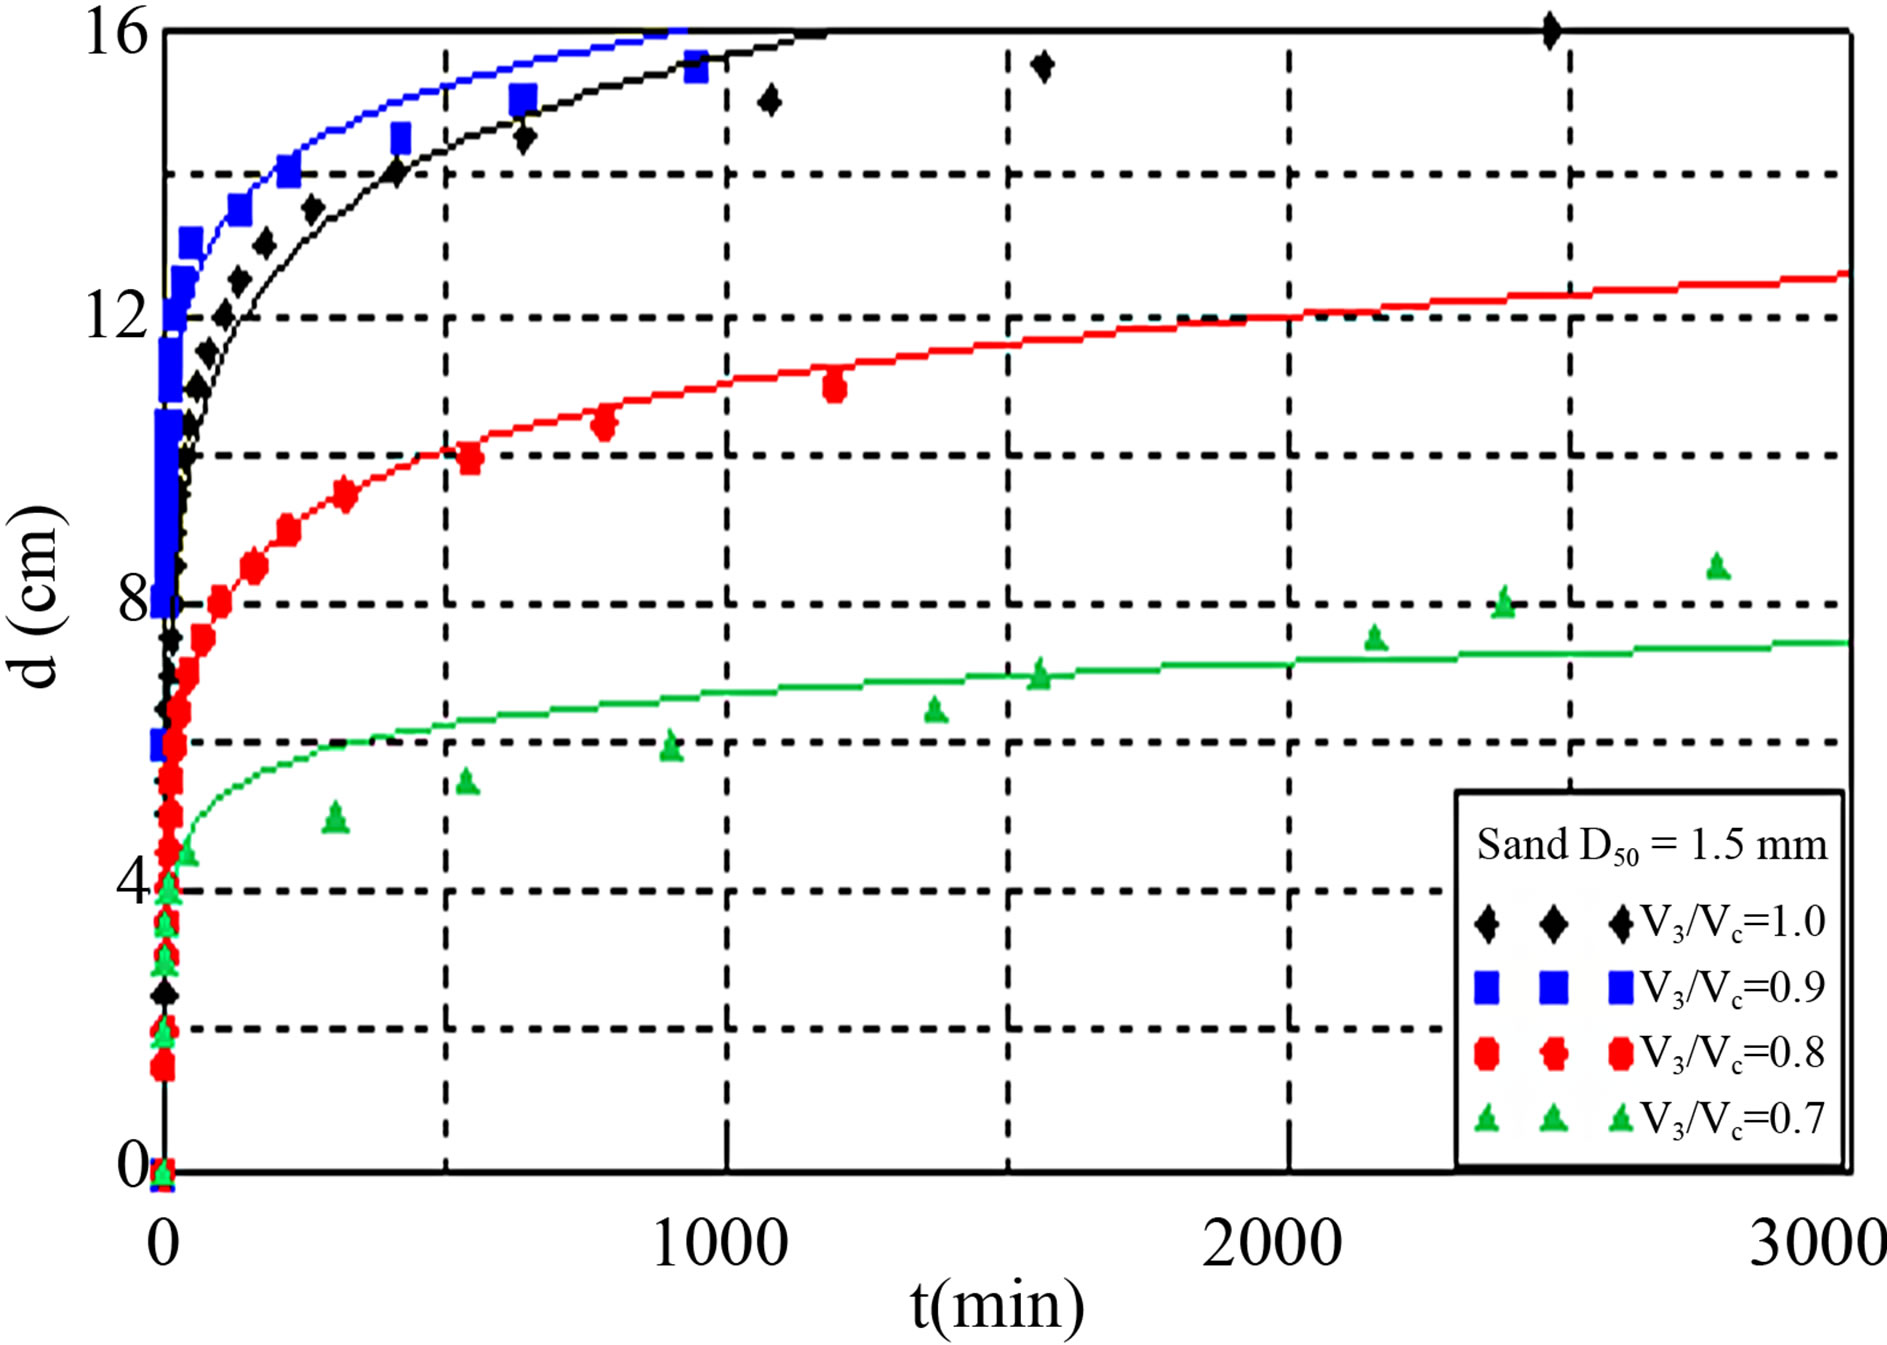


Figure 5. Change in scour hole along time (sand analysis example).
critical shear stress when maximum scour depth is attained is defined as τc. The shear stress ratio for the relationship of the scour decrement and the shear stress reduction ratio is stipulated using Ya Li [3].
The change in shear stress shows the difference between the identical flow intensity depending on the con-
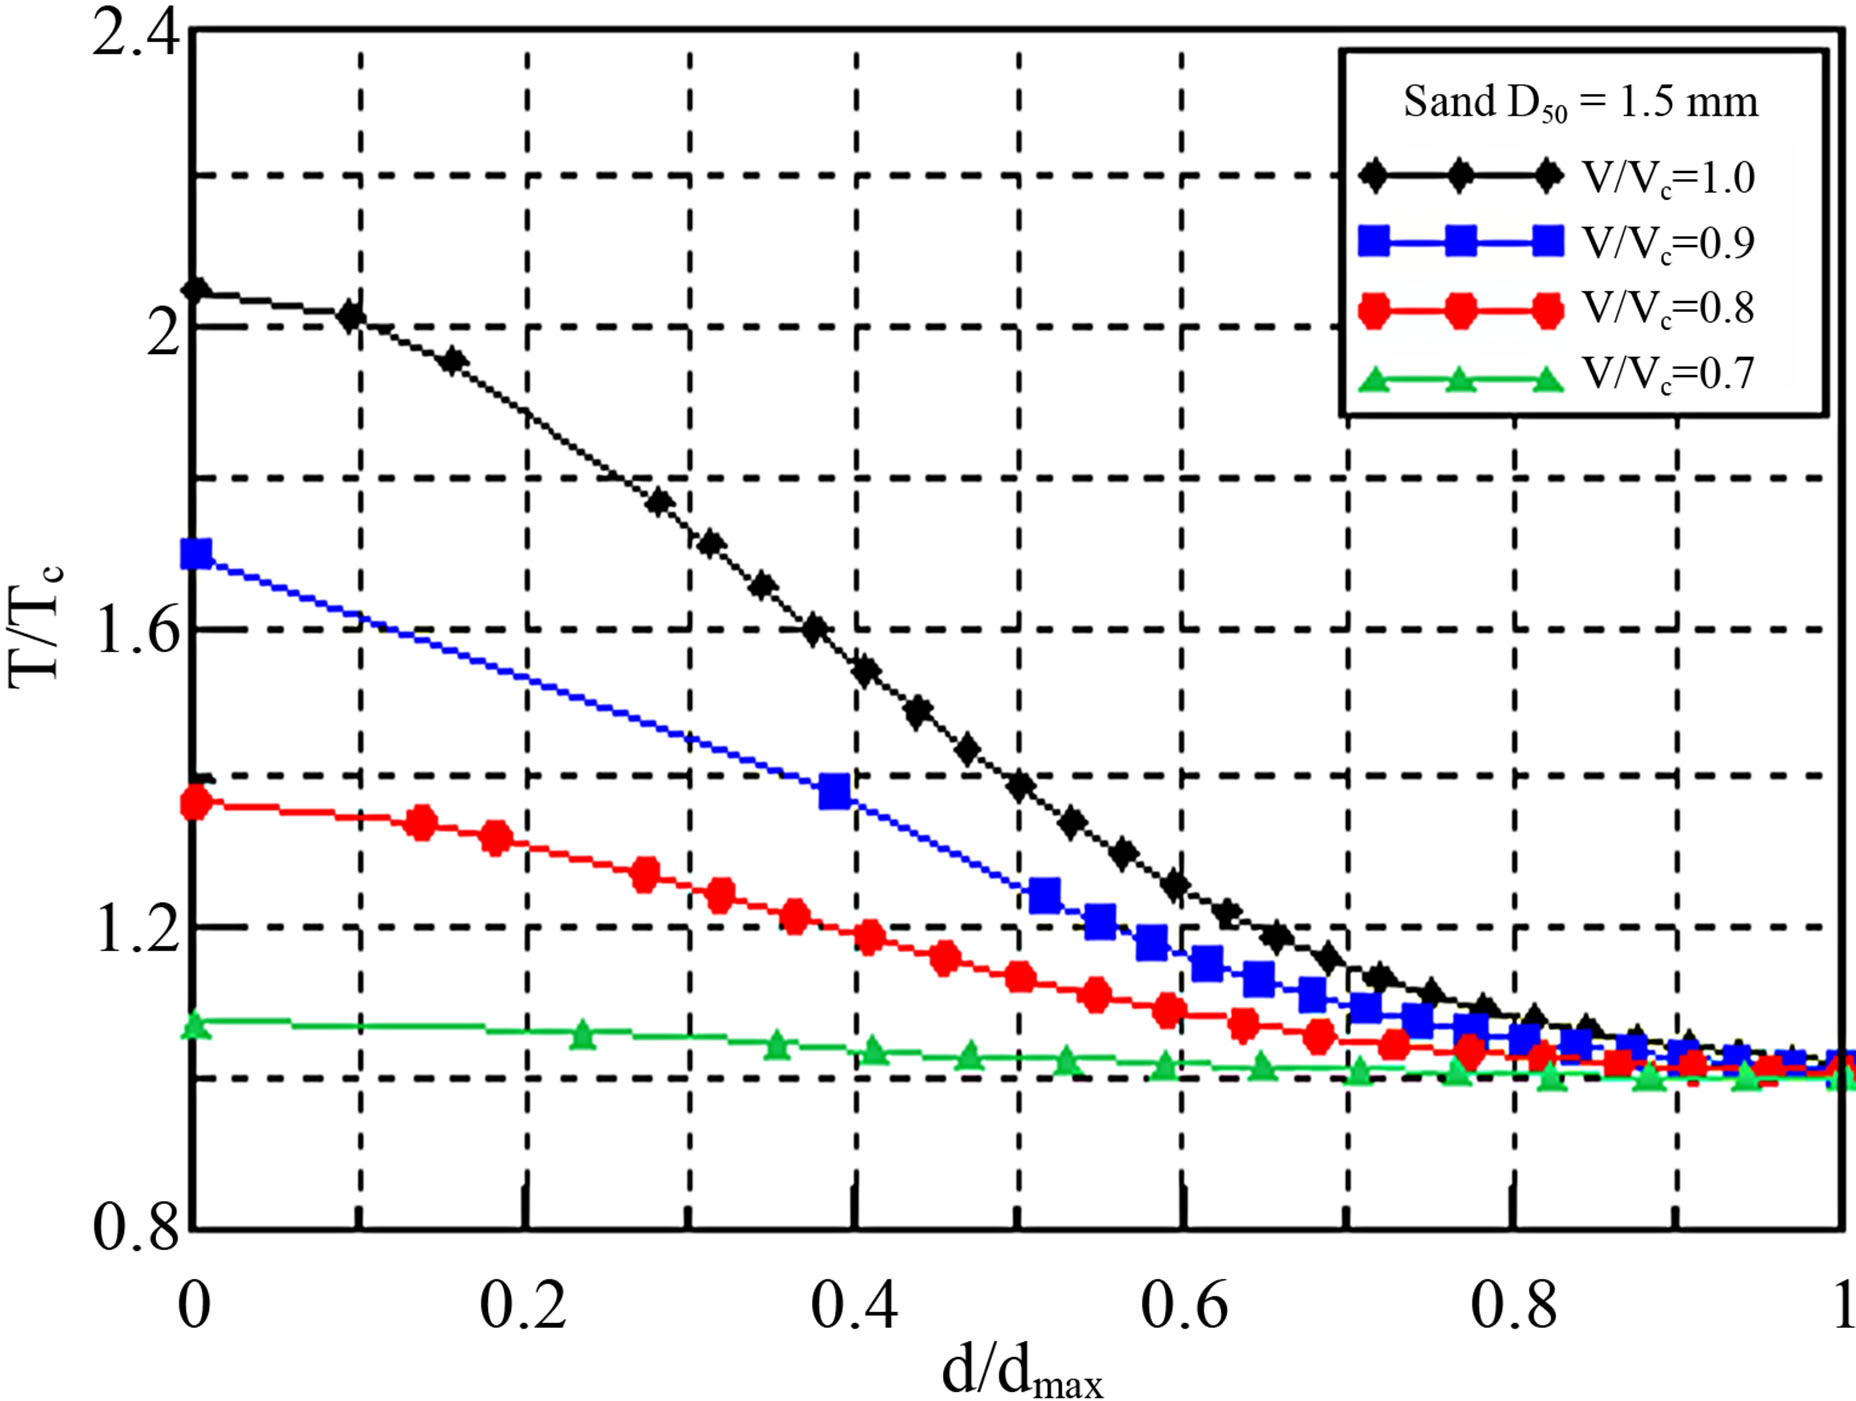
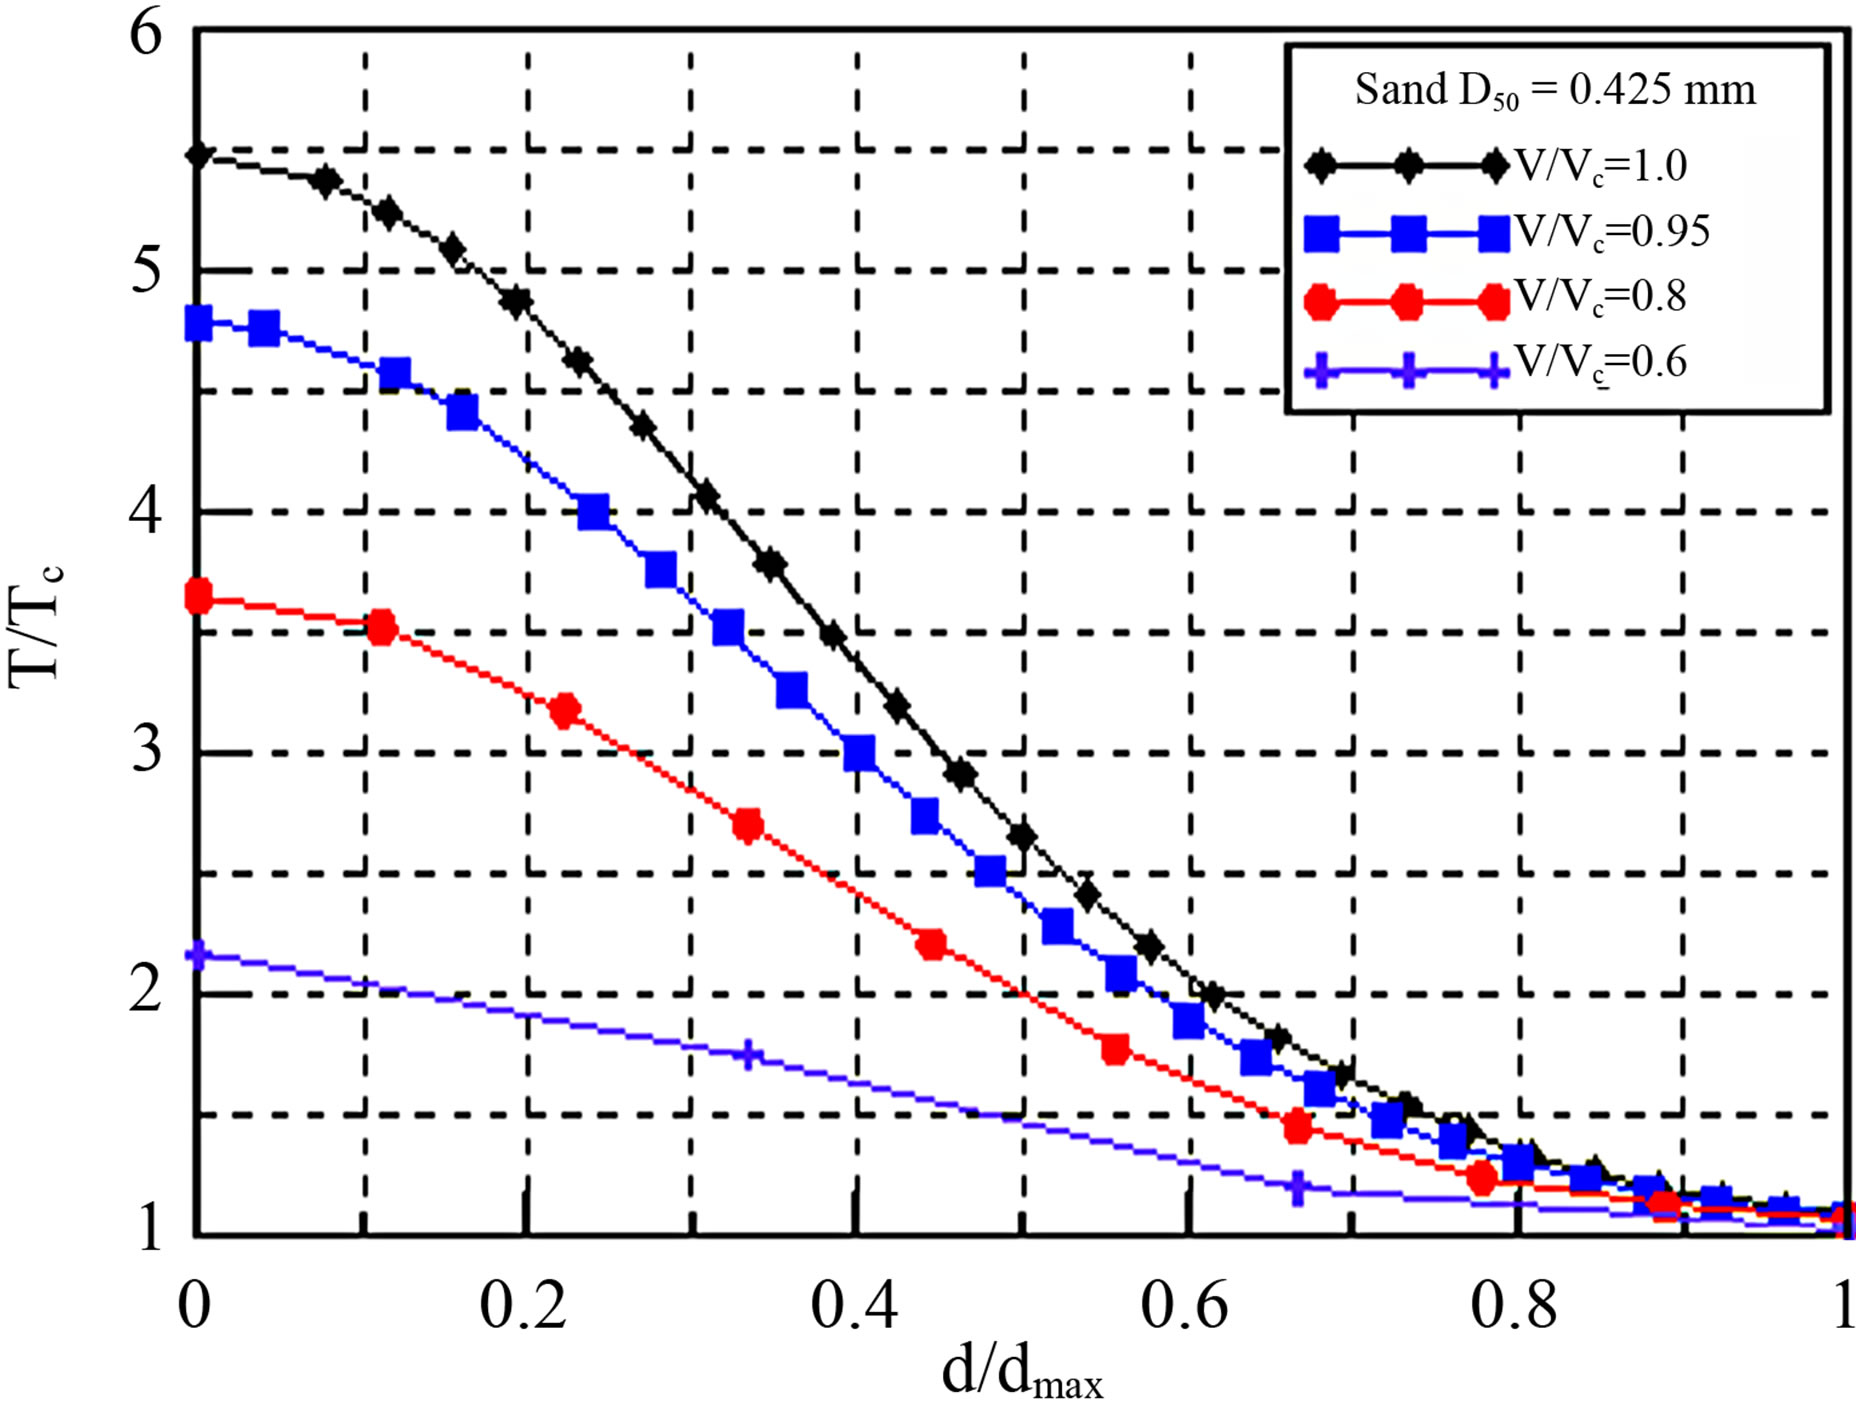
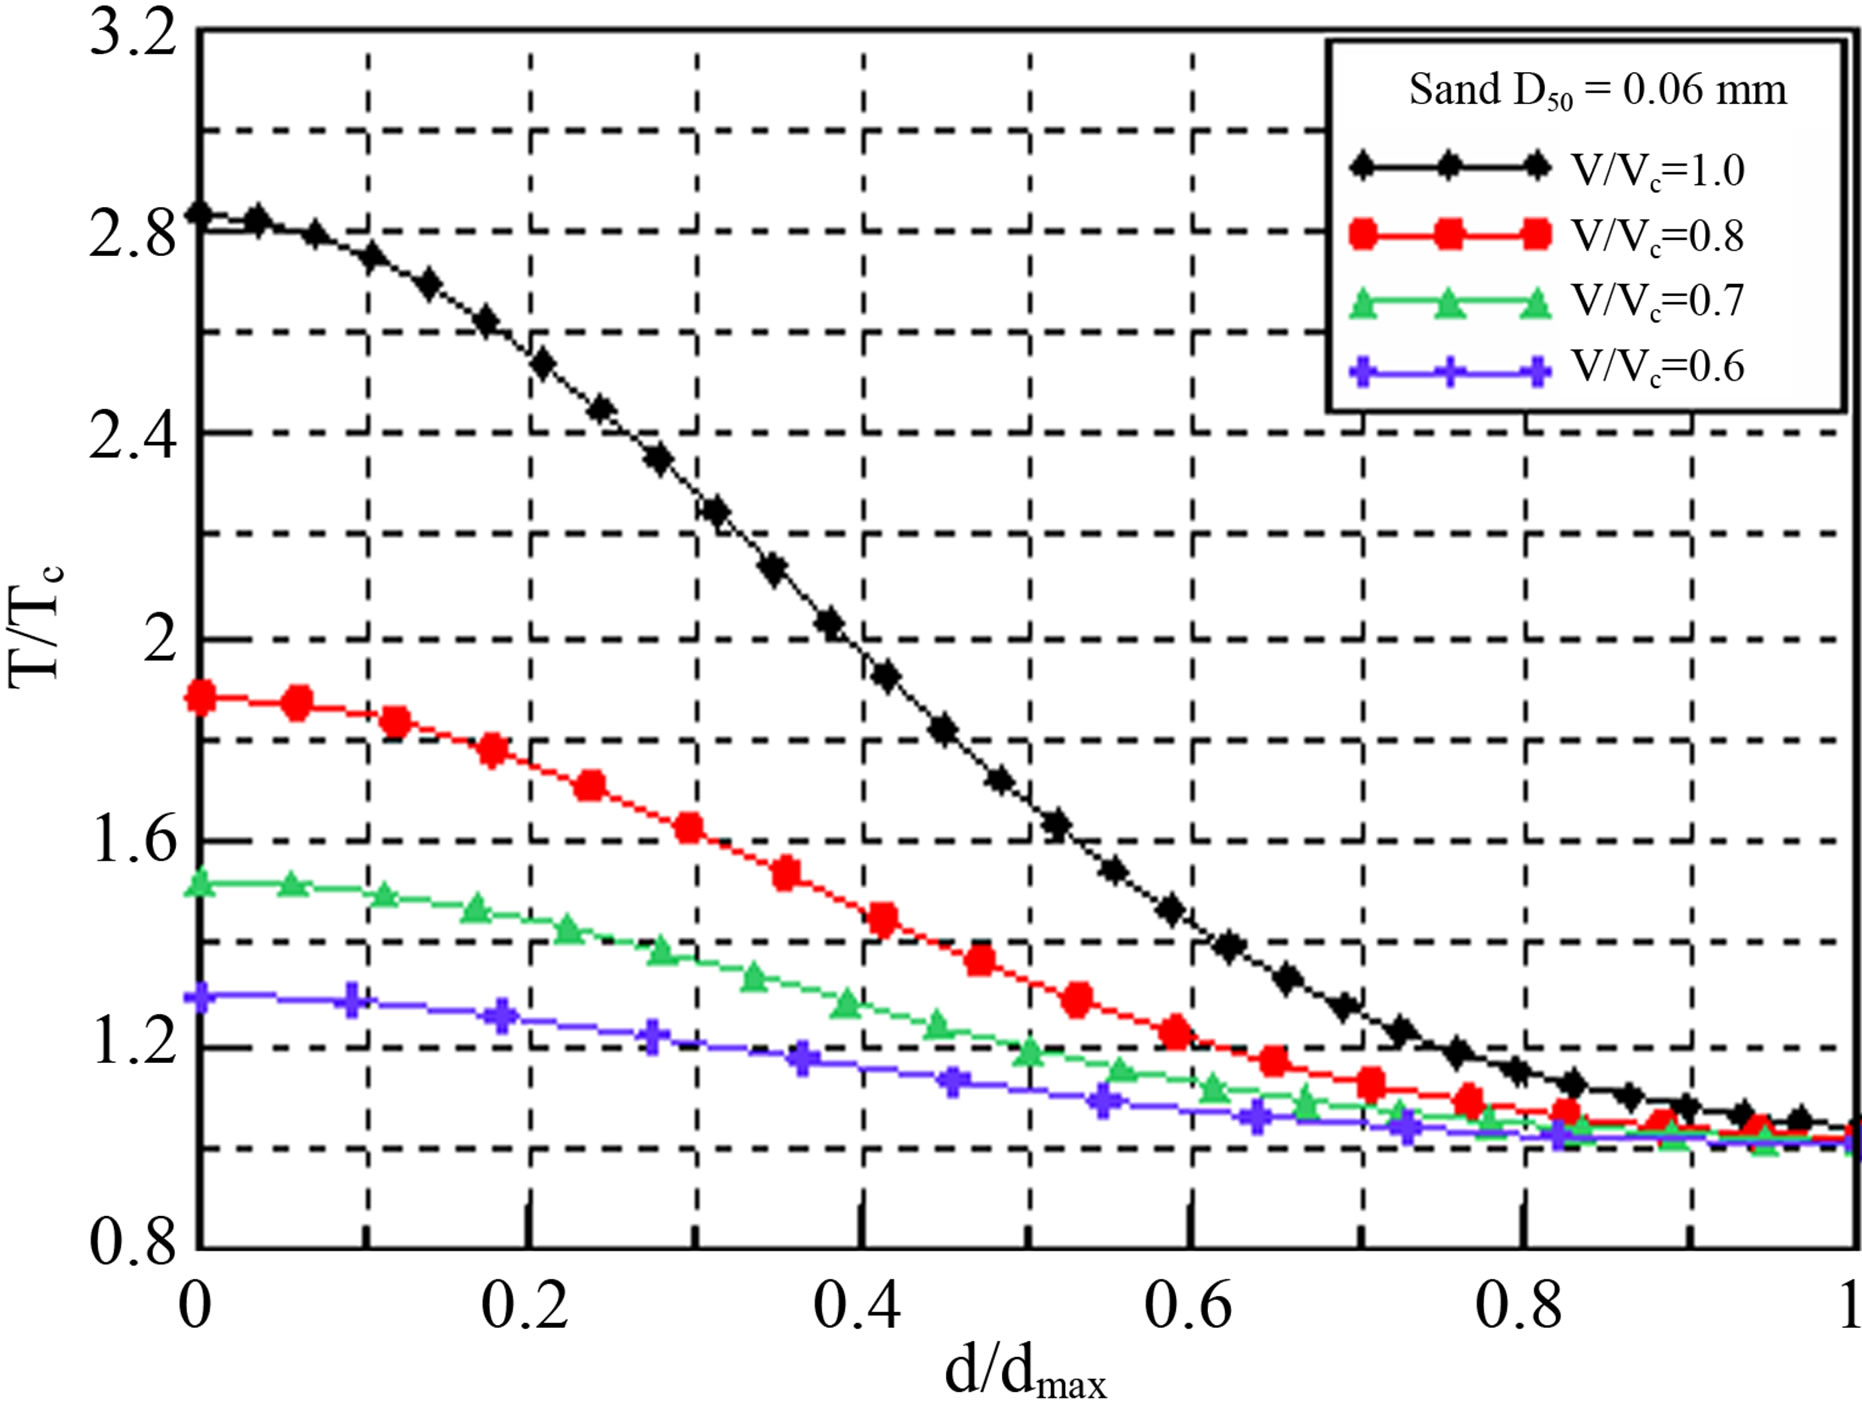
Figure 6. The change in shear stress based on pier depth (Ya Li [3], 3 cases).
dition of the particle. The reduction rate is relatively bigger in the scour depth ratio since the initial maximum shear-stress ratio becomes bigger as the critical shear stress becomes smaller.
Figures 8-10 show the changes in shear stress applied by the sediment transportation equation, with the quantity of the riverbed change for each scour depth, through the shape of the scour when the maximum scour depth is reached.


The equations suggested by Meyer et al. [4] and Van Rijn [5] were applied to the sediment transportation equations, and the shear-stress changes were compared. The equations can be seen in Table 2.
The changes in shear stress based on the particle conditions and flow intensities were compared in this experiment. It was difficult to find the trend of the changes in shear stress based on the particle conditions and flow intensity. The maximum shear stress was generated at the ratio of maximum scour depth of 0.2 - 0.4. The former sediment transportation equations showed bigger values when the equations of Van Rijn were applied.
4. Conclusion
The changes along the time and particles were determined in this study through real-time measurement, us-
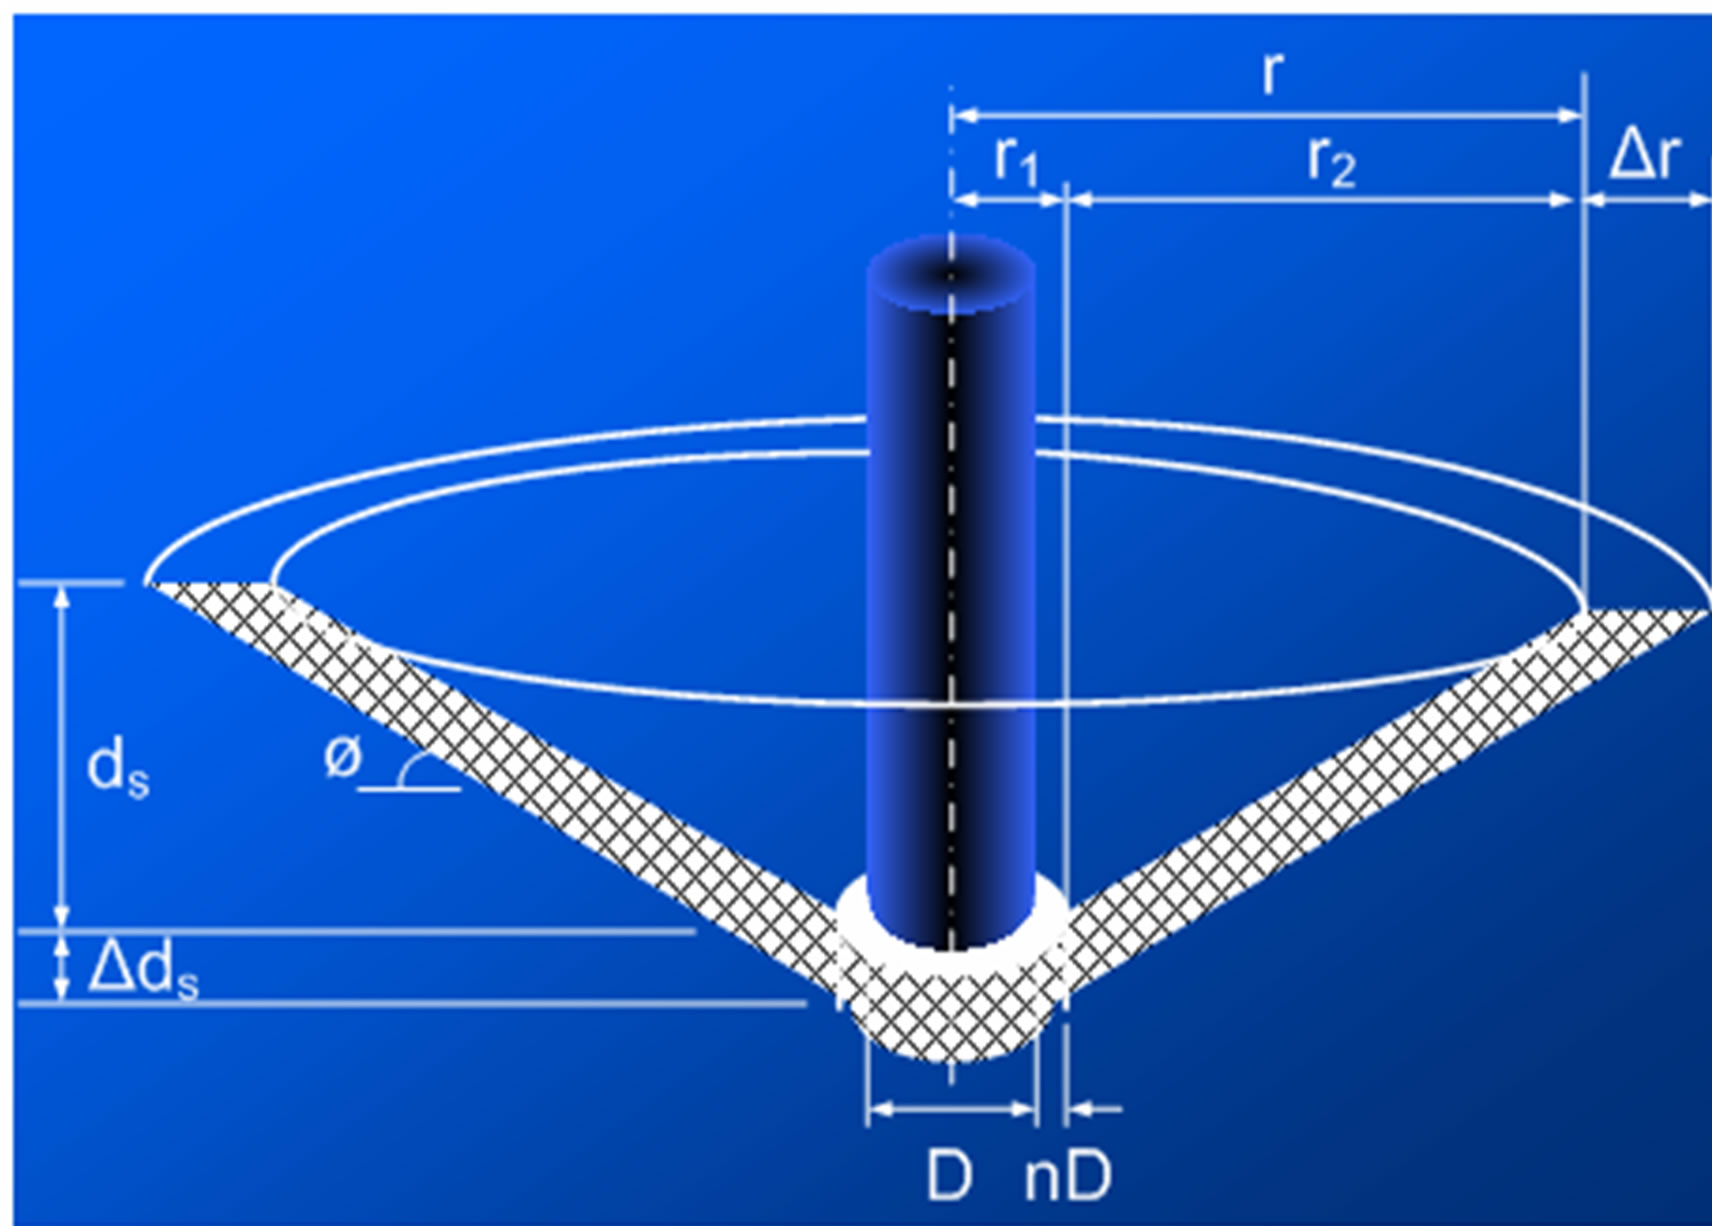
Figure 7. The key map for calculation of scour volume.
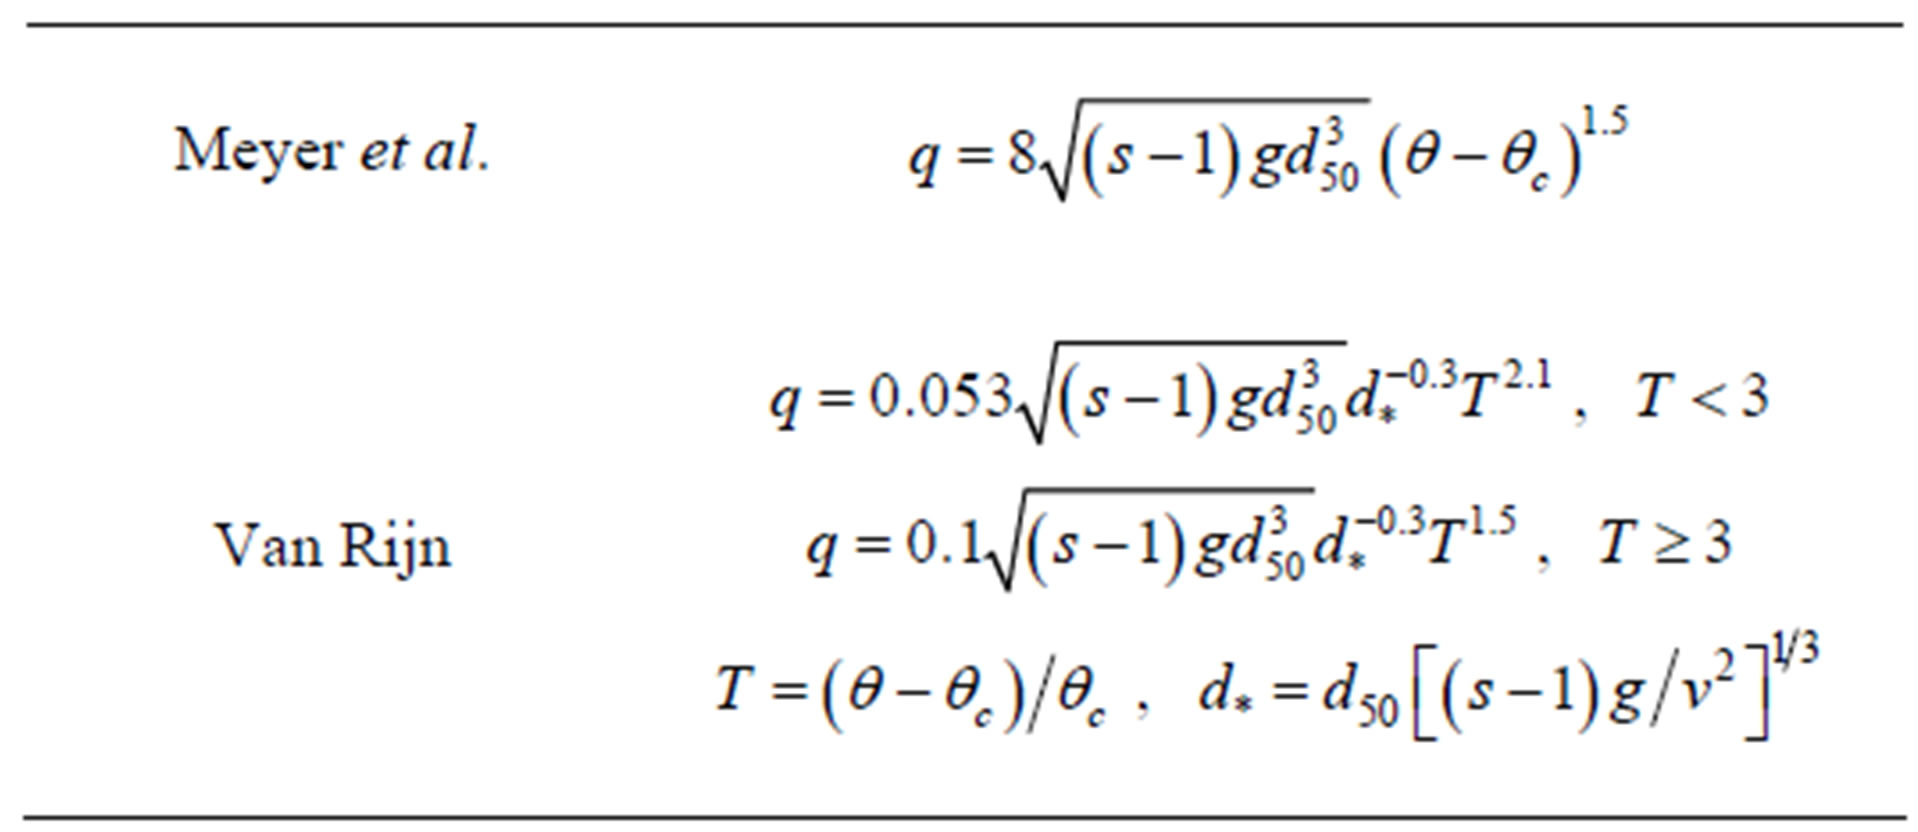
Table 2. Sediment transport equations.

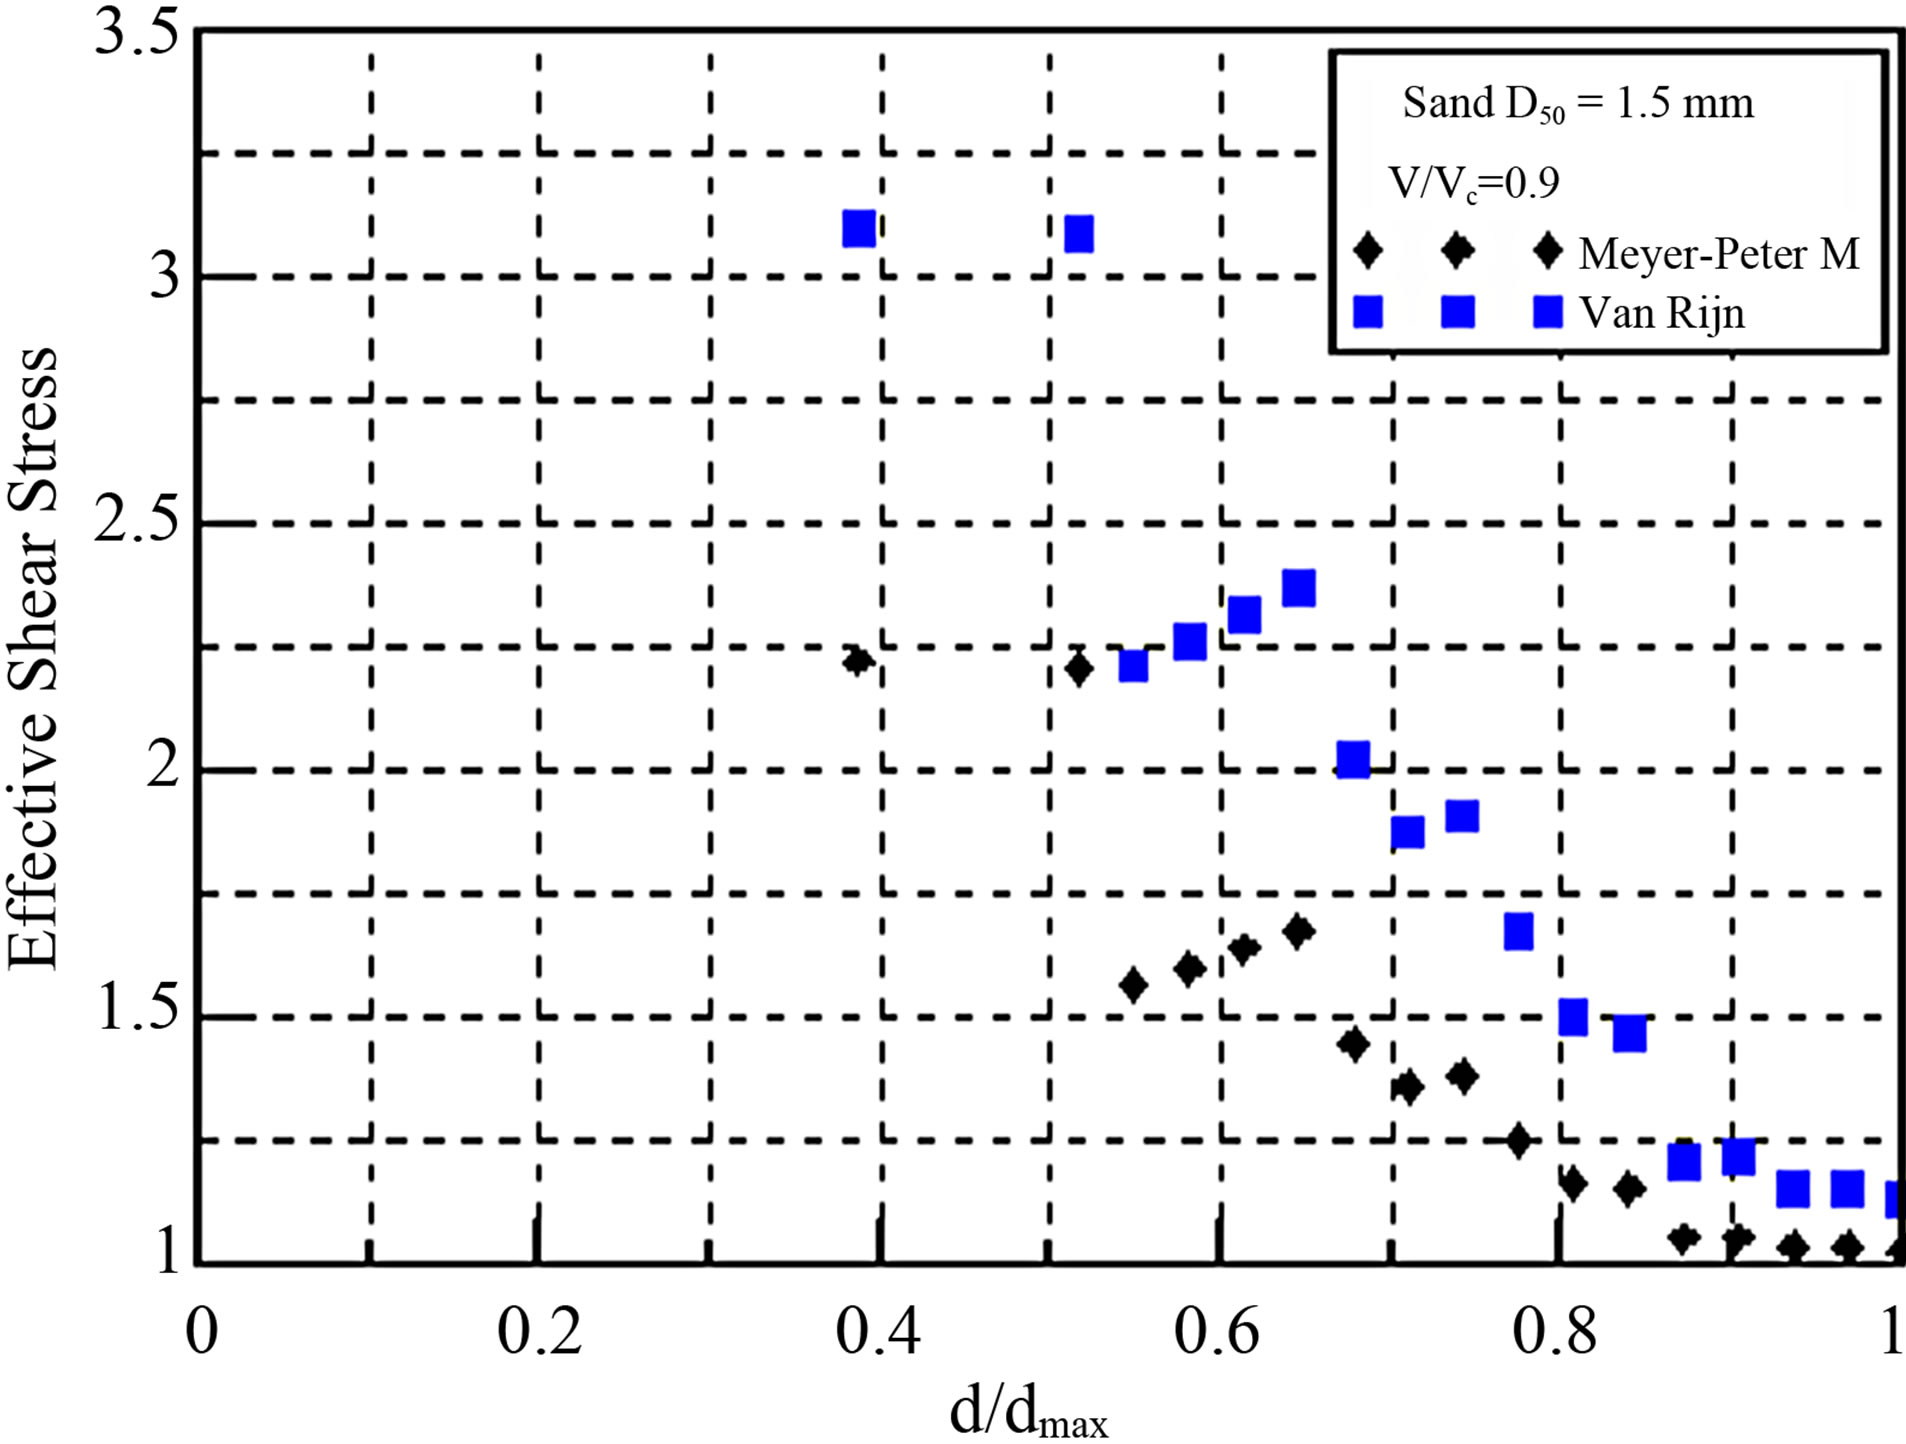

Figure 8. The changes in shear stress based on scour depth (sediment transportation equations, 1.5 mm).
ing various particles and the image method. The changes in the local scour along the time and the hydraulic condition of the generation of the initial scour in accordance with the size difference of the diameters of seven types of riverbed materials, and their results, were compared to the results of the past studies. Based on the data that were obtained, the changes in shear stress around the pier
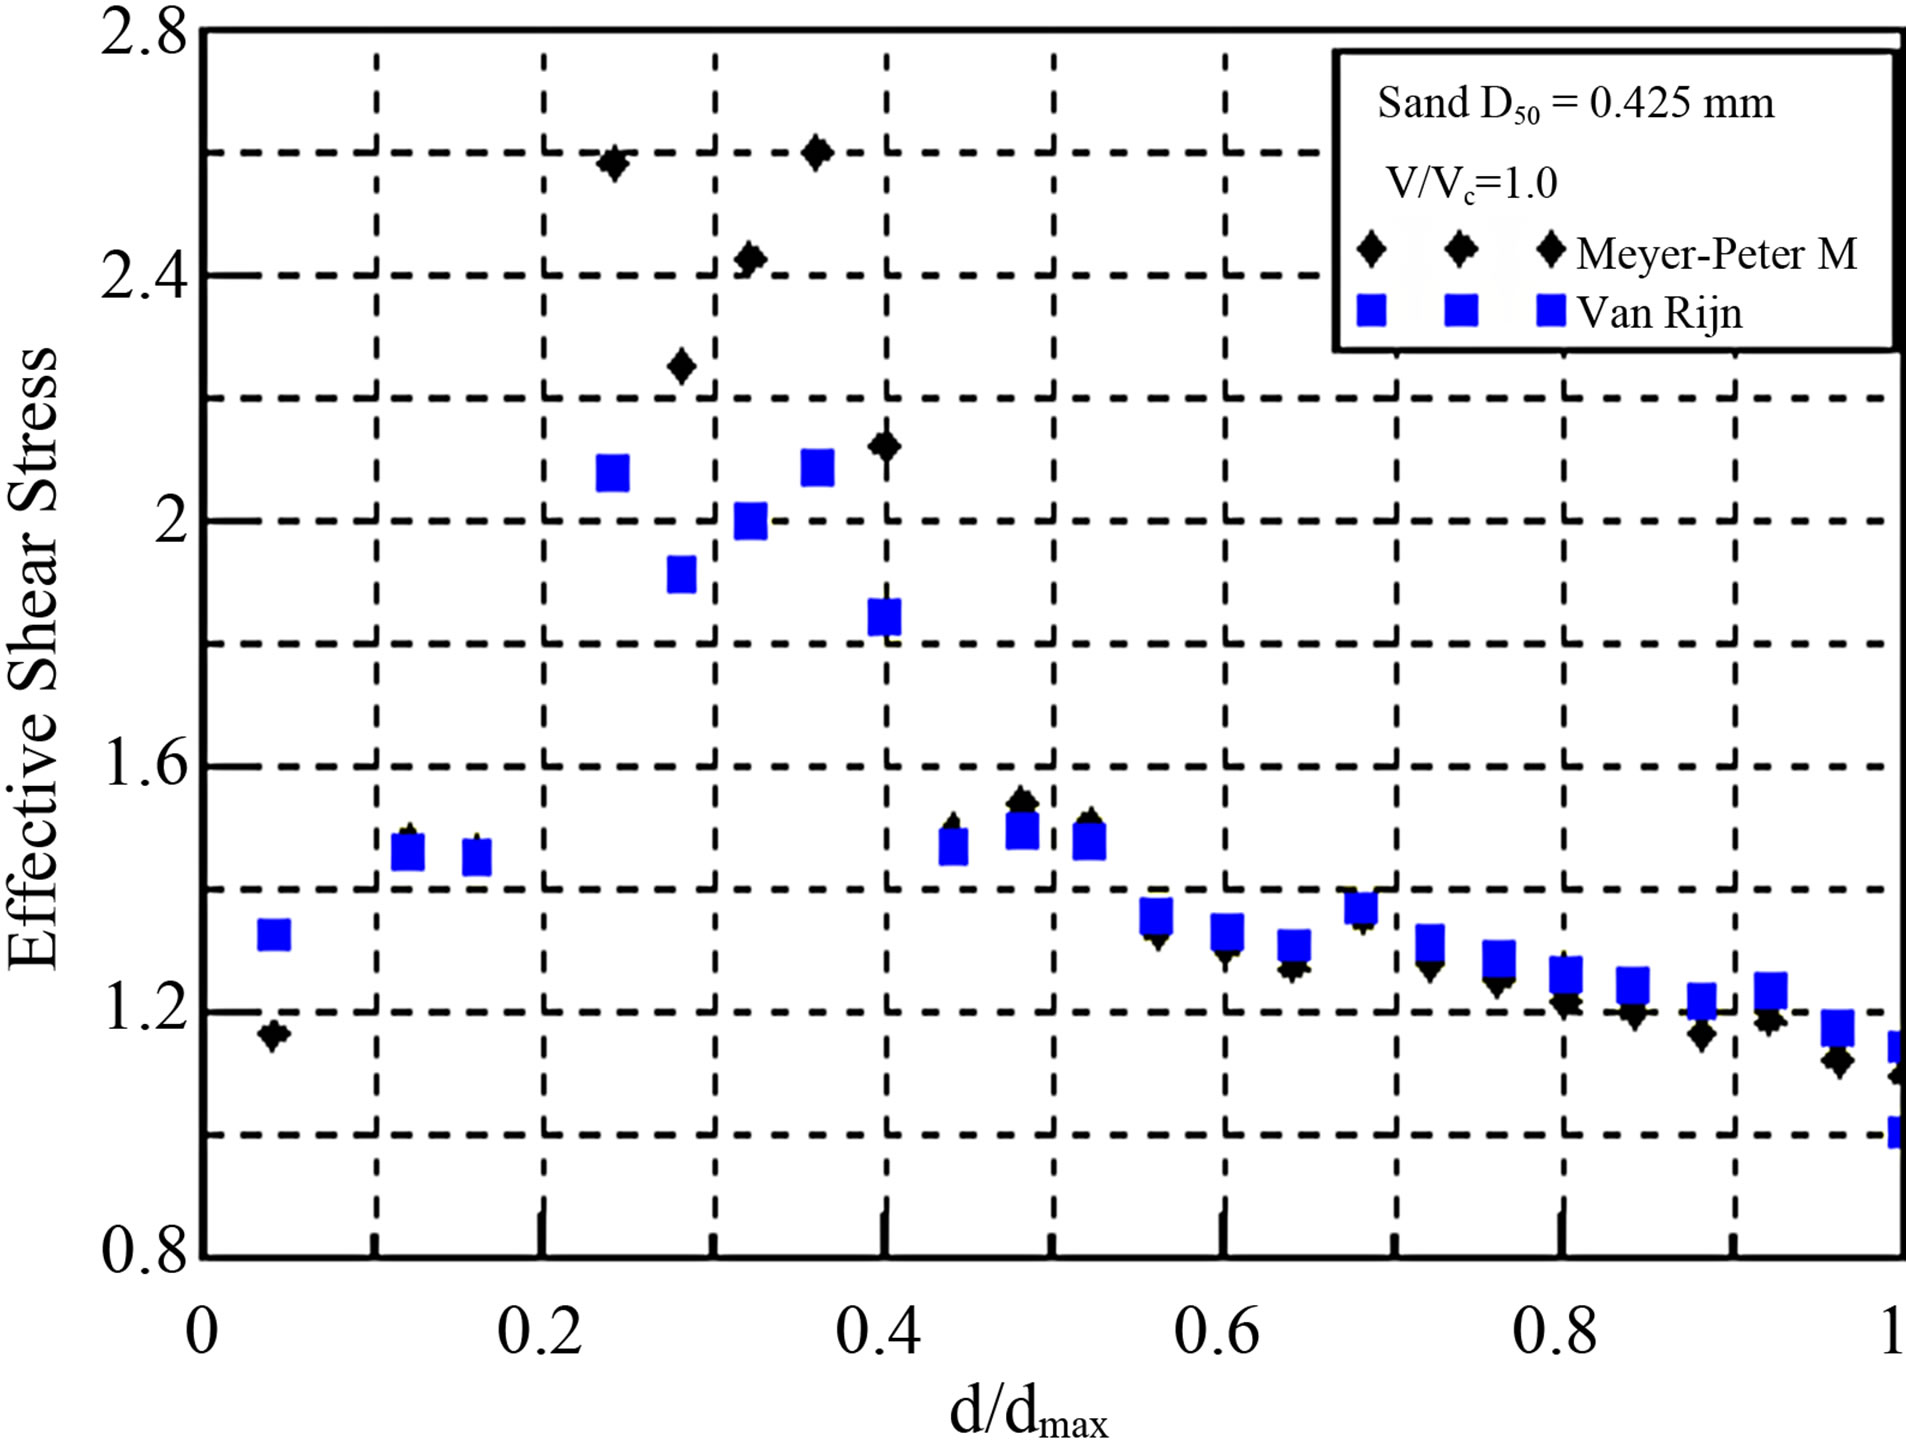
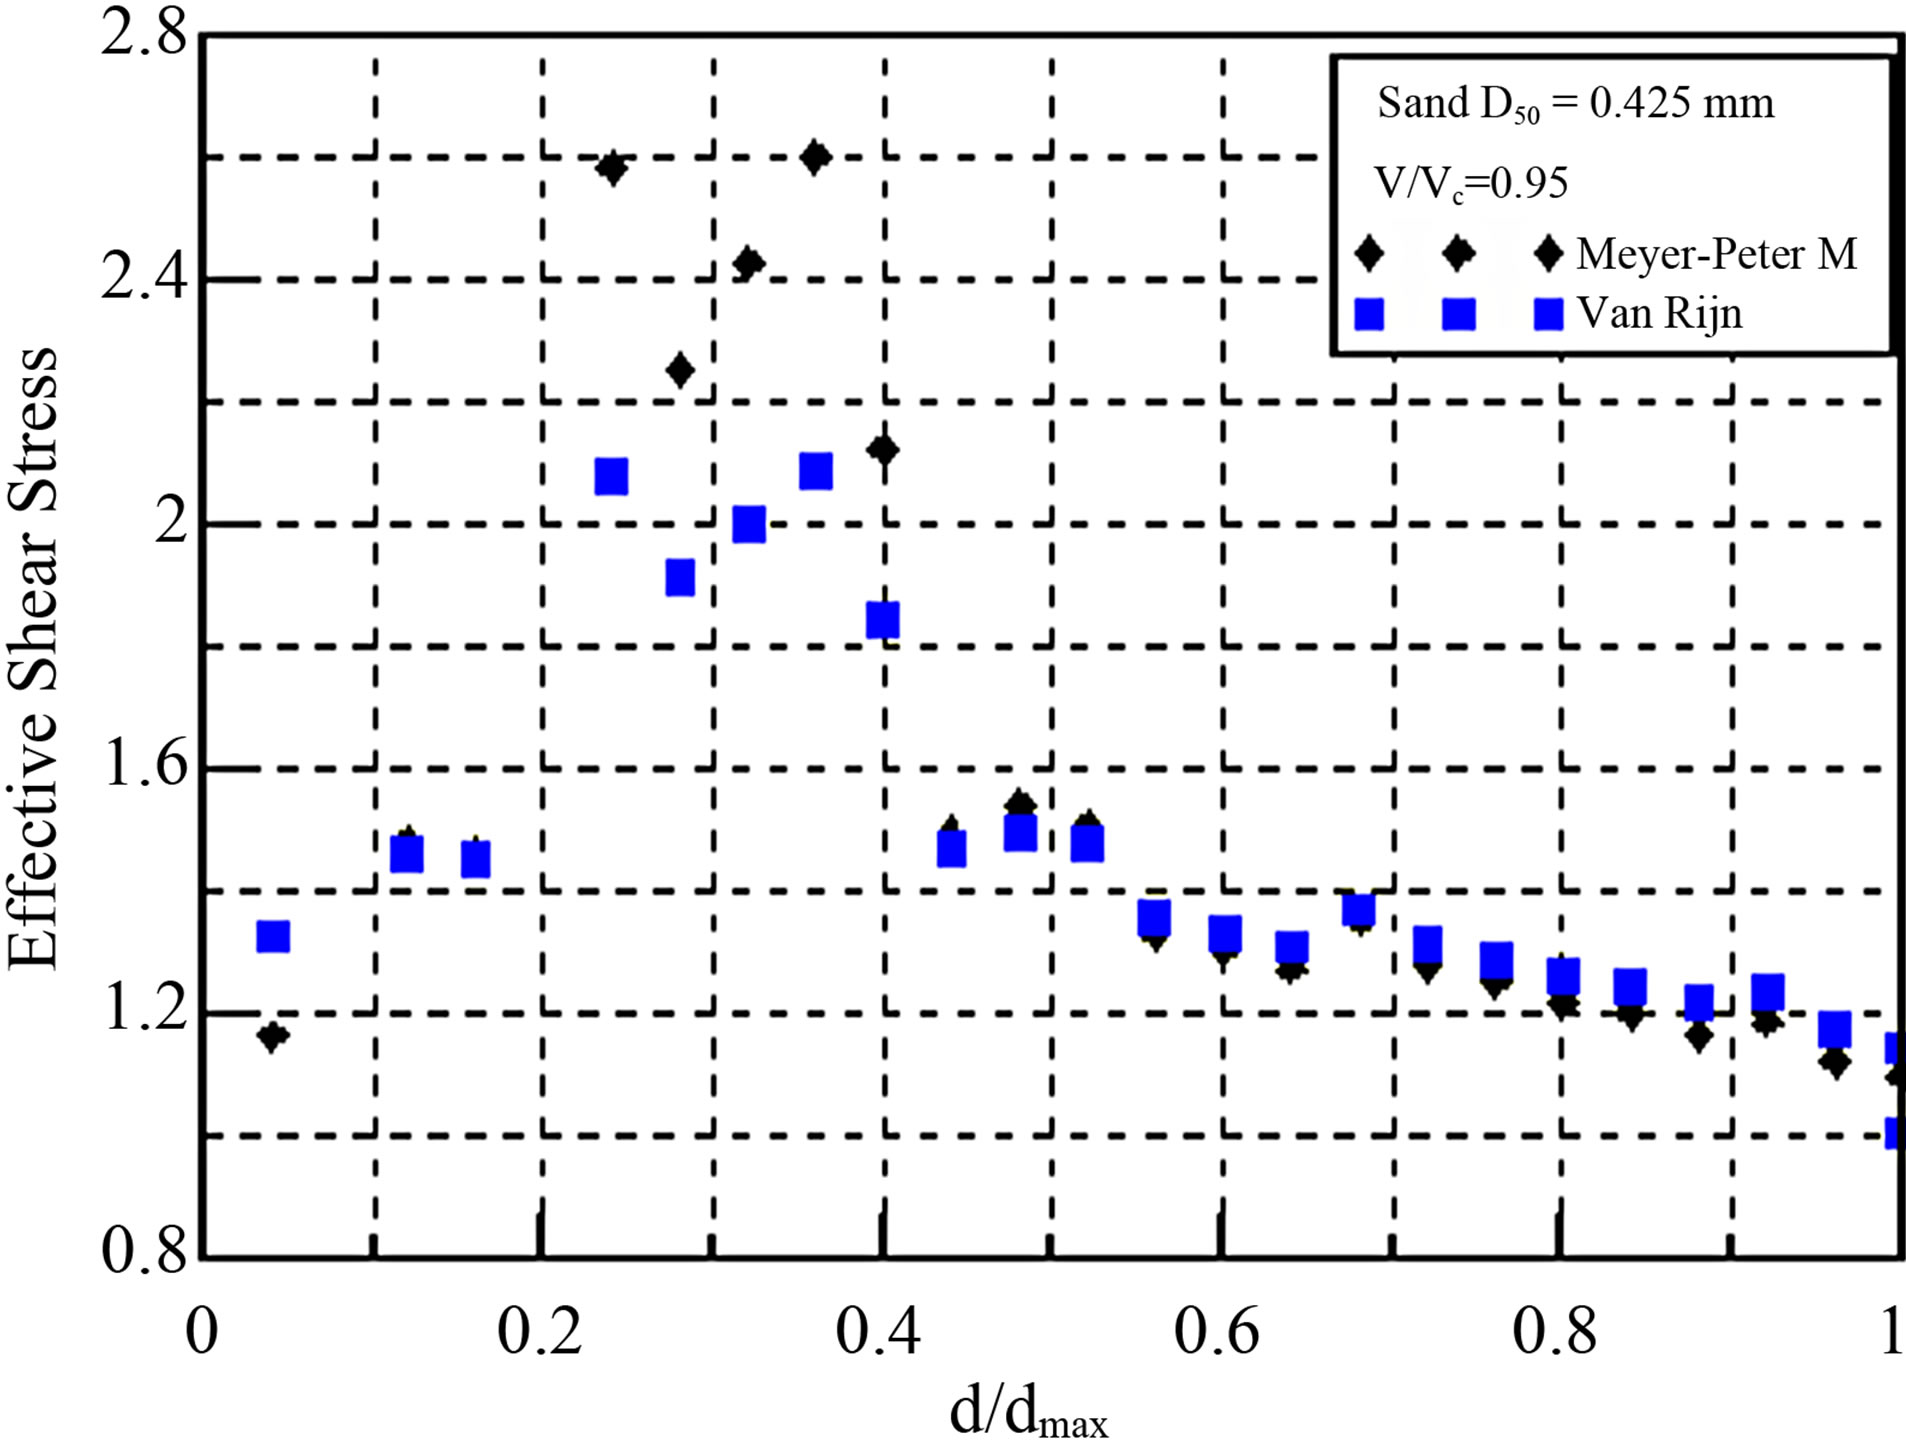
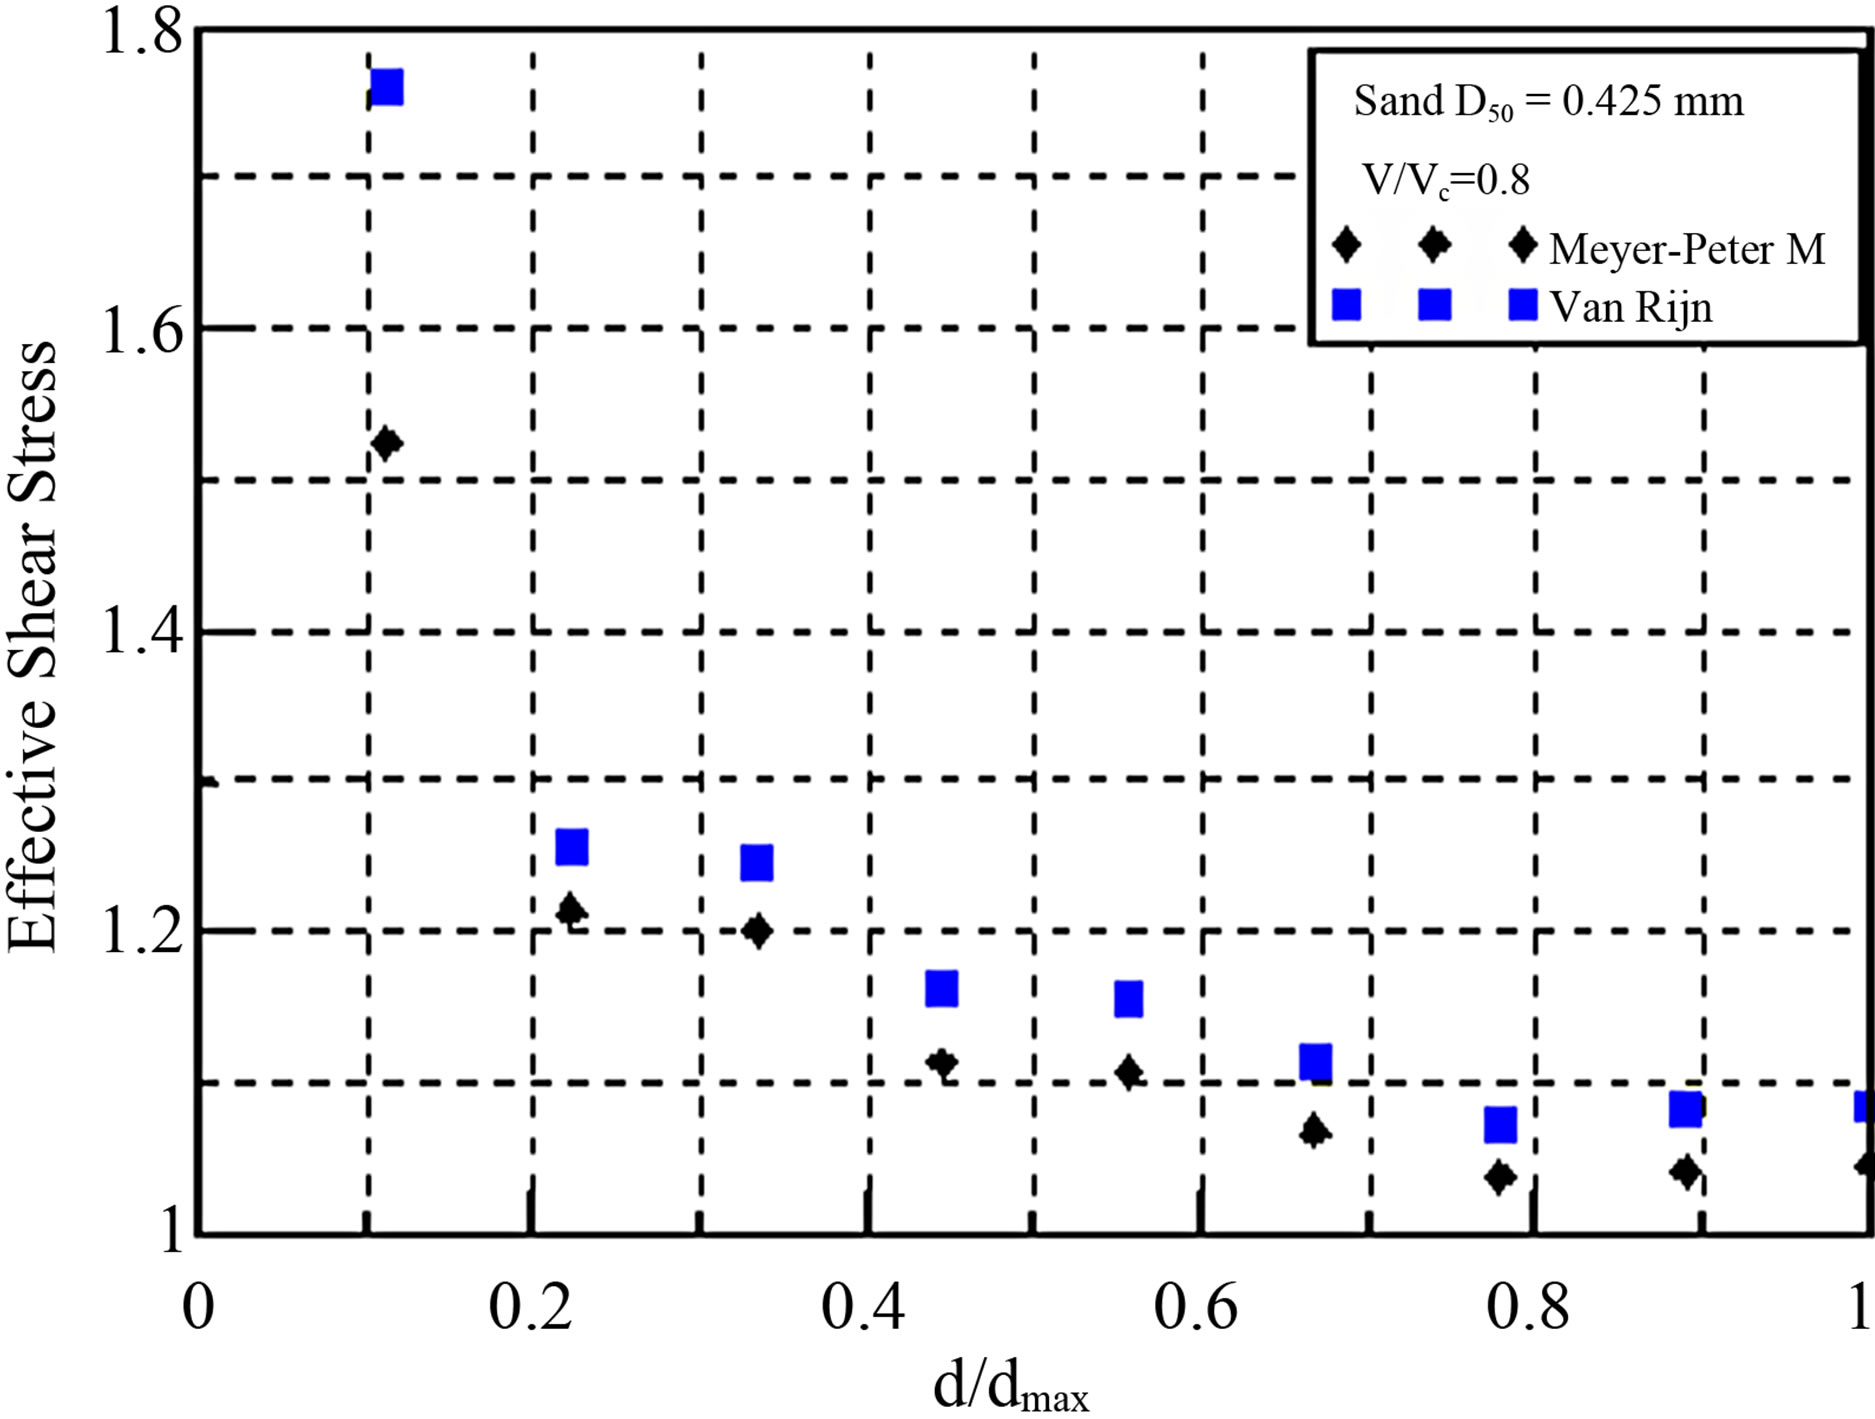
Figure 9. The changes in shear stress based on scour depth (sediment transportation equations, 0.45 mm).
along the scour depth (S, Smax) were examined. Experimental analysis was carried out for the reduction model of the shear stress along each particle and along the influence of time on scour depth, and a trend was found for each condition. The changes in shear stress show a difference between the assumption of the research and the suggested equations, which can be attributed to the diffi-
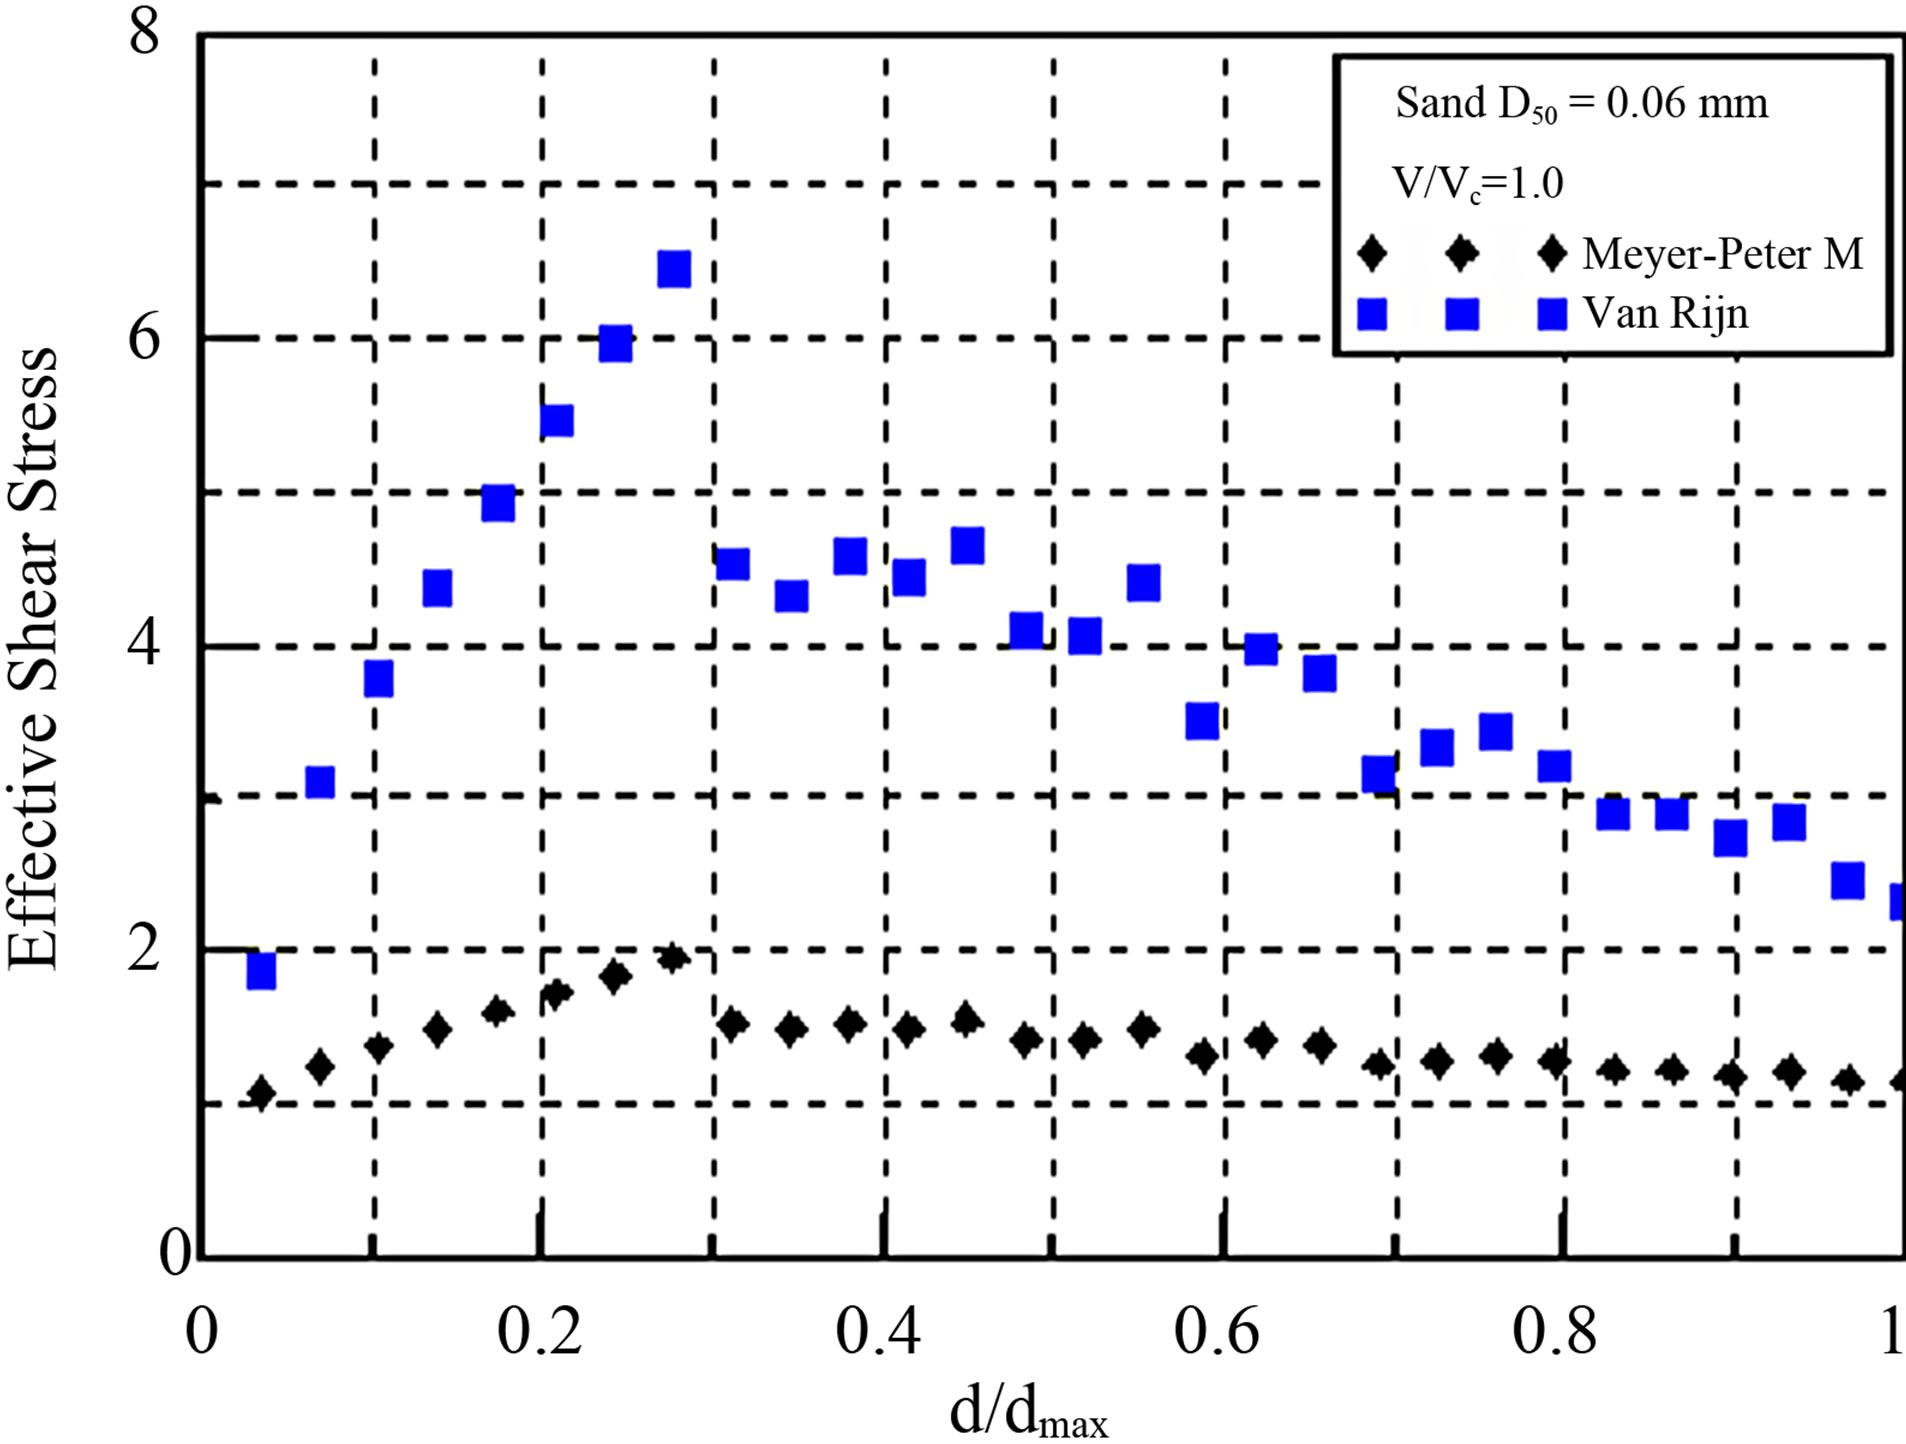
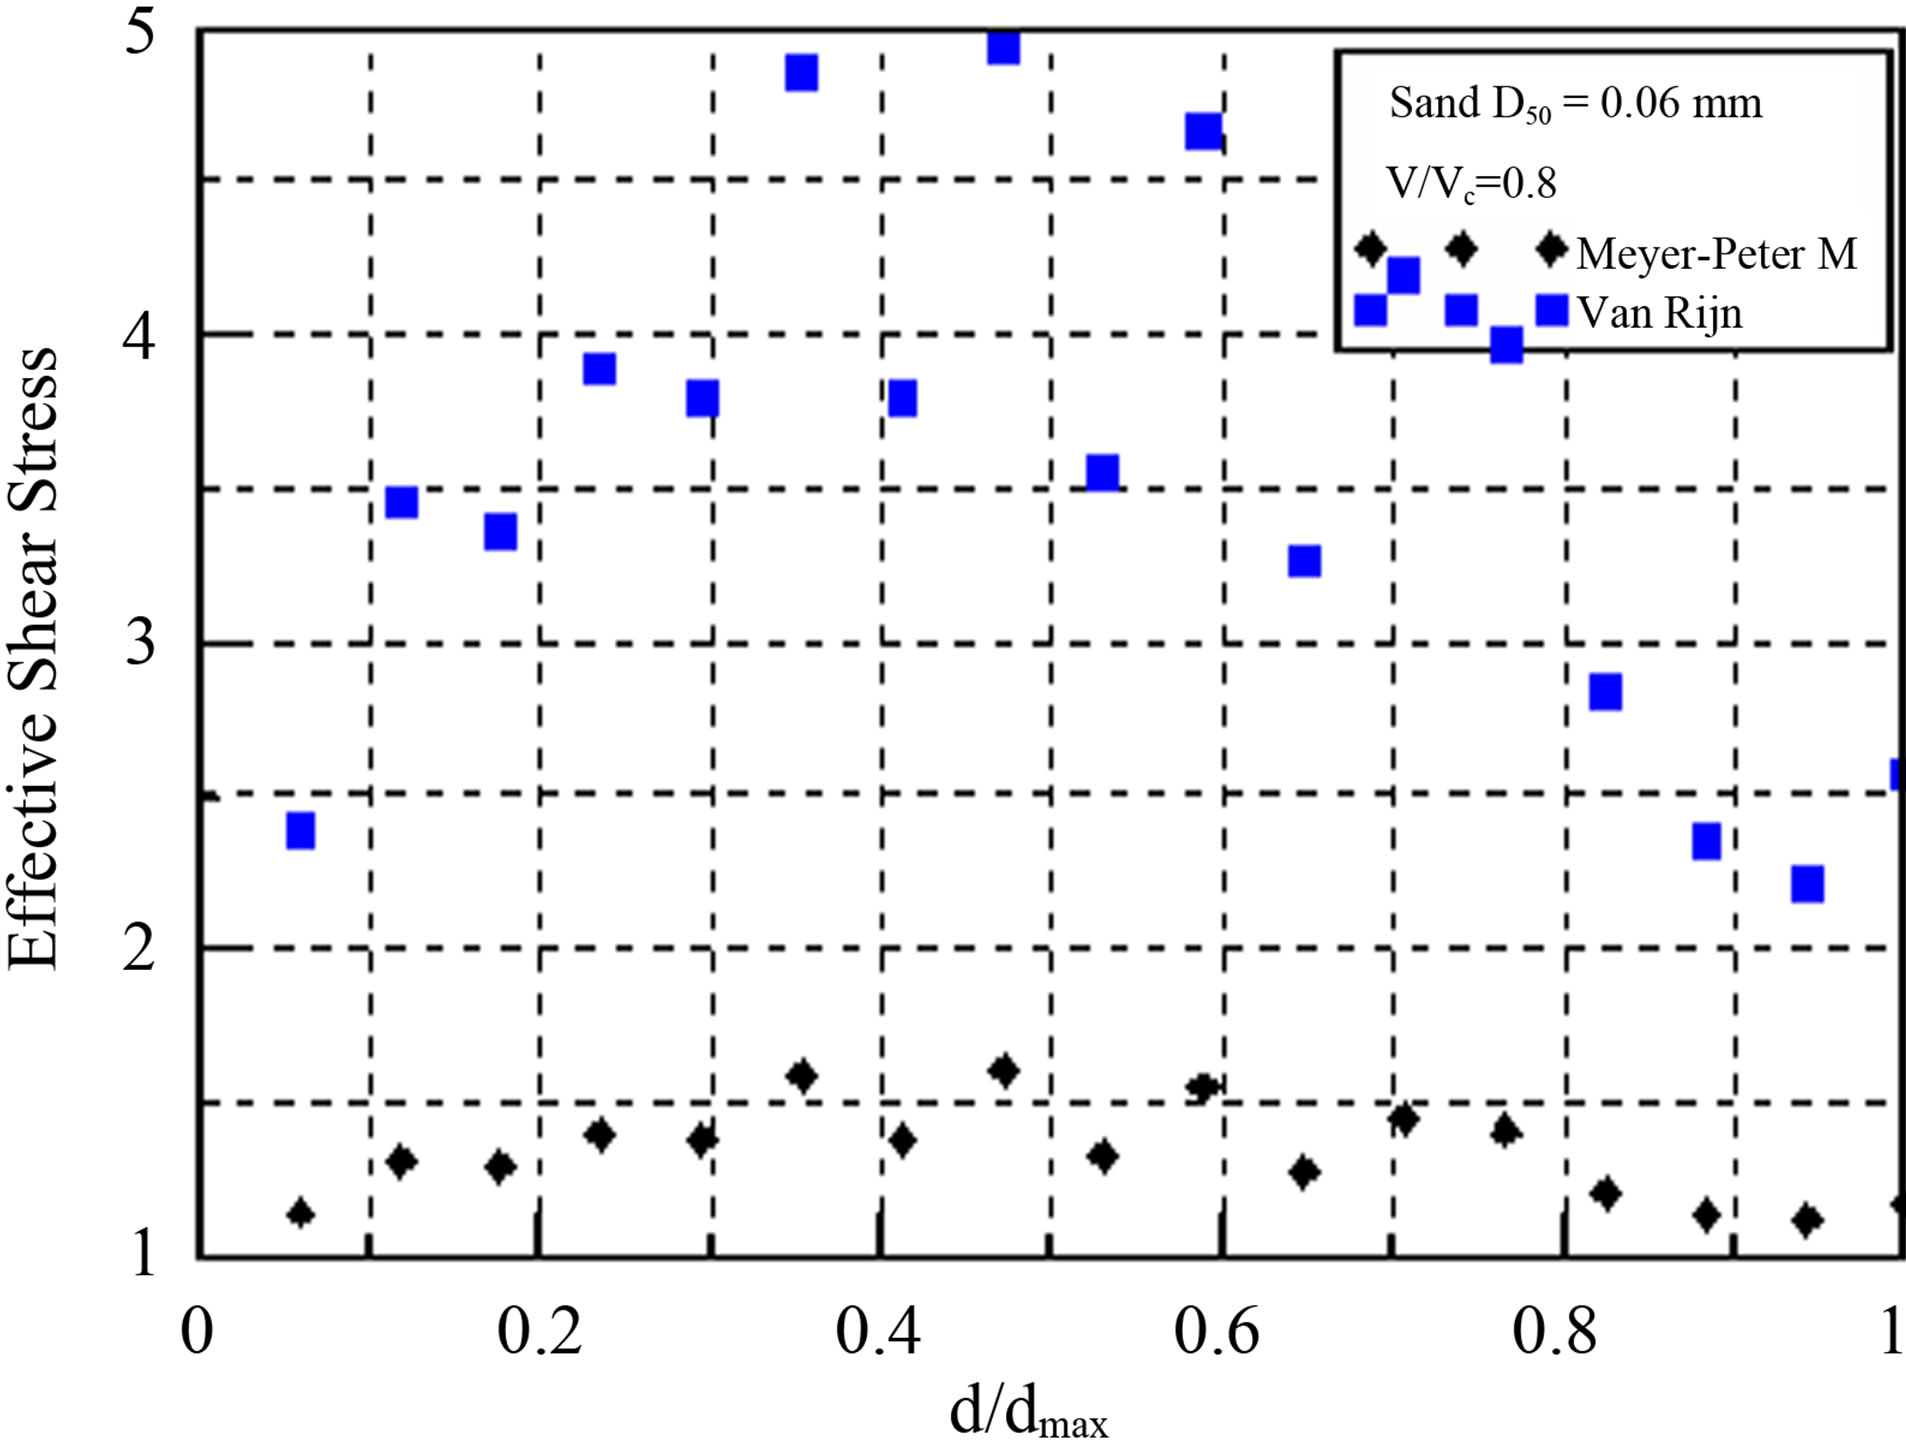
Figure 10. The changes in shear stress based on scour depth (sediment transportation equations, 0.06 mm).
culty of accurately measuring and analyzing the turbulent flow. An accurate measurement and analysis of the turbulent flow should be carried out in future studies on this subject. A similar study should be conducted, with a slightly modified methodology. In this study, the particles and flood phase should be analyzed via the scour reduction and the reduction rate.
5. Acknowledgements
This research is supported by Korea Institute of Construction Technology (Project name: Development of River Management Techniques for harmonizing nature with the human).
REFERENCES
- D. M. Sheppard, “Large Scale and Live Bed Local Pier Scour Experiments,” Report to the Federal Highway Administration, University of Florida, Gainesville, 2002.
- E. M. Lausen, “An Analysis of Relief Bridge Scour,” Journal of Hydraulics Division, Vol. 84, No. HY3, 1963, pp. 93-118.
- Y. Li, J.-L. Briaud, H.-C. Chen, P. Nurtjahyo and J. Wang, “Shear Stress Approach to Pier Scour Predictions,” 1st International Conference on Scour of Foundation, ICSF-1, Texas A&M University College Station, 17-20 November 2002, pp. 156-161.
- E. Meyer-Peter and R. Muller, “Formulas for Bed-Load Transport,” Report on 2nd Meeting for IAHR, Stockholm, 1948.
- L. C. Van Rirn, “Sediment Transport, Part II: Suspended Load Transport,” Journal of the Hydraulics Division, ASCE, Vol. 110, No. 11, 1984, pp. 1613-1641. doi:10.1061/(ASCE)0733-9429(1984)110:11(1613)