Journal of Modern Physics
Vol. 2 No. 12 (2011) , Article ID: 9031 , 7 pages DOI:10.4236/jmp.2011.212190
Blue Emission in Ce3+ and Eu2+ Activated Lithium Fluoro Borate Phosphors
1Kamla Nehru College, Sakkardara Square, Nagpur, India
2Department of Physics, Rashtrasant Tukadoji Maharaj, Nagpur University, Nagpur, India
3Department of Physics, Rani Gurgawati University, Jabalpur, India
4National Environmental Engineering Research Institute, Nagpur, India
E-mail: *sjdhoble@rediffmail.com
Received July 29, 2011; revised October 9, 2011; accepted October 22, 2011
Keywords: Lithium fluoroborate, phosphors, combustion synthesis, XRD and photoluminescence
ABSTRACT
Using a simple combustion process, rare earth doped novel compounds like fluorides LiBF4 and Li3BF6 can be prepared. Combustion synthesis furnishes a quick method for preparation of these phosphors. The prepared phosphors were characterized by the photoluminescence (PL) techniques. It is suggested that borofluoride based materials can be developed as low-cost phosphors. Formation of single phase compounds was confirmed by XRD. It is observed that prepared phosphors exhibited intense and characteristic Ce3+ and Eu2+ photoluminescence emission in blue visible region. This article summarizes fundamentals and possible applications of optically useful inorganic fluoride materials, with visible photoluminescence of Ce3+ and Eu2+ doped ions.
1. Introduction
Fluorides doped with rare earths are very attractive materials for optical applications because they combine high-quantum efficiency with favorable chemical and mechanical properties. Several fluorides have been shown to possess properties desired of solid-state laser hosts. Ce3+ ions are represented by a simple one-electron system. The electron configurations of the ground and excited states of Ce3+ are 4f1 and 5d1, respectively. The luminescent characteristics of Ce3+ ions are known to depend upon whether the charge compensatory vacancy is associated with Ce3+ ions in the cases of similar substitution [1]. In the last few years, a lot of studies have been devoted to oxide scintillators doped with Ce ions. The Ce ion is used for its potential to yield fast scintillation in the 300 - 500 nm wavelength range due to electric dipole allowed 5d → 4f transitions. Now a day Ce3+ ion also interested for application in high-energy physics, because of their fast and efficient luminescence in the UV and blue spectral regions. Ce3+ doped oxide materials such as LuAlO3: Ce [2] and Gd2SiO2: Ce [3] are also promising scintillators. Ce3+ activated LiCaAlF6 was also found to be an interesting scintillator [4,5]. Ce3+ doped LiCaAlF6 crystals are well known materials for UV solid-state lasers [6,7]. In fact, several Ce3+ activated fluorides are being studied as solid-state lasers [8]. Dorenbos has reviewed data on several Ce3+ activated fluorides [9]. S. Fujihara has reported inorganic metal fluoride and oxyfluoride materials for applications in optics and photonics [10].
The Eu doped solid-state materials usually show strong broadband luminescence with decay time is close to 600 - 1500 n sec. The luminescence is very strongly dependent on the host lattice and can occur from the ultraviolet to the red region of the electromagnetic spectrum. The Eu emission is intense enough to find important industrial applications, for example, electroluminescent lamp and display devices, LEDs [11], detectors for X-ray imaging [12,13] and scintillation detectors [14], Europium-doped fluoride [15]. J. B. Amaral et al. [16] made a very important prediction that Eu3+ and Nd3+ could be more effective activator as compared to Ce3+ and Yb3+ for stronger optical activity. There are few reports on photoluminescence studies [17,18] in LiCaAlF6:Yb2+ also. Recently Belsare et al. [19,20] prepared some Eu2+ doped fluoride phosphors by known reactive atmosphere processing (RAP) method. N.V. Shiran et al. [21] has also shown that Eu-doped LiCaAlF6 crystals exhibit luminescence associated with 4f65d → 4f7 transition in Eu2+ ions, substituting Ca2+.
Rare earth doped both the samples lithium tetra fluoro borate and lithium hexa fluoro borates are prepared by combustion route. PL emission spectra of LiBF4 and Li3BF6 phosphors under UV-excitation showed prominent Eu2+ emission peak due to 4f 65d1 → 8S7/2 4f7 transition in the blue region. The procedure was found suitable for producing Eu2+ doped phosphors. Very intense photoluminescence (PL) was found in these phosphors which are reported here. We were concentrating to prepare rare earth based lithium fluoro borate phosphor at low cast conventional combustion synthesis. Their X-ray diffraction pattern and PL properties were studied in this paper for various new applications.
2. Experimental
The Ce and Eu doped Lithium fluoroborate LiBF4 and Li3BF6 phosphors were prepared by combustion synthesis. For this stoichiometric compositions of the analytical reagent grade metal nitrates, oxidizers and urea (fuel) were calculated using the total oxidizing and reducing valencies of the components, which serve as a numerical coefficient so that the equivalence ratio is unity. Freshly prepared fluorides were thoroughly mixed with cerium nitrate in the required stoichiometry. Weighted quantities of each nitrates and urea are added to it and the mixture is crushed together for 1/2 an hour to form a thick paste. The resulting paste is transferred into a vertical furnace maintained at 400˚C. In the synthesis large heat is liberated during combustion. The process being highly exothermic continues and the liberated gases swell the mixture into large volume. The flame persists for about 30 seconds. The final product obtained is in the fluffy form, which is used for the further investigations. The synthesis reaction could be described as follows.
LiNO3 + H3BO3 + 4NH4F + NH4NO3 + NH2CONH2 → LiBF4 + 7NH3 + CO2 + 2NO2 + 3H2O + 1/2O2(1)
3LiNO3 + H3BO3 + 6NH4F + NH4NO3 + NH2CONH2 → Li3BF6 + 9NH3 + CO2 + 4NO2 + 4H2O + 2O2 (2)
Formation of the compound was confirmed by taking the X-ray diffraction (XRD) pattern. X-ray diffraction pattern was recorded on Philips PAnalytical XPERT-PRO diffractometer. The photoluminescence (PL) emission spectra of the samples were recorded by using a RF-5301PC SHIMADZU Spectrofluorophotometer (RF- 5301PC). The same amount of sample was used in each case. Emission and excitation spectra were recorded using a spectral slit width of 1.5 nm.
3. Results and Discussion
The chemical name of the prepared samples is lithium tetra fluoro borate (LiBF4) and trilithium hexa fluoro borate (Li3BF6). Both the lithium fuoro borates are obtained in white powder form. It is observed that both the samples are water soluble, corrosive and hygroscopic. In literature there is no XRD pattern of both LiBF4 and Li3BF6 phosphor for comparison. X-ray diffraction patterns were recorded on Philips P Analytical X’Pert Pro diffractometer. Figure 1 shows the X-ray diffraction pattern of LiBF4 phosphor.
3.1. Ce3+ Emission in LiBF4
The PL emission spectra of Ce3+ ions in LiBF4: Ce phosphors observed with different concentrations are shown in figure 2. In LiBF4: Ce phosphor, two principal centers in excitation spectra are observed one of them is at around 382 nm and another at around 241 nm in Ce3+ ion. The dominant center was found to be produced by the direct substitution of the dopant ion Ce3+ for Li+ without local charge compensation. Upon UV excitation this center gives an intense emission with maxima at 415
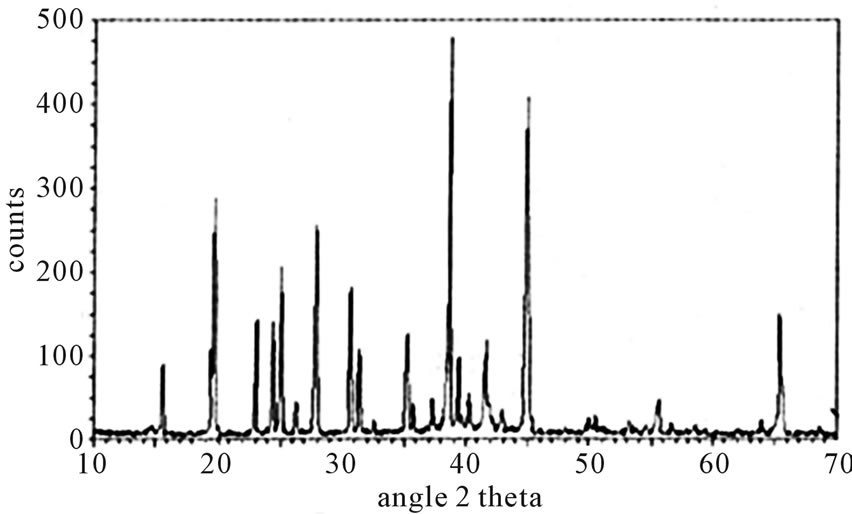
Figure 1. X-ray diffraction pattern of LiBF4.
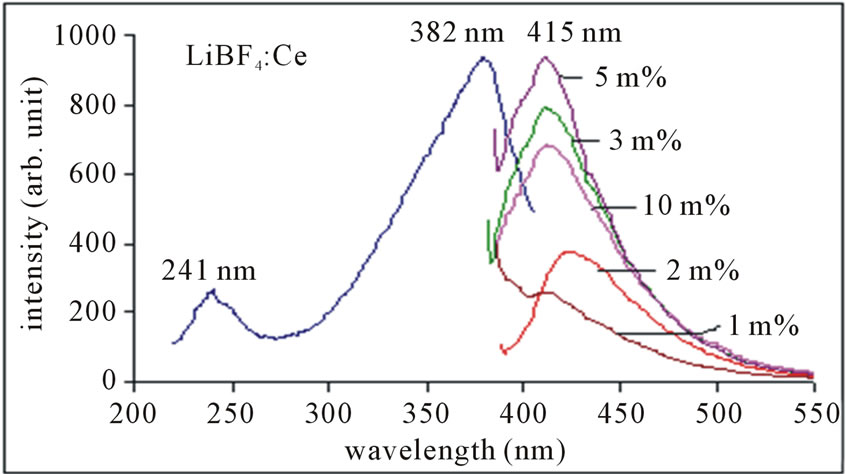
Figure 2. PL emission spectra of LiBF4: Ce phosphor, monitored at 382 nm excitation.
nm, which are assigned to the 5d → 4f transition of Ce3+ ion. This feature could be explained as follows: the excitation energy matches the energy separation between the ground state and the lowest state of the 5d level of the ion. This situation populates the lowest 5d level to the maximum, which favors maximum emission intensity. PL emission of Ce3+ ion is observed around 415 nm, monitored at 382 nm excitation. The 300 - 400 nm is Hg-free excitation (Hg excitation is 85% 254 nm wavelength of light and 15% other wavelengths), which is characteristic of solid state lighting phosphors. Therefore, the entire PL characteristic indicates that Ce3+ doped LiBF4 phosphor may be a good candidate for solid state lighting devices as well as for blue LED purpose.
Figure 3 shows the concentration dependence of the PL intensity. Maximum PL intensity is observed for Ce concentration at 5 mol%. Concentration quenching is observed for higher values. This indicates a change of the surrounding of the Ce3+ ions at higher concentration in the LiBF4 lattice. The emission peak wavelength and its relative intensity are shown for different concentrations of Ce3+ ion in table 1. According to the data and PL spectra, it is seen that the Ce3+ content affects not only the peak height but also the peak profile. The observed variations of PL emission intensities may be cross relaxation between Ce3+ ions.
3.2. Ce 3+ Emission in Li3BF6
Figure 4 shows the X-ray diffraction pattern of Li3BF6 phosphor. In Li3BF6: Ce phosphor, two principal centers in emission spectra are observed in Ce3+ ion. Upon UV excitation this center gives an intense emission with maxima at 377 nm and 422 nm. In excitation there also two principal centers are observed in Ce3+ ion one at 241 nm and another at 356 nm wavelength of light. This could be assigned to the 4f → 5d transition of Ce3+ ions in solids is parity allowed electric dipole transition (f - d) and has large oscillator strength and produces efficient broadband luminescence. Where 4f is the lowest excited charge transfer state of the Ce3+ ion and 5d is the molecular orbital of the surrounding ligand.
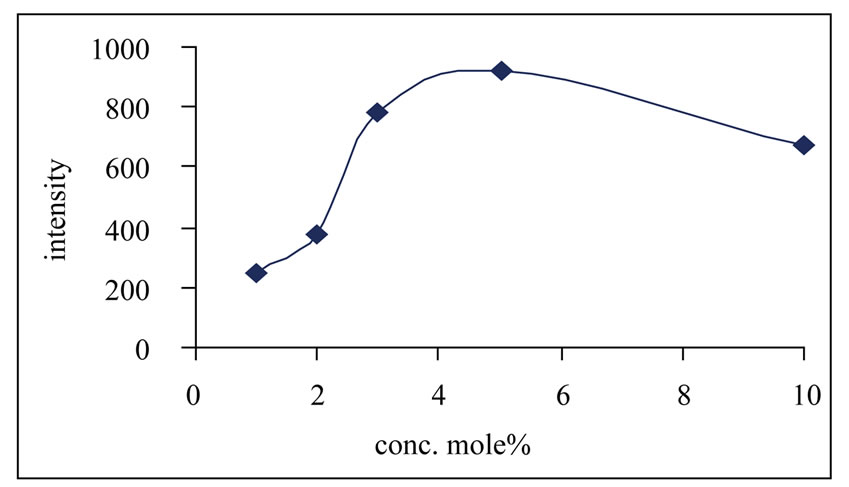
Figure 3. Variation of intensity with conc. of Ce in LiBF4: Ce.
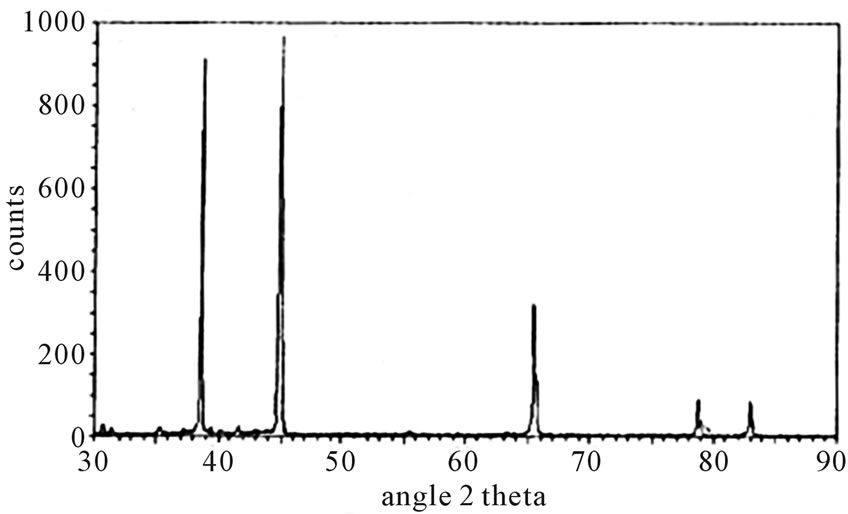
Figure 4. Xray diffraction pattern of Li3BF6.
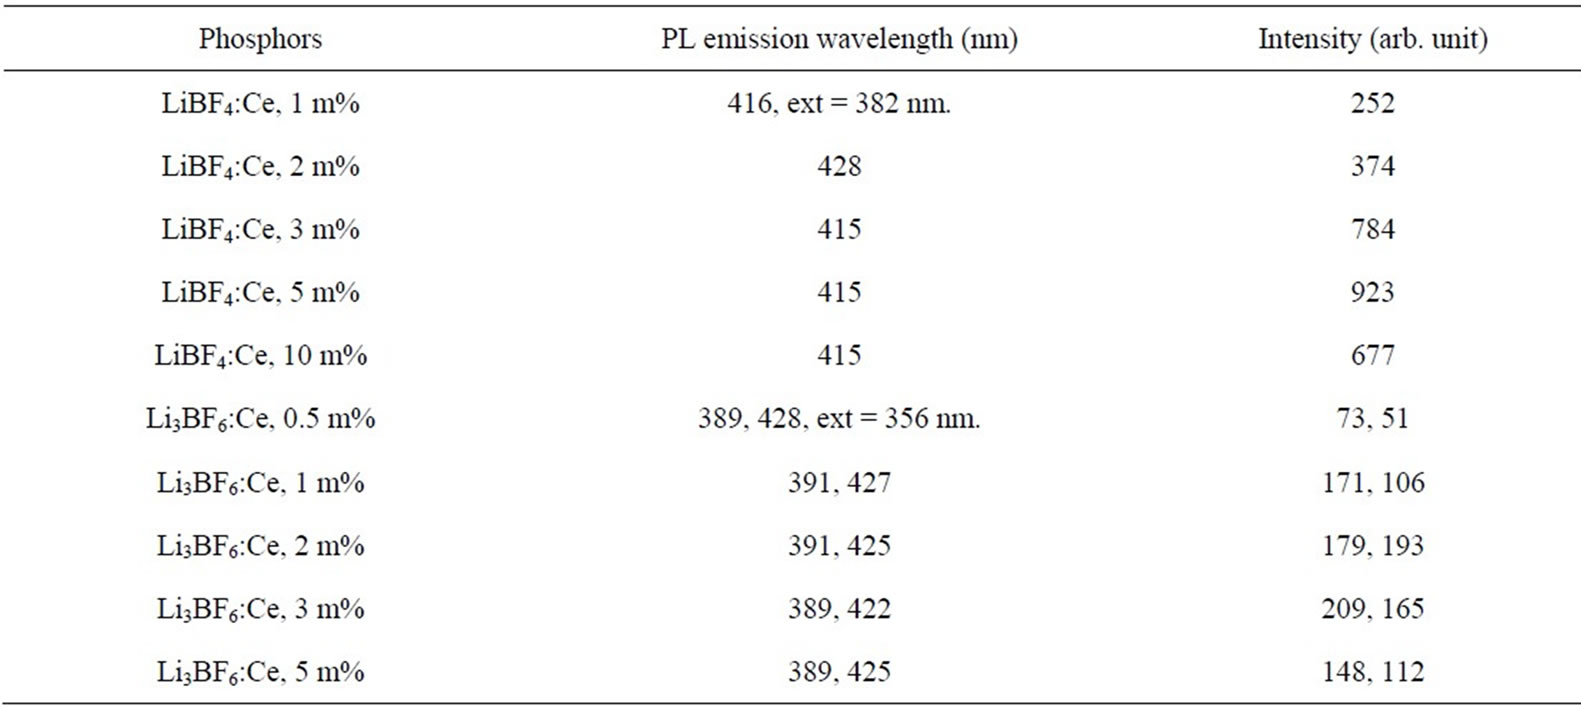
Table 1. Intensity compression values for all prepared Borofluoride phosphors (i.e. LiBF4: Ce and Li3BF6: Ce).
The Ce3+ ion may enter into the host lattice to substitute a Li+ ion in the case of Li3BF6 locate on the surfaces of the crystals due to the porosity of the spinal structure. Therefore, most of the Ce3+ ions are located at the surface of the Li atom with a few of them entering into the lattice. The low-symmetry location of Ce3+ results in the predominant emission of the 5d → 4f transition, as shown in Figures 5 and 6.
Different doping of activator ions can influence photoluminescence characteristics of a phosphor; usually a low doping gives weak luminescence but excess doping perhaps causes quenching of luminescence. Figure 5 shows the PL emission spectra monitored at 356 nm excitation of light and an excitation spectrum is monitored at 425 nm emissions. Here the peaks are observed at 425 nm along with the shoulder at 389 nm, which are assigned to the 5d → 4f transition of Ce3+ ion.
Figure 6 shows the PL emission spectra monitored at 241 nm excitation of light. Here the emission peaks are observed at 377 nm along with the shoulder at 422 nm, which are assigned to the 5d → 4f transition of Ce3+ ion. The 377 nm peak is more intense than the 422 nm peaks with increasing concentrations of Ce3+ ion in Li3BF6 phosphor. The PL intensity tends to quenched at more than 3 mol%.
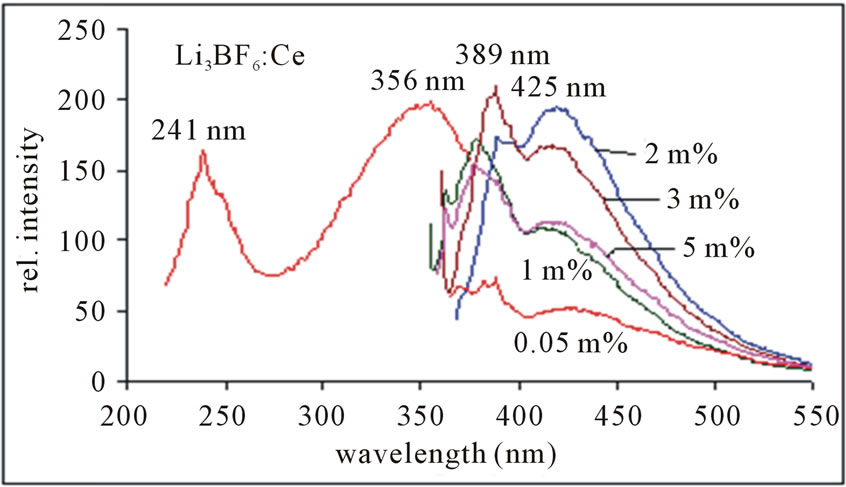
Figure 5. PL emission spectra of Li3BF6:Ce, monitored at 356 nm excitation.
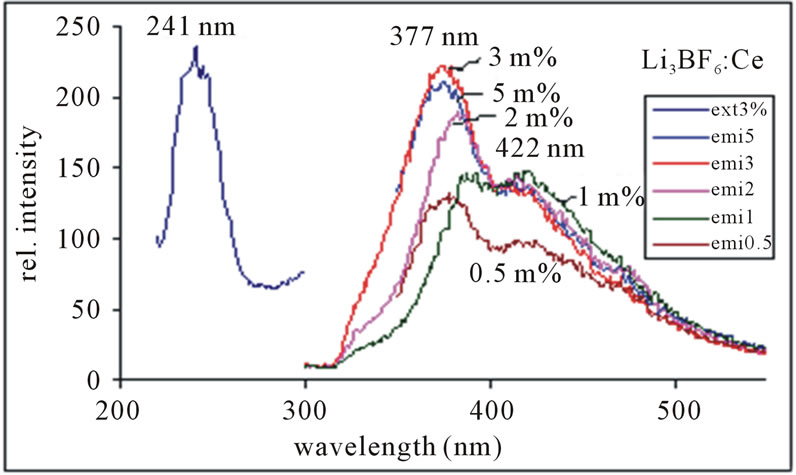
Figure 6. PL emission spectra of Li3BF6:Ce, monitored at 241 nm excitation.
Figure 5 shows that the 389 nm peak is more intense than the 425 nm peak, but the spectra are broader as compared to the spectra, in which the emission was monitored at 241 nm excitation shown in Figure 6. It is observed that the concentration of Ce3+ ion increases the corresponding intensity of peaks and it is highest for 2 mol% instead of 3 mol% as in the next case. The PL intensity tends to quenched for higher than 2 mol%. The emission peak wavelength and its relative intensity are shown for different contents of Ce3+ ion in table 1. According to the data and PL spectra, it is seen that the Ce3+ content affects not only the peak height but also the peak profile. Obviously, with increase in Ce3+ content, the emission intensity increases relatively. The observed variations of PL emission intensities may be cross relaxation between Ce3+ ions in the case of heavy concentration of Ce3+. Since the high luminescence intensity of the samples and large UV range of excitation, it can be used in solid state lighting devices.
3.3. Eu2+ Emission in LiBF4
Figure 7 shows PL results for LiBF4: Eu2+ phosphor. An intense emission peaking at 420 nm is obtained in the sample prepared. Emission arises from transition from levels of 4f65d1 configuration to the ground state (8S7/2) of 4f7 configurations. It is worth mentioning that without use of any reducing agent, europium is incorporated in divalent state. In excitation spectra of LiBF4: Eu phosphor the broad band is observed at around 382 nm with a prominent shoulder at around 240 nm. It is thus seen that the sample contains Eu in divalent form. With increasing concentration of Eu2+ ions intensity of the peak increases and relative intensity of 420 nm peaks also increases. The variation of PL emission intensity of LiBF4: Eu with concentration is shown in Figure 8. Maximum PL intensity is observed for Eu concentration at 0.5 mol%. Concentration quenching is observed for higher values.
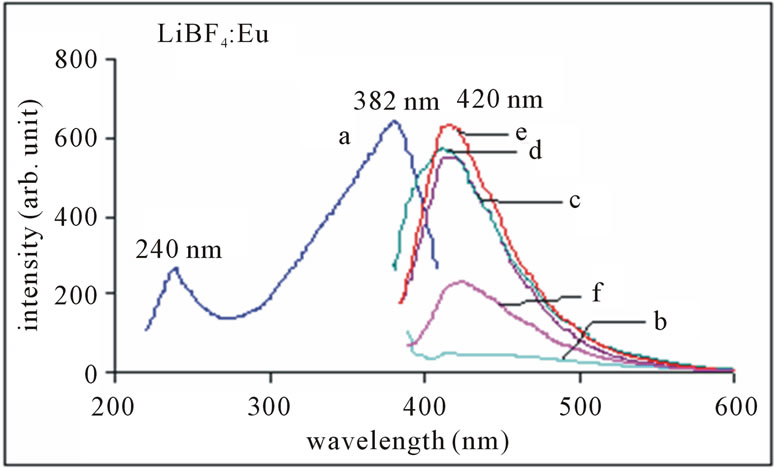
Figure 7. PL emission spectrum of LiBF4:Eu with conc. of Eu as (b) 0.05 m%; (c) 0.1 m%; d) 0.2 m%; (e) 0.5 m%; (f) 1 m%, monitored at 382 nm excitation.

Figure 8. Effect of conc. of Eu on PL intensity of LiBF4: Eu.
The 300 - 400 nm is Hg-free excitation (Hg excitation is 85% 254 nm wavelength of light and 15% other wavelengths), which is characteristic of solid state lighting phosphors. Therefore, the entire PL characteristic indicates that Eu2+ doped LiBF4 phosphor may be a good candidate for solid state lighting devices for blue LED purpose. It may be used as luminescent materials for tunable laser as well as blue lamp phosphor applications.
3.4. Eu2+ Emission in Li3BF6
Figure 9 shows the PL spectrum of Eu2+ in Li3BF6: Eu for excitation at 350 nm. The broad band around 390 nm - 440 nm in the emission is arising from a transition of the lowest level of the 4f65d1 configuration to the 8S7/2 level of the 4f7 configuration. It is worth mentioning that without use of any reducing agent, europium is incorporated in divalent state. In excitation spectra of Li3BF6: Eu, the broad band is observed at around 350 nm with a prominent shoulder at around 241 nm. These are characteristic of transitions from the 8S7/2 level of the 4f7 configuration to the levels of the 4f65d1 configuration. In this case, the Eu2+ ion may enter into the host lattice to substitute a Li+ ion in the case of Li3BF6 locate on the surfaces of the crystals due to the porosity of the spinal structure. As the ionic radius of Eu2+ is much larger and similar to that of the Li+ ion, the second possibility is more feasible.
It is remarkable that mere thermal treatment (combustion) in air is sufficient to reduce Eu3+ to Eu2+. There is no need of heating in reducing atmosphere. Maximum PL intensity is observed for Eu concentration at 0.5 mol%. In this host it is also found that, for more than 0.5 mol% concentration (i.e. for 1 mol%) PL intensity is weak. Hence this material is suitable for 0.5 mol% concentration. It is seen that the PL intensity of the Li3BF6: Eu is quite high; being comparable to those of the lamp phosphors. The emission peak wavelength and its relative intensity are shown for different contents of Eu2+ ion in table 2. According to the data and PL spectra, it is seen that the Eu2+ content affects not only the peak height but also the peak profile. Obviously, with increase in Eu2+ content, the emission intensity increases relatively. Figure 10 shows the PL emission spectra monitored at 241 nm excitation of light. Here the emission peaks are observed at 377 nm along with the shoulder at 422 nm.
Increase in the PL intensity could be due to elimination of impurities like OH−, O2−, and preservation of stoichiometry. It is also likely that during the powders are etched and the activators penetrate the surface. They eventually diffuse into bulk. More experiments will be needed to verify the exact mechanism of the efficient PL. The violet emission is useful in phototherapy lamps for treating hyperbilirubinemia. It may be used as luminescent materials for tunable laser and lamp phosphor applications.
4. Conclusions
All the phosphors Ce and Eu doped LiBF4 and Li3BF6 reported here were prepared by combustion synthesis. From the PL results it is concluded that, all the above phosphors show the strong PL intensity in blue region of
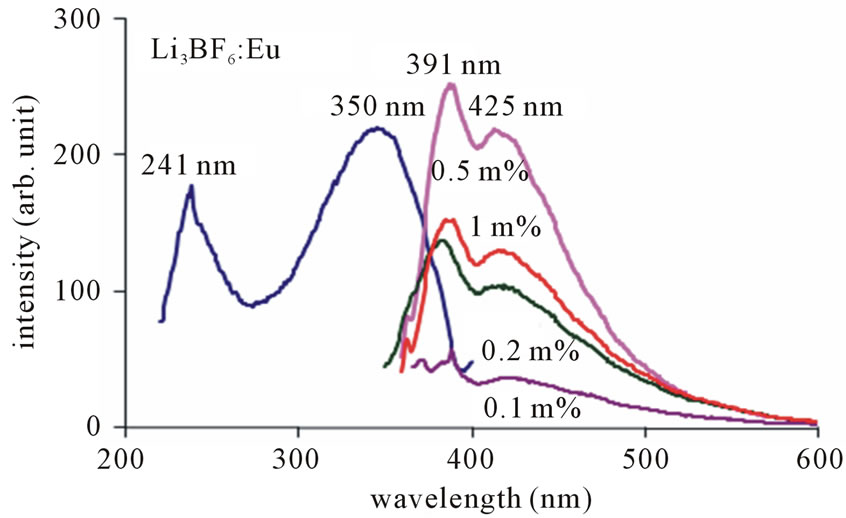
Figure 9. PL emission spectra of Li3BF6: Eu, monitored at 350 nm excitation.

Figure 10. PL emission spectra of Li3BF6: Eu, monitored at 241 nm excitation.

Table 2. Intensity compression values for all prepared Borofluoride phosphors (i.e. LiBF4: Eu and Li3BF6: Eu).
the visible spectrum. The PL emission spectra of Ce3+ and Eu2+ ions in LiBF4 and Li3BF6 phosphors with different concentrations have been studied. The PL intensity of the LiBF4: Eu is quite high; being comparable to those of the lamp phosphors. Since the high luminescence intensity of the samples, it can be used in medical applications. PL in LiBF4: Eu and Li3BF6: Eu can be excited by UV wavelengths and the violet emission observed may be useful in phototherapy lamps for treating hyperbilirubinemia. Also these phosphors can be useful as a phosphor for thermoluminescence dosimetry of ionizing radiations and environmental monitoring.
5. Acknowledgements
One of the authors SPP is thankful to UGC, New Delhi for financial assistance.
REFERENCES
- C. Lu, S. V Godbole and V. Natarajan, “Luminescence Characteristics of Strontium Borate Phosphate Phosphors,” Materials Chemistry and Physics, Vol. 94, No. 1, 2005, pp. 73-77. doi:10.1016/j.matchemphys.2005.04.011
- W. Moses, S. Derenzo, A. Fyodorov, M. Korzhik and A Gektin, “LuAlO3: Ce, a High Density, High Speed Scintillator for Gamma Detection,” IEEE Transactions on Nuclear Science, Vol. 42, No. 4, 1995, pp. 275-279. doi:10.1109/23.467837
- Y. H. Chen, B. Liu, C. S. Shi, M. Kirm, M. True, S. Vielhauer and G. Zimmere, “Luminescent Properties of Gd2SiO5 Powder Doped with Eu3+ under VUV-UV Excitation,” Journal of Physics: Condensed Matter, Vol. 17 No. 7, 1994, p. 1217.
- G. A. Aghalte, S. K. Omanwar and S. V. Moharil, “Luminescence Characteristics of LiCaAlF6: Eu Phosphor,” Physica Status Solidi (a), Vol. 204, No. 5, 2007, pp. 1561- 1566. doi:10.1002/pssa.200622397
- A. Gektin, N. Shiran, S. Neicheva, V. Gavrilyuk, A. Bensalah, T. Fukuda and K. Shimamura, “LiCaAlF6: Ce Crystal: A New Scintillator,” Nuclear Instruments and Methods in Physics Research Section A: Accelerators, Spectrometers, Detectors and Associated Equipment, Vol. 486, No. 1-2, 2002, pp. 274-277. doi:10.1016/S0168-9002(02)00717-9
- D. J. Spence, H. Liu and D. W. Coutts, “Low Threshold Ce: LiCaF Lasers,” Optics Communications, Vol. 262, No. 2, 2006, pp. 238-240. doi:10.1016/j.optcom.2005.12.070
- D. Alderighi, G. Toci, M. Vannini, D. Parisi, S. Bigotta and M. Tonelli, “High Efficiency UV Solid State Lasers Based on Ce: LiCaAlF6 Crystals,” Applied Physics BLasers and Optics, Vol. 83, No. 1, 2006, pp. 51-54.
- D. W. Coutts and A. J. S. McGonigle, “Cerium Doped Fluoride Lasers,” IEEE Journal of Quantum Electronics, Vol. 40, No. 10, 2004, pp. 1430-1440. doi:10.1109/JQE.2004.834775
- P. Dorenbos, “5d-Level Energies of Ce3+ and the Crystalline Environment,” Journal of Luminescence, Vol. 91, No. 3-4, 2000, pp. 155-176. doi:10.1016/S0022-2313(00)00229-5
- S. Fujihara and K. J. Tokumo, “Chemical Processing for Inorganic Fluoride and Oxyfluoride Materials Having Optical Functions,” Fluorine Chemistry, Vol. 130, No. 12, 2009, pp. 1106-1110. doi:10.1016/j.jfluchem.2009.07.019
- F. C. Palilla and B. E. O’Reilly “Alkaline Earth Halophosphate Phosphors Activated by Divalent Europium,” Journal of the Electrochemical Society, Vol. 115, No. 10, 1968, pp. 1076-1081. doi:10.1149/1.2410883
- M. Nakamoto, T. Nishimura and H. Kohmoto, “ThreeNarrow-Band de Luxe Fluorescent Lamp with Newly Developed Phosphors,” Prospectus No. 15, Narva/EDUe 1133, Toshiba Corporation, Tokyo, 1982.
- G. Fasol, “Room Temperature Blue Gallium Nitride Laser Diode,” Science, Vol. 272, No. 5269, 1996, pp. 1751- 1752. doi:10.1126/science.272.5269.1751
- M. K. Crawford and L. H. Brixner, “Photostimulable Phosphors for X-Ray Imaging; Applications and Mechanism,” Journal of Luminescence, Vols. 48-49, 1991, pp. 37-42.
- H. Heinz Von Saggern, “X-Ray Imaging with Photostimulable Phosphors,” Crystal Lattice Defects and Amorphous Materials, Vol. 18, 1989, pp. 399.
- B. J. Amaral, E. G. M. Valerio, A. M. C. dos Santos and R. A. Jackson “Defect Stimulation And Crystal Field Studies of Ln3+: LiCaAlF6 and LiSrAlF6,” Nuclear Instruments and Methods in Physics Research B, Vol. 218, 2004, pp. 232-235. doi:10.1016/j.nimb.2003.12.027
- A. Bensalah, K. Shimamuraa, T. Fujita, H. Sato, M. Nikl and T. Fukuda, “Growth and Characterization of BaLiF3 Single Crystal as a New Optical Material in the VUV Region,” Journal of Alloys and Compounds, Vol. 348, No. 1-2, 2003, pp. 258-262.
- A. Bensalah, M. Nikl, E. Mihokova, N. Solovieva, A. Vedda, H. Sato, T. Fukuda and G. Boulon, “Excited State Dynamics of Yb2+ in LiCaAlF6,” Radiation Measurements, Vol. 38, No. 4-6, 2004, pp. 545-548. doi:10.1016/j.radmeas.2003.12.003
- P. D. Belsare, C. P. Joshi and S. V. Mohril, “Luminescence of Eu2+ in Some Fluorides Prepared by Reactive Atmosphere Processing,” Journal of Alloys and Compounds, Vol. 450, No. 1-2, 2008, pp. 468-472. doi:10.1016/j.jallcom.2006.11.008
- P. D. Belsare, C. P. Joshi and S. V. Mohril, “Preparation and Characterization of LiAEAlF6: Eu (AE = Mg, Ca, Sr or Ba) Phosphors,” Journal of Luminescence, Vol. 129, No. 2, 2009, pp. 135-139. doi:10.1016/j.jlumin.2008.08.013
- N. V. Shiran, A. V. Gektin, S. V. Neicheva, V. A. Kornienkoa, K. Shimamurab and N. Ishinoseb “Optical and Scintillation Properties of LiCaAlF6: Eu Crystal,” Journal of Luminescence, Vol. 102, 2003, pp. 815-818. doi:10.1016/S0022-2313(02)00647-6