Journal of Environmental Protection
Vol.07 No.11(2016), Article ID:71701,23 pages
10.4236/jep.2016.711136
Relationship between the Environment and Economic Growth in China via Exports: A Perspective of Ecological Impact (2000-2014)
Guillermo Velázquez Valadez1, Jiaqi Hu2
1La Salle University; SEPI-ESE IPN, Mexico City, Mexico
2Economics Program SEPI- ESE-IPN, PHD in Economics of ESE-IPN, Mexico City, Mexico

Copyright © 2016 by authors and Scientific Research Publishing Inc.
This work is licensed under the Creative Commons Attribution International License (CC BY 4.0).
http://creativecommons.org/licenses/by/4.0/


Received: September 26, 2016; Accepted: October 28, 2016; Published: October 31, 2016
ABSTRACT
China’s swift and substantial economic growth over the past 20 years has made the country one of the top industrial powers in the world, second only the United States. From the perspective of ecology and the impact on the environment produced by economic and industrial growth, the exports that have driven rapid growth have also resulted in an alarming level of environmental pollution in major Chinese cities. Research has shown that the Chinese government’s investment in bringing down pollution levels has been insufficient and ineffective. The monetary amount allocated for pollution reduction has barely reached 0.15% of the country’s GDP and has failed to meaningfully reverse the effects of industrialization, including increased exports and economic growth rates affecting China’s ecology. The present study investigated China’s ecological situation in terms of the industrial production that has generated its level of exports, with special focus on problems related to water, air, and solid waste. An econometric analysis was conducted to determine the relationship between the main variables. The exports and GDP (dependent variable), air pollution, water pollution, and industrial solid waste (independent variables) were provided by the Institute of Statistics and the Environment Institute of China for this study. The data was managed in Econometric Eviews 7.0 software and yielded an adjusted R2 of 96.09% (high correlation) with an interesting correlation between the exports and three independent variables; after subsequent variable analysis, we found that investments in water and industrial solid waste were not significant (i.e., that said investments have failed to solve the pollution problem). It is necessary to review the Chinese investment policy with special attention to these variables to appropriately respond to China’s ecological crisis.
Keywords:
Economic Growth, Environment, Exports; Pollution, Gross Domestic Product

1. Introduction
China is one of thirteen countries worldwide contending with a serious water scarcity problem. Over the course of the next twenty years, the country has plans to ensure economic and social development to mitigate this problem. It is worth noting here that per capita water resources in China are 2300 cubic meters, representing a quarter of the world’s average. The water problem has caused a series of deficiencies in the production of the two main sectors of the economy: Industry, at a loss of $46 billion (USD) and agriculture at $30 billion in 2014. Moreover, soil erosion and the continued reduction of arable land are becoming increasingly serious. Soil erosion has reached 2949 square kilometers according to the Bulletin of the Environment of China (2014), a figure equivalent to 30% of the national surface. In effect, annual land disappearance by erosion is equivalent to ten times the surface area of Japan. It is difficult to account for the economic damage caused by such drastic environmental changes. In 2014, soil cultivation in China was 135,163,000 hectares―an average of arable land less than half the world’s average and the loss of cultivated land was 354,000 hectares in the same year.
Air pollution costs China $30 billion dollars (BBC) annually and has resulted in the premature death of more than 500,000 people in last ten years. Respiratory diseases and cardiovascular and lung cancers due to pollution are increasing 26.9% annually (CENEWS) since 2000; in other words, every minute there are six individuals diagnosed with a disease caused by pollution: 8550 per day, and 3.12 million per year. The level of suspended particle micro-density is 300 - 370 units per cubic meter, which places China squarely and constantly under yellow alert on the Air Quality Index (AQI) of China during last fifteen years. The country currently has 62,000 industrial coal boilers, consumes 700 million tons of coal in 2014, and has no adequate pollutant control measures in place. It is projected that by 2020, China will need 4.2 billion tons of coal, certainly a dire situation in terms of air quality.
Among the most hazardous industrial wastes produced in China is the ash emitted during the burning of coal. For every four tons of coal consumed, one ton of ash is released into the atmosphere. It is important to note that in both 2002, when coal burning increased significantly, and again in 2009, ash production reached 375 million tons per year―this is equivalent to more than twice the total production of trash by Chinese metropolitan areas that year (Greenpeace).
2. Objectives
Our primary objective was to perform an econometric analysis between economic growth and the factors that impact environmental pollution in China by way of its exports, particularly industrial exports, during the period 2000-2014.
3. Hypothesis
During the last fourteen years, the Chinese economy (measured here in terms of Gross Domestic Product [GDP]) has grown at an average annual rate of 7% to 8%. The consequences of such economic growth, as often discussed in terms of the consumption of raw materials, also include a significant increase in pollution. New industrial policy measures and environmental sustainability legislation are urgently necessary in order to sustain the Chinese growth model over the next 15 years.
4. Theories of Economic Growth versus Sustainable Growth
Economic growth and sustainable growth are topics of discussion that have caused debates and clashes among intellectual circles that support different and contending theories as they relate to ecology and the environment. In this sense, it is essential to identify the main theories that support the industrialization process of China.
4.1. Economic Growth
Nicholas Kaldor (1963) established the typical factors that drive economic growth and generate accelerated production. These factors include:
1. Continuous growth in the total volume of production and labor productivity at a rate of a consistent trend.
2. Increased amount of capital per worker.
3. Constant rate of capital gains.
4. Foreign capital-output that is stable for long periods of time.
5. High correlation between the share of profits in income and the share of investment in production.
6. Appreciable differences in the rate of growth of labor productivity and total production indifferent societies.
Kuznets [1] [2] and Romer (1989) [3] have defined economic growth as “a long- term increase in the supply capacity of more diverse economic goods to its population, the growing ability based on the advancement of technology and institutional and ideological adjustments that demand”. They have also pointed out additional factors that directly impact economic growth and are used by governments to make their economies more productive. These include low gradual dependence on natural resources, increasing importance of government sector in the economy, and an increase in the importance of formal education reflected in the economy.
Birdsall and Wheeler [4] , Lee and Ronal-Holst [5] , and Jones and Rodolfo [6] all have indicated that in theory, foreign trade has an effect on economic expansion proportionate to expansion in production(especially industrial) as a result of external demands for products and services; that is, these economic activities have a direct impact on pollution. Foreign trade also results in decomposition, which must be understood as the decline of the great centers of world production due to migration to other countries with comparative advantages over the country of origin; this serves to increase the foreign trade between countries, but also spreads and increases pollution, known as the “Pollution Haven Hypothesis”. Kuznet (1973) further contends that the effect of decomposition is actually the migration of contamination. Developed countries produce products with less pollution whereas emerging countries produce them with high energy consumption [7] . Rock confirms this statement: “If there is no strict environmental regulation under the neoliberal model and free trade, then the industries increase their rate of migration from developed countries to developing countries” [8] [9] .
4.2. Sustainable Growth
Ramsey and Koopmans [10] and Cass [11] together developed a dynamic optimization model which has been used by many economists to study the optimal use of natural resources and analysis of economic trajectory. Pollution is also introduced as a variable within the Ramsey-Cass-Koopmans model to show the relationship between long-term economic growth and environmental pollution.
Keeler, Spence, and Zeckhuaster (2001) indicate that the integration of the pollution variable into models of economic growth should be considered if any of the three following scenarios is true: First, if contamination has a direct impact on consumption, production or possibly both, in which case contamination enters directly into the social utility function with a negative marginal utility; second, if contamination is perceived as an act of economic agents or as a flow of production processes; and third, if contamination is the result of different economic models, then the result and assumptions are different.
Beckerman [12] argues that concurrent with economic growth, demand for environmental quality will inevitably lead to an increase in more stringent environmental protection measures. The strong correlation between income and the extent to which environmental protection measures are taken shows that frankly, in the long run, the best way to improve the environment is by becoming wealthy. In this context, one can say that the development of the economy increases income and environmental quality parameters, which leads to a structural change in production, distribution, and consumption. This period of economic growth is based on management, innovation, technology, and productivity?variables that allow more income for businesses and families which to be spent on the purchase of equipment for environmental protection, thereby enforcing regulations that result in ecological balance. Such situations can have the following three effects:
1. Composition effect: Countries with developed economies base their economy on the service sector. Under these conditions, the demand for inputs is serviced by developing countries. The agricultural sector cedes its space to the industrial sector, and developed countries thus pollute emerging countries by way of transference of industrial processes.
2. Displacement effect: Based on the principles of neoliberal capitalism, globalization interacts with increased international flow of goods and, based on the increased international division of labor, developed countries are released from polluting industrial processes and move them instead to developing countries.
3. Technological progress: This effect is perceived as positive because, in so far as the economy grows; countries are able to invest in research around development and possibilities for improving technology which can then be applied to overcome the effects of pollution on the environment.
4.3. Theoreticians of Foreign Trade and Pollution (China)
Zoran Xie and Zong Gang [13] [14] [15] discussed the issue of socio-economic surpluses or internalization of environmental costs that impact the process of global pollution; they indicate that China should promote the growth of foreign trade balanced with sustainable economic growth based on technological progress, management of new raw materials friendly to the environment, and increased regulations to control and promote openness to environmental businesses and reduce negative external effects.
Yu Yonghong [16] [17] noted that international trade disputes about the environment are a result of different interests and regulatory standards between developed and developing countries. Yonghong proposed efficient legal solutions for sustainable development accordingly.
Huang and Li [18] emphasized that high levels of economic growth required of developing countries cause conflicts between international trades. The solution, according to these scholars, is to increase investment in these countries in the development of human capital as well as enhance their active participation in international trade negotiations and generate unique standards to be observed by all in regards to environmental regulations.
Ye and Xu [19] [20] [21] [22] found that most of the industries operating in the field of exports are industries that generate high levels of contamination; they argued that industries must avoid competition between exports and the limits set by the environment in the exploitation of natural resources and their subsequent industrialization.
Dang Yuting [23] found that foreign trade reduces pollution (especially in the manufacturing sector) mainly due to the constant technological progress in developed countries.
Yu Lixin [24] contended that more than 80% of existing pollution is caused by the constant emission of gaseous and solid industrial waste from industrialized countries, which is why these countries should not impose or punish pollution in underdeveloped countries. The carbon emission quota seriously affects China’s foreign trade and, as such, China must develop its own technology to achieve sustainable growth.
5. Exports and Pollution in China
During the past twenty years, China has demonstrated swift and substantial economic growth: Its GDP has increased by an annual average of 14.98%, representing economic dynamism that now makes China the third largest economy in the world, topped only by the European Union (EU) and the United States (US). In the same period, China’s exports have increased by an annual average of 16.43%.These figures are important because they indicate that China’s expansion in foreign markets is higher than its own rate of growth. It is estimated that if this trend continues, in 2030, China will rank as the world’s largest economy (Chinese Embassy in Jamaica, 2015).
The role of exports in GDP growth has been increasing steadily, as well: In 1995, exports represented 20.8% of the GDP as compared to 22.9% in 2014. The percentage of exports to GDP peaked between 2004 and 2008 at greater than 30%. Figures expressing this data are presented below (Table 1).
The relationship between GDP-China Export variables (measured in millions of dollars) from 2000 behave correlatively, as represented in the following graph (Figure 1).
It is important to note that 49.2%, i.e., almost half of China’s GDP can be attributed to foreign trade (Export-Import). Another 26.4% can be attributed to exports; within this category, exports of industrial finished products constitute more than 96% and result in an annual growth rate of 18% on average. In other words, Chinese exports are concentrated in industrial products; accordingly, the growth of industrial clusters and corridors are very high (Figure 2).

Table 1. Exports Percentage of GDP of China from 1995 to 2014.
Based on data from the National Institute of Statistics of China.
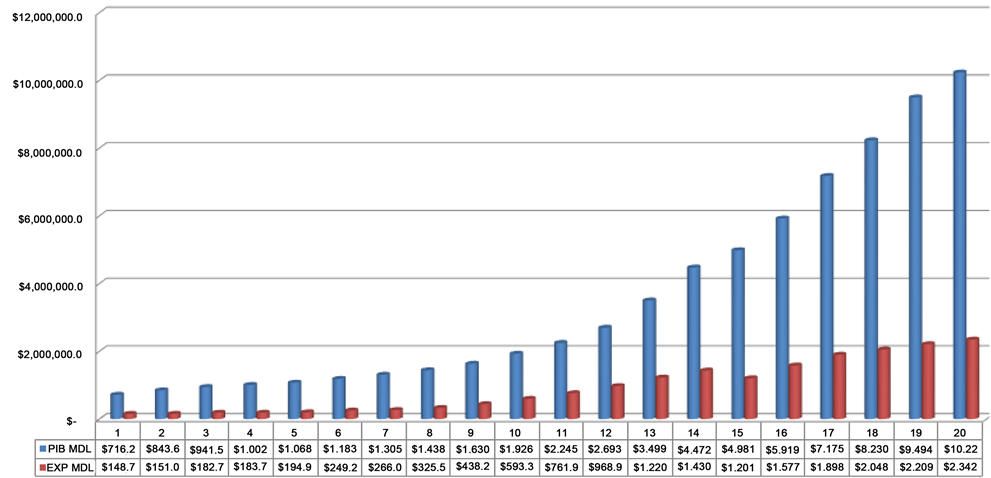
Figure 1. GDP growth and export in China from 1995 to 2014. Source: Prepared with data from the National Institute of Statistics of China.

Figure 2. China Total exports and. Exports of Industrial Products 1995-2014. Based on data from the National Institute of Statistics of China.
As shown in the chart above, exports of finished industrial products clearly maintained a high share of total exports during the period we examined. This steady growth trend has implications for the country as a whole in terms of consumption of energy, exploitation of raw materials, and pressure for environmental regulations.
The industrial composition is divided into four areas each with a certain annual average participation.
Chemicals constitute 6%
Light industry, 19%
Machinery and equipment, 45%
Other products, 30%
Based on the above composition, exports of machinery and equipment present a high dynamism: Their share of industrial composition has increased from 24% in 1995 to 45% in 2014, meaning that China has extensively developed technology and its own brand of exports to the world. As a result, industry shows a slight decrease of 5% in their share of the GDP in the same period; the share of chemicals to GDP has remained the same.
The curve relating to finished industrial products shown in Figure 3 indicates that since 2000, China has significantly increased its industrial exports at a rate disturbed only by the global crisis of 2008-2009. The curve, however, also shows a recovery of the industrial sector―and an even greater growth rate―starting in 2010. The curve for the
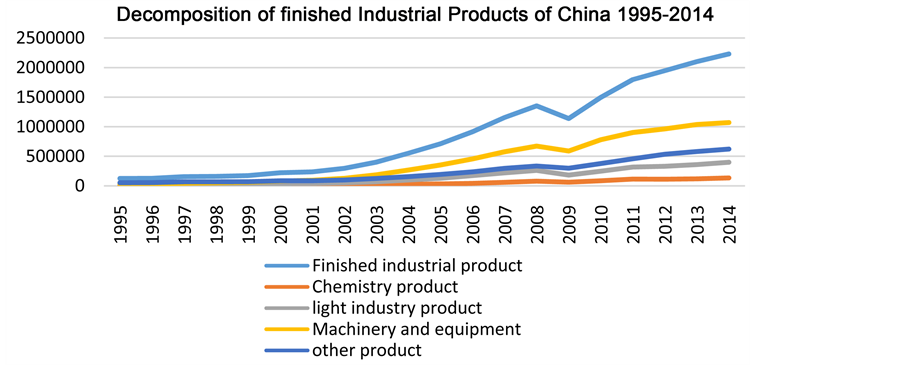
Figure 3. Based on data from the National Institute of Statistics of China.
machinery and equipment category shows a similar trend, i.e., it is another of the fastest-growing categories that comprise China’s industrial composition [25] .
The data presented above indicates positive economic consequences for China, but it is certainly necessary to conduct a deeper analysis into the other side of the accelerated industrialization: The ecological effects and the industrial sector’s own level of responsibility for (and impact on) environmental pollution.
6. Air Pollution
A visible effect of accelerated industrialization for the Chinese population is the high air pollution experienced mostly in larger cities, especially Beijing. This situation has led the government to enact strong measures and restrictions in effort to control the environmental contingency. In this context, and due to the alarming increase in pollution levels, the National Institute of Statistics of China in 2011 was forced to expand the classification of air pollution and industrial emissions SO2 and NO2 to air pollution. These emissions are currently responsible for 88% and 67% of total Chinese air pollution, respectively (National Statistical Bulletin of China Environment, 2014).
As shown in Table 2, the emission of 115.59 million tons of air pollutants in 2011 decreased to 113.06 million tons in 2014, which, in relative terms, represents a decrease of only 2.1% of the total emissions. Table 1 also shows that by 2014, weightier pollutants were present in the environment: Sulfur dioxide represented 17.46% of total emissions while nitrogen oxide represented 21.25% of the emissions.
Importantly, micro particles suspended in the air have increased significantly from 2011 to 2014: Micro Part Susp + Fumes increased from 12.78 million tons in 2011 to 17.40 million tons in 2014, which is an increase of 36.15% (4.62 million tons) in just four years. In the case of Indus + Smoke Indus Micro, the increase was from 11.00 million tons in 2011 to 14.56 million tons in 2014, i.e., an increase of 32.36% (3.56 million tons) in the same period. This increase in emitted particles is mainly due to the high demand for energy by industries and is generated by burning coal [26] .
Table 2. Air pollution (million tons).
Source: Statistical Yearbook of China National Institute of Environment of China. Note: there are no reliable data for the years 1995-2010.
7. Water Pollution
The current situation regarding the degree of water pollution in China is alarming not only in regards to human consumption, which is paramount, but also for irrigation in food production and water consumption by different types of livestock which provide meat to be consumed in the country. In this sense, water pollution is a doubly serious problem?primarily because government costs must rise in order to combat the different diseases that occur from water consumption, and secondly because it raises the import of pollution-free food, which affects mainly lower income classes (Figure 4).
Although biological oxiation by refractories is non-biodegradable (by conventional methods,) residual waste present in aqueous streams are mainly industrial. These contaminants also appear in lesser domestic concentrations. Present in this type of pollution are polynuclear aromatic hydrocarbons (PAH), phenolic compounds, halogenated hydrocarbons (AOX), BTEX, pesticides, and dyes, all of which can be grouped under the “refractory COD” category which includes the organic load (Table 3).
Water pollution in China between 2002 and 2014 increased at an average rate of 5.24% annually, representing an increase of 27.670 million tons of pollutants discharged into rivers, lakes, and lagoons. In terms of percentage, the increase of contaminants was approximately 162.95%. It is worth emphasizing that the COD parameter in wastewater emissions increased from 13.55 million tons in 2002 to 22.94 million tons in 2014, i.e., an increase of 167.93% over the course of the period we examined in this study.
8. Industrial Waste
Industrial waste is a category that originated during the Industrial Revolution in the late nineteenth century to represent waste produced by humans through industrial activity. Industrial wastes are classified as hazardous or inert. Inert wastes, such as debris and sand, are typically recoverable although the majority of such waste ultimately ends up in open dumps; its main effect is a visual pollution. Hazardous waste, on the other hand, can affect human, plant, and animal health, i.e., the environment at large. Hazardous waste is toxic, corrosive, can be plastic (or many other non-biodegradable materials) and is not easy to reuse insofar as they typically require lengthy periods to degrade when discarded in nature or landfills.
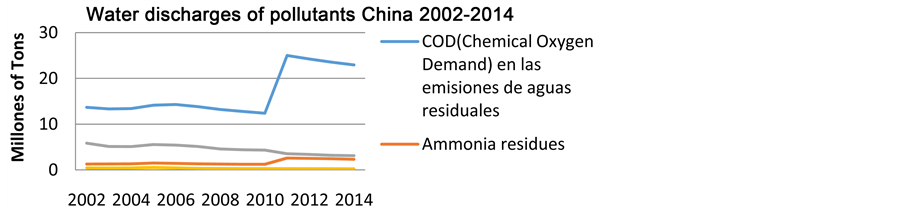
Figure 4. Source: Statistical Yearbook of China National Institute of Statistics of China. Note: there are no reliable data for the years 1995-2001.
Table 3. Water pollution (million tons).
Based on data from the National Institute of Statistics of China. COD: Chemical Oxygen Demand.
The high rates of economic growth (again, driven mainly by exports,) that industrial China experienced between 1995 and 2014 can help explain the considerable increase in pollution in the country. In 1995, a total of 644.74 million tons of industrial waste was recorded in 2014, which number grew to 3526.21 million tons, reflecting an increase of 546.91% (Table 4).
Another important problem that China must address is that until 2014, 100% of industrial waste had a utilization of 57.95% and a storage of 12.77%; together these figures amount to 70.72%, meaning that 29.28% of industrial waste is not accounted for and, therefore, neither its final destination nor the degree of pollution it produced (Figure 5).
The calculation of total emissions (in millions of tons) in 2014 can be visually represented as follows (Table 5).

Figure 5. Pollution composition of China 2014. Source: Statistical Yearbook of China National Institute of Statistics of China.
Table 4. China industrial waste in 1995-2014 (million tons).
Based on data from the National Institute of Environment of China.
Table 5. Pollution quantity composition of China 2014.
Self-elaboration based by National Institute of Environment of China.
It is clear that water pollution is the main source of contamination in China insofar as it directly affects the soil, thereby negatively impacting agricultural and livestock products. Moreover, the increasing scarcity of national reserves of drinking water threatens the viability of Chinese cities. Between 1995 and 2014, the amount and level of water contamination (measured in percentages) has remained virtually the same, regardless of efforts made by way of legislation, new technologies, or environmental organizations.
9. Econometric Model
In order to test the relationship between exports and figures of water and air contamination and solid industrial waste, we proceeded to perform an econometric analysis. Our goal was to determine whether the government has adequately responded to the level of severity of the pollution situation in China.
9.1. Methodology
After gathering materials and articulating a scheme of scientific research elements, we conducted documentary research into the growth of China in terms of both the GDP and Chinese exports. We then built a theoretical framework accordingly. Our research can be defined as descriptive-correlational, as it consists of examining statistical and econometric analyses in order to find a correlation between exports and pollution in China.
We also gathered data regarding water pollution, air pollution, and industrial solid waste and evaluated these effects as they relate to China’s high rate of industrial growth. We found that although economic growth in this country has been positive in the last twenty years, pollution levels have risen alarmingly. In response to this situation, we propose a correlational model through which we can establish a number of variables: “Exports”, “Air pollution”, “Water pollution”, and “Industrial solid waste”. These variables were incorporated into the following Model:
The model was formulated as follows:

With the data collected and the model designed, we proceeded to perform our econometric analysis in EViews software, which is especially useful for analysis of cross- sectional models, estimation and prediction models, time series, and panel data. The data collected by the software were analyzed and interpreted in order to arrive at conclusions that were supported by mathematical coefficients. This provided the necessary confidence that a scientific study demands, and allowed for the criteria of acceptance or rejection of the hypothesis.
In order to secure homogeneous data (Table 6), all variables taken from the current Statistical Yearbook of the National Institute of Statistics of China were expressed in millions of dollars [27] [28] .
After running the above data through EViews software based on our correlational model, we found that under the LS (Least Squares) method and ARMA, when the independent Exports variable and dependent variables Investments in Air, Water, and Waste were individually tested, all variables passed. The individual results are presented below.
Table 6. China: Total investment in environment vs. Total investment in industrial pollution (Millions of dollars).
Based on data from the National Institute of Statistics of China.
By examining the relationship between pollutants, exports, and investments, we generated a model that supports the continued good performance of exports with the implementation of sound public policy. We also observed a strong correlation between exports and investments to combat pollution in water (98.06%), while the ratio of exports to waste is very low (44.55%). In effect, then, there is an imbalance in government investment in fighting pollution.

The joint test model passed all tests except in regards to industrial waste. There is a high correlation between dependent and independent variables, and the model has autocorrelation; air and water variables follow a normal distribution with a standard acceptable error.
According to values provided by Gujarati (2003), the value of acceptance must be equal to or greater than 2.093and less than 0.05 in probability. Our results thus indicate that Air and Water variables are satisfactory, but there is insufficient correlation between Industrial wastes and Exports due to the high t-value (0.98). In other words, government investments to combat pollution via industrial waste in China are not adequately addressing the problem; exports produce more industrial waste than investment combats it.
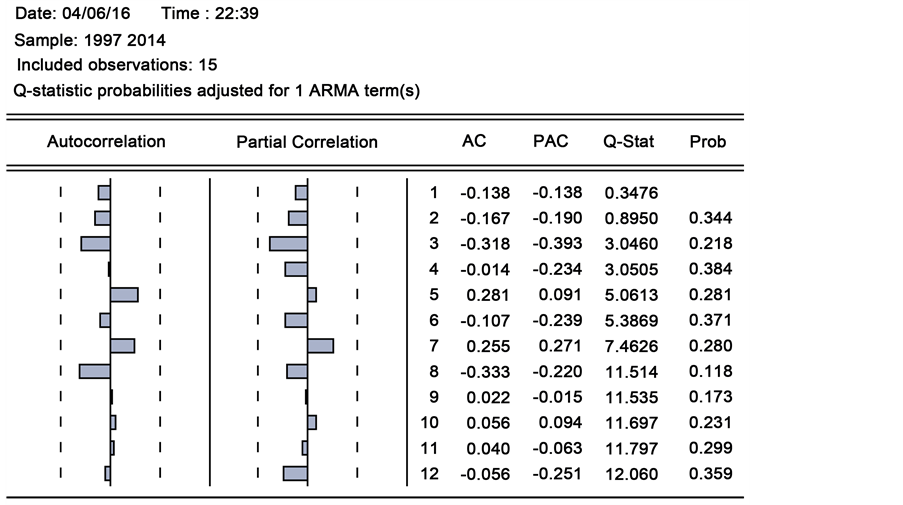
After testing the statistical probability Q, we confirmed that all variables are within the acceptance range for both autocorrelation and partial correlation. With this mathematical support, the model states that there are no symptoms of autocorrelation?the model is unbiased, efficient, and consistently linear with normal distribution.
The graph displays the following information: N = 20, 95% confidence level, 0.25 (calculated) < 7.43 (value tables), and Jarque-Bera Probability 2.72 > 0.05. Altogether, the data indicates that the model has a normal distribution (Figure 6).
Investment in industrial waste has little correlation with total exports in both the joint test and the individual events. There are than 50% of solid wastes yet unaccounted for and, although investment to combat this pollution occurs, it is yet in effective in terms of actually addressing industrial sector issues. Arguably, foreign direct investment and the industrial model of China’s exports have significantly increased industrial solid waste among those sectors that generate the highest level of these wastes, including electronic products, machinery and equipment, and chemical products.
In summary, we have now confirmed that Chinese investments in combating pollution have regular data except in the industrial wastes category―this indicates that Chi- nese exports are the main source of these pollutants. Statistics, however, indicate that

Figure 6. Distribution Jarque-Bera test. Source: self-elaboration.
the main problem is water contamination, so we performed another test via LS method using the following model:
9.2. Individual Test
The model was formulated as follows:

The following are the results of the individual tests:
There is a weak relationship between the variables GDP, Water (47.42%), and Waste (34.68%).These percentages relate to the problems identified in the descriptive statistics (Water) and the first econometric model correlation (Industrial waste). Within the econometric analysis of GDP with Air-Water-Waste variables, China’s economic policy on environmental pollution and investments appears to decline; it then is only actually able to solve Air pollution problems.
The regression equation was established as follows:

It is important to note that although overall the model yields an R2adjusted to 96.09% (high correlation), investments in water and waste are not significant. That is to say, government efforts to address water and waste pollution are not adequate in terms of China’s pollution problem. It is necessary to revise China’s investment policy to effectively combat pollution. (It is also worth noting that the model contains two lags imposed to avoid autocorrelation.)
The joint test model reflects the following indicators:
Again according to Gujarati (2003), the value of acceptance must be equal to or greater than 2.093 and less than 0.05 in probability. The results obtained from our model tell us that the only variable that meets these assumptions is Air, with a value of 3.01 and a probability of 0.01.
Water showed a 0.6 t-value and probability of 0.55, thus placing this variable outside of the acceptable range; Waste resulted in 0.11 t-value and a probability of 0.90, likewise outside of the acceptance range. We can thus assume categorically that the Chinese government’s efforts have focused mainly on combating air pollution while failing to appropriately address either water pollution or the reduction, processing, or manage- ment of industrial waste.
In effort to confirm or reject the above statement, we checked it against the funds that the Chinese government allocated to pollution prevention in the year 2014:
Air = $12,843.03 million
Water = $1853.10 million
Waste = $242.90 million
In other words, the percentages of total investments to combat pollution in the year 2014 were 8.34% to air, 1.20% to waste, and 0.16% to water. The total for the three items is 9.70%. In this sense, the model affirms that the Chinese government has paid relatively little attention to combating pollution. When translating these percentages to GDP, we found that only 0.15% is earmarked for this indicator as-intended to mitigate pollution: Investments to combat pollution, then, represented most none of the Chinese GDP.

As expressed in the diagram above, if Exports is taken as a dependent variable with respect to investment in Water and Waste, there is a high dispersion of values: Statistically, the standard deviation is high while the Air variable has smaller dispersion. The trend of air emission makes a 45 degree line, suggesting that there is intensive investment to control air pollution―the line representing the Water variable is less steep, conversely, suggesting that investments in combating water pollution grew at a slower rate than those dedicated to combating air pollution across the timeline.
10. Conclusions
Our conclusions regarding the correlation among GDP, exports, and investment in reducing water, air, and industrial waste pollution can be summarized as follows.
China’s exports represent 23% of GDP with a growth rate of 26.39% annually from 1995 to 2014. There has clearly been dynamism in this sector that has enhanced economic growth across the country, and it is important to note that this 96% corresponds to finished industrial products―a sector that has a growth rate of 18% annual average.
Descriptive statistics clearly tell us that of the millions of tons of pollutants produced in China, most (95.16%) are dumped into water (Figure 5). This situation creates a striking contrast against the government’s investment in reducing water pollution, 1.85 billion USD, while the total investment made in 2014 in the three areas analyzed (air, water, and waste) was 61,438 million USD. China indeed continues to grow at 6% annual GDP, however, water pollution and industrial waste are still not properly cared for; the R2 model established in this study (water 47.42%; waste 36.68%) for this purpose,  , indicates that the correlation indices are weak and insignificant; in short, government investment in these areas to combat pollution is demonstrably insufficient.
During the investigation, it was determined that the origin of more than 50% of solid wastes comprising the total known industrial waste was unaccounted for. This situation is serious: Not knowing precisely the final destination of these pollutants and the magnitude of its effects on the population represents a very urgent problem. Further, it is clear that investment in combating industrial pollution has little correlation to the country’s total exports; clearly, investment in this area is irrelevant in terms of the actual conditions in this sector. In the year 2014, a total of 3526.1 thousand tons of waste (of which 2043.3 thousand tons was utilized and 450.3 thousand tons was stored) contained 1032.6 thousand tons (29.28% of the total) of unknown whereabouts. Alarmingly, if this waste is continue to accumulate in the same rate, more than five billion tons of scattered industrial waste will accumulate over China in the next five years. Worse, without knowledge of the whereabouts of this waste and thereby any meaningful assessment of its effects on the population, this issue may pose a sizable threat to human health―particularly as a high percentage of air pollution is estimated to originate from these pollutants.
We also examined the overall investment in the environment according to a few key factors. Construction of environmental infrastructure received the highest concentration of investment at 57%, urban gas network construction received 6%, central heating construction 8%, drainage network installation 12.5%, and the construction of green areas received 24% (Table 7).
Though the Chinese government has made important steps towards reducing pollution, such as investment in heating, urban gas, and green areas, it is estimated that industrial growth driven by exports have exceeded these efforts and minimized their impact. The government would do well to enact public policies to regulate industries regarding the management of pollutant-laden waste.
Put simply, China invests 0.15% of its GDP into solving 70% of its environmental contaminant issues. Of this 0.15%, the Chinese government invests about 90% in air pollution and only 10% in contaminated water and industrial waste. Basically, the results of this study indicate that state-level investment does little to actually address China’s pollution problem. We would argue that China needs to implement environmental reform to rework its environmental protection investment to ensure sustained growth. Antipollution measures for water and industrial waste must increase; taxes should likewise increase for those industries that continue to pollute. If current trends continue, the high cost of health and environmental sacrifices will surpass China’s economic growth.
This study was not without limitations. The information provided here can be considered as a starting point for further research. The primary limitations are:
Table 7. Decomposition of environmental investment in China 2000-2014 in millions of dollars.
Based on data from the national institute of statistics of China.
1. This research is descriptive-explanatory and it provides (generally) macroeconomic variables within an econometric model and describes how they are interrelated and/ or interact with each other.
2. This study did not include a cross-sectional analysis by sector or subsector, which would have yielded more precise information regarding which was the most pollutant-intensive.
3. The quantitative analysis performed here provided a ratio of exports to environmental pollution; in this sense, it is not possible to propose public policies that help to diminish the effects of pollution though the data obtained may represent a solid basis for initiating such studies.
Reducing the volume of pollutants produced across China is a highly complex and challenging endeavor. The results described above lend themselves to a number of potential proposals which can be summarized as follows.
1. An industrial diagnosis identifying volumes elements that spew into the environment by industry is required. It is necessary to determine the level to which various technologies applied to various industries’ production processes are especially pollutant-intensive in order to invest accordingly.
2. The current legislation regarding industrial operation should be reviewed with the purpose of identifying weak points that allow such high levels of pollutant emissions on Chinese soil. These points can then be countered with robust legislation.
3. Research, innovation, and the application of newer, cleaner technologies should be determinedly promoted to reduce the quantity and volume of pollutants. There must also be a economic and environmental reform in the cost involved for public finances to encourage investment in China’s ecological future.
Cite this paper
Valadez, G.V. and Hu, J.Q. (2016) Relationship between the Environment and Economic Growth in China via Exports: A Perspective of Ecological Impact (2000-2014). Journal of Environmental Protection, 7, 1670-1692. http://dx.doi.org/10.4236/jep.2016.711136
References
- 1. Kuznet, S. (1973) Modern Economic Growth: Findings and Reflections. American Economic Review, 63, 247-258.
- 2. Kuznets, S. (1981) Modern Economic Growth and the Less Developed Countries. Conference on Experiences and Lessons of Economic Development, The Institute of Economics, Academia Sinica, Taipei, 19-20 July 1981, 57-66.
- 3. Romer, P. (1989) Capital Accumulation in the Theory of Long Run Growth. In: Barro, J.,, Ed., Modern Business Cycle Theory, Harvard University Press, New York, 51-127.
- 4. Birdsall, N. and Wheeler, D. (1993) Trade Policy and Industrial Pollution in Latin America: Where Are the Pollution Havens? Journal of Environment and Development, 2, 137-149.
http://dx.doi.org/10.1177/107049659300200107 - 5. Lee, H. and Roland-Holst, D. (1997) The Environment and Welfare Implications of Trade and Tax Policy. Journal of Development Economics, 52, 65-82.
http://dx.doi.org/10.1016/S0304-3878(96)00439-7 - 6. Jones, L. and Rodolfo, E. (1995) A Positive Model of Growth and Pollution Controls. Review of Economic Dynamics, 4, 369-405.
- 7. Cole, M., Elliott, R. and Azhar, A. (2000) The Determinants of Trade in Pollution Intensive Industries: North-South Evidence. University of Birmingham, Birmingham.
- 8. Rock, M. (1996) Pollution Intensity of GDP and Trade Policy: Can the World Bank Be Wrong. Development, 24, 471-479.
http://dx.doi.org/10.1016/0305-750X(95)00152-3 - 9. Tobey, J. (1990) The Effects of Domestic Environmental Policies on Patterns of World Trade: An Empirical Test. Kyklos, 43, 191-209.
http://dx.doi.org/10.1111/j.1467-6435.1990.tb00207.x - 10. Koopmans, T.C. (1963) On the Concept of Optimal Economic Growth. Cowles Fundation Discussion Paper No. 163, Yale University, 1-36.
- 11. Cass, D. (1965) Optimum Growth in an Aggregative Model of Capital Accumulation. Review of Economic Studies, 32, 233-240.
http://dx.doi.org/10.2307/2295827 - 12. Beckerman, W. (1992) Economic Growth and the Environment: Whose Growth? Whose Environment? World Development, 20, 481-496.
http://dx.doi.org/10.1016/0305-750X(92)90038-W - 13. Li, H.Z. (2009) Origin and Development of International Trade and the Environment. International Foreign Trade Zhejiang University, Hangzhou, Vol. 4, 68-73.
- 14. Huang, L.Y. and Chen, S.P. (2005) Solutions Development of Foreign Trade and the Environment to Developing Countries. International Political and Economic Forum, Article No. 3.
- 15. Ye, J.G. and Xu, D.X. (2007) Empirical Analysis between Exports and the Environment of China. International Trade, No. 5, 62-79.
- 16. Zhao, L.Y., Zhang, L.H., Yi, X.H. and Zhua, J.Z. (2014), The Construction of a Road with Environmental Cultures to China. China Economy and Finance.
- 17. Dang, Y.P. (2010) The Effect of Foreign Trade of China to Pollution, an Empirical Study. Journal of Finance and Economics, 36, 2.
- 18. Gujarati, D.N. (2009) Econometría. Mc Graw Hill, México
- 19. Quantitative Micro Software, LLC. (2009) EViews 7 User's Guide II. Quantitative Micro Software, LLC, Print in the United State of America.
http://schwert.ssb.rochester.edu/a425/ev72.pdf - 20. Kaldor, N. (1963) Capital Accumulation and Economic Growth. Seminar on the Programming of Economic Development, King's College, Cambridge
http://www.fep.up.pt/docentes/joao/material/macro2/Kaldor_1961.pdf - 21. Industrial Pollution Exceeds 70% in the Chinese Economy, Difficult Third Parties to Promote.
https://www.boxun.com/news/gb/china/2015/03/201503040135.shtml#.WA5LhCRANCg - 22. BBC China (2016) Pollution in China: 300 Million Dollars of Medical Expenses per Year.
http://www.bbc.com/zhongwen/trad/china/2014/03/140325_china_urbanisation_health - 23. (2016) High Rates of Lung Cancer, Is Everything to Blame for Air Pollution?
http://www.cenews.com.cn/kp/hjyjk/201402/t20140218_764836.html - 24. Green Peace (2016) Green Peace: Surprising Coal Ash Emissions, the Main Pollutant of Solid Industrial Waste.
http://www.greenpeace.org/china/zh/news/releases/climate-energy/2010/09/coalash-pr/ - 25. Cuevas, D.J. and Santos, L.J. (2006) Environmental Kuznets Curve.
https://dfedericos.files.wordpress.com/2012/02/planteamiento-kuznets-corregido.pdf - 26. Chinese Embassy in Jamaica (2015) Foreign Media: China’s GDP Will Surpass the United States after 11 Years.
http://china.huanqiu.com/News/mofcom/2015-06/6777314.html - 27. Shen, D.Y. (2014) Dependency Ratio of China’s Foreign Trade.
http://money.163.com/keywords/5/1/59168d384f9d5b585ea6/1.html - 28. Yu, L.X. (2009) “Economics low Carbon Emission” Strategic Change under Pressure for Sustainable Growth in Trade.
http://jjckb.xinhuanet.com/gnyw/2009-08/26/content_177086.htm