Journal of Environmental Protection
Vol. 3 No. 7 (2012) , Article ID: 21143 , 8 pages DOI:10.4236/jep.2012.37080
Assessment of Environmental Changes in the Iraqi Marshes by Index of Biological Integrity
![]()
1Department of Fisheries and Marine Resources, College of Agriculture, University of Basrah, Basrah, Iraq; 2Department of Biology, College of Science for Women, University of Baghdad, Baghdad, Iraq; 3Environmental Research Center, University of Technology, Baghdad, Iraq; 4Twin Rivers Institute, American University of Iraq-Sulaimani, Sulaimani, Iraq; 5Nature Iraq, Sulaimani, Iraq.
Email: azharalsaboonchi@yahoo.com, jawaddhy@yahoo.co.in
Received March 23rd, 2012; revised April 28th, 2012; accepted May 29th, 2012
Keywords: IBI; Nature Iraq; Marshes; Aquatic Ecology
ABSTRACT
Preventing water flow through the marshes in southern Iraq was a policy of the previous regime in Iraq during 1990’s. This phenomena lead to tremendous structural changes in ecosystems, however after 2003 rehabilitation policy applied to the area was implementd in order to re-establish marshes ecosystems. In this study, a zooplankton Index of Biotic Integrity (Z-IBI) was measured for the first time in different sites in the Iraqi marshes. The following eight metrics were used: zooplankton ratio, relative abundance of Calanoid, relative abundance of Cyclopoid, relative abundance of Cladocera, relative abundance of Rotifera, biomass of tolerant species, biomass of sensitive species, and ratio of zooplankton biomass to phytoplankton biomass. Results of application of Z-IBI on the Iraqi marshes in this study indicate a slight improvement of water quality in the central marshes and degradation in other parts of the marshes. This work may fill part of the existing research gap in the application of the IBI index in Iraqi inland waters to illustrate the effects of previous deterioration in water quality.
1. Introduction
The Mesopotamian marshlands are one of the unique ecosystems which had been deliberately dried up for more than a decade. Ultimately, the whole ecosystem demolished. However, after 2003 the policy was to restore the marshes again. By February 2004, nearly 20% of the 15,000 km2 of the former drained marshes had been reflooded. More recent estimates from the Iraq Water Ministry and from UNEP (United Nations Environment Programme) satellite photos indicate that by 2005, 39% of the destroyed marshes had standing water; also noteworthy, a trend analysis of vegetation regrowth from January 2003 until September 2005 indicated that vegetation cover was expanding at 800 km2 per year [1].
The Index of Biological Integrity (IBI) has been proven to be an important assessment tool for evaluating resource quality [2]. In fact, the lack of a biological system for the assessment of ecological quality specific to Iraqi inland water prevents the effective management of these natural resources. Karr and Kane [3,4] stated that the solution of water resource problems will not come from better regulation of chemicals or the development of better assessment tools to detect degradation; “what is needed is a better understanding of biological water quality and what organisms are appropriate for its measurement”. Legislation was enacted in 1972 (Water Pollution Control Act Amendments) and in 1977 (Clean Water Act) that called for the restoration and maintenance of not only physical and chemical integrity of USA waters but also the biological integrity of these waters [3]. Because of the explicit inclusion of biological integrity into this definition, physical and chemical measures of water were no longer sufficient [4]. Thus, a number of biotic measures of water quality were subsequently developed such as the IBI, which is a tool to measure the biological water quality of an ecosystem [4].
IBI has been used throughout United States [2,4,5], Mexico [6,7], Canada [8], Argentina [9] , Italy [10] and other places.
In general the biological integrity is an ecosystem property that can be defined as the capability to support and maintain a balanced, integrated, and adaptive community of organisms having a species composition, diversity, and functional organization comparable to that of the natural habitat of the region [11].
Karr [12] was the first who devised an Index of Biological Integrity to measure biological integrity in a stream, using fish as indicator species. The index was then developed to help in evaluating the conditions of a small warm water stream in Central Illinois and Indiana [13]. Furthermore, IBI has been adapted and modified to use benthic macro invertebrates as indicators [14] and also has been modified to evaluate integrity of estuarine ecosystems [15].
Plankton can be used and is often preferred to construct an IBI, because plankton is highly sensitive to environmental changes [16] and it is inexpensive to collect. In addition, samples can be stored for long periods and historical samples can be analyzed and contrasted with current samples [4]. Kane [4] has also stated that all components of lake function are influenced in major ways by the dynamics of plankton. These communities have been successfully used to characterize water, with respect to nutrient conditions. Gannon and Stemberge [17] examined zooplankton communities as indicators of lake trophic status and they found that the ratio of Calaniod copepod abundance to Cladoceran plus Cyclopoid copepod abundance is importante among different trophic conditions. Rotifer species assemblages were associated with trophic conditions in Lake. Stemberger and Miller [18] found that zooplankton assemblage could be used as indicators of the N:P ratio in water, due to differential requirements of plankton for these nutrients. Zooplankton could be used to infer changes in watershed characteristic and nutrient loading. Clearly, zooplankton and phytoplankton dynamics have a large impact on aquatic ecosystem [4]. Therefore, models of planktion index of biological integrity (P-IBI) were recently developed and proved to provide valuable assessment tool for measuring offshore water quality of lakes and can be used to monitor changes in these lakes stemming from anthropogenic stressors, such as nutrient addition [4]. In this previous study, it was suggested that the increase in lake wide P-IBI score from 1970 to the mid-1990’s and its subsequent decline reflect the changing trophic status of the lake Erie.
In terms of biomass and productivity, the dominant groups of zooplankton in most lakes are Crustacea and Rotifera [19]. Zooplankton plays a pivotal role in aquatic food webs as they are important food for fish and invertebrate predators and they graze heavily on algae, bacteria, protozoa, and other invertebrates [20]. Zooplankton communities are typically diverse (>20 species) and occur in almost all lakes, rivers and ponds. In general zooplanktons are less important in rivers and streams because they cannot maintain positive net growth rates in the face of downstream losses [21].
Zooplankton communities are highly sensitive to environmental variations which lead to changes in their abundance and species diversity. Community composition can provide important indications of environmental change or disturbance. Zooplankton communities often respond quickly to environmental change because of their short generation times (usually days to weeks in length). Zooplankton communities also respond to a wide variety of disturbances including nutrient loading [22-24], acidification [25-27], contaminants [28], fish densities [29], and sediment inputs [30].
The Z-IBI in Iraqi marshes is applied here for the first time as a component of Nature Iraq and Twin Rivers Institute, American University of Iraq-Sulaimani, Data Indices project. This will undoubtedly encourage more detailed studies in the near feature on the application of IBI in other inland waters in Iraq. The creation of indices in ecology reflects the three reasons that science attempts to arrange its findings: 1) to gain an overall view of the ecosystem, 2) to simplify the understanding of complex systems by characterizing few common factors, and 3) to predict properties and relationships of parts of systems from other measured properties. This will be of great importance in this specific area—the marshlands of Iraq— as it had faced a deliberate deterioration through governmental policy that lasted for more than 10 years in such a unique ecosystem of the world [1]. The importance of this work will become evident when considering the policy to recover and maintain the area through supplying water again from Euphrates since 2003.
2. Material and Methods
Data used in the present study were collected form Nature Iraq’s Key Biodiversity Areas (KBA) project [31- 33]. Briefly, zooplankton samples were collected on monthly basis from different sites and different locations in Al Hawizeh Marsh, Central Marsh and East and West of Al Hammar Marsh (Figure 1). Data were arranged seasonally (summer and winter from 2005 to 2007).
Zooplankton samples were taken by a 20 μ and 80 μ mesh size net. The contents of the net were then concentrated and preserved in 4% formalin. Organisms were identified and counted for each sample to determine the community composition and the relative ratios of each taxonomic group in the sample. Identification for species was done by a compound microscope and the following references were used [34-36].
Total density of species was calculated by the sum of monthly density of each species. Then zooplankton species were placed according to the following eight metrics on the basis of the work of Lyons et al. [6], Kane [4] and Solimini et al. [10]: zooplankton ratio, relative abundance of Calanoid, relative abundance of Cyclopoid, relative abundance of Cladocera, relative abundance of Rotifera, biomass of tolerant species (Branchionus spp., Keratella cochlearis and Trichocera multicrinis), biomass
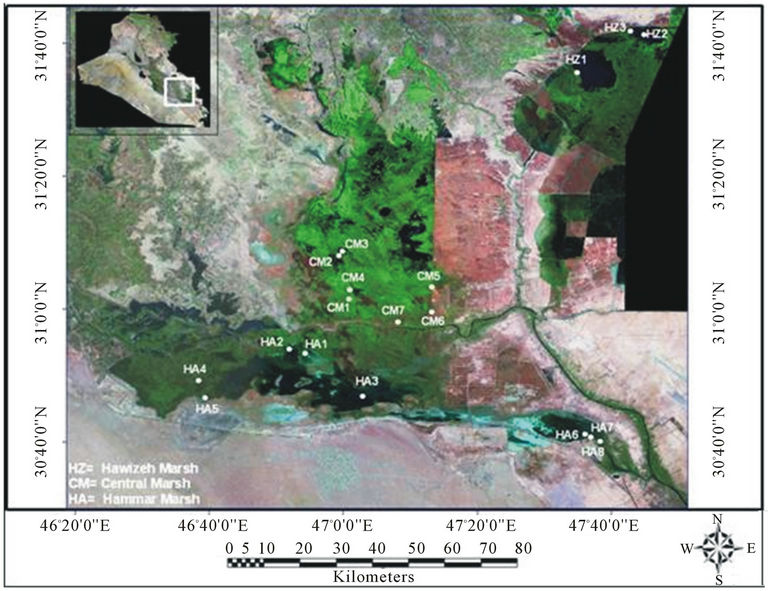
Figure 1. Study sites in Al Hawizeh, Central, and Al Hammar marshes.
of sensitive species (Filinia longiseta, Polyarthra dolichoptera and Keratella hiemalis) and ratio of zooplankton biomass to phytoplankton biomass. Zooplankton ratio can be calculated as following:
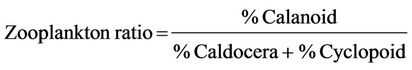
These eight metrics composes four major groups; Calenoids, Cyclopoids, Cladocera and Rotifers.
Metric raw data (percentages of densities) were converted into metric scores after being subjected to a scale of thresholds of 1, 3, and 5 [12]. The development of these thresholds was based on historical data and professional judgment as recommended in USEPA [37]. Thus, a threshold of 5 was given for metrics that has values equal or near to reference condition, a threshold of 3 was given to those of medium conditions and 1 to those of worst conditions. In addition, according to Astin [38], these values reflect those more traditional measures of trophic status. Accordingly, using a scale of 5 reflects eutrophic conditions, 3-5 reflects mesotrophic conditions, and 1 reflects oligotrophic condition for each metric. The selected metrics and their thresholds are shown in Table 1.
The sums of these metric scores were calculated seasonally as the zooplankton indices of biological integrity. The sum of each score for each season represents the variation of Z-IBI for each site. The highest score was 40 derived from multiplying the number of metrics (8) by the maximum score for each metric (5) and indicate a site with most natural condition. While the lowest score was 8 derived from multiplying the number of metrics by the minimum score for each metric (1) and indicate very poor condition for zooplankton communities. Thus, the sampling sites were evaluated as 5 integrity classes of Excellent (36 - 40), Good (34 - 35), Fair (22 - 29), Poor (14 - 20) and very poor (8 - 12) conditions.
3. Results and Discussion
In Al Hawizeh Marsh, the results of the Z-IBI ranged between 20 - 28 “Poor to Fair” ecosystem conditions (Table 2). With exception of the HZ1 site in the summer of 2006, seasonal values of the Z-IBI of Al Hawizeh Marsh maintained slightly above “Fair” ecosystem conditions at all stations, which indicates some variation in the status of these sites. However, continuous monitoring is necessary to predict any change in the future. Nevertheless, HZ1 and HZ2 stations reflected higher values in the summer of 2005 and degradation was evident at both stations during 2006 and 2007, in general. Also, values at HZ3 fluctuated between 22.0 and 24.0 which indicate “Fair” ecosystem conditions. This behavior might be related to local enrichment or some non climatic factors [39,40]. The absence of Calanoids and Cyclopids and the abundance of Rotifers weighed heavily on the results,
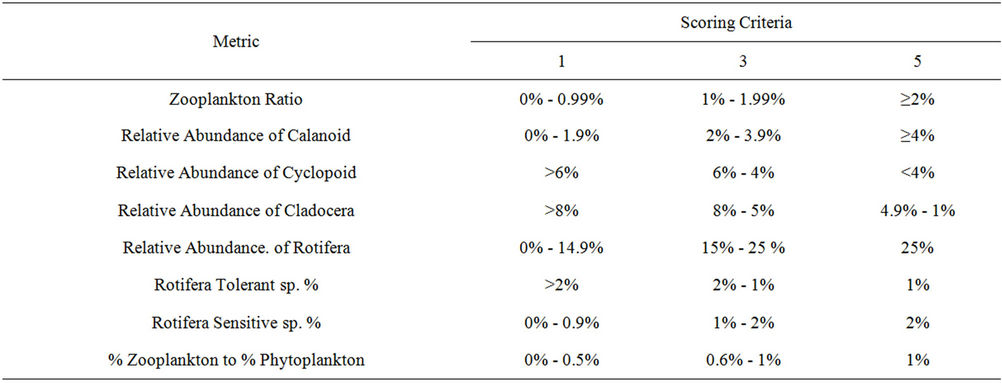
Table 1. Scoring criteria for selected metrics.

Table 2. Seasonal variation for Z-IBI at different sites of Al Hawizeh marsh.
particularly at stations HZ2 and HZ3 (data not shown). The mean values of Z-IBI reflect “Fair” ecosystem conditions of water in all the stations measured (Table 2). Although total phosphorus (P) concentration in surface water of Al-Hawizeh marsh was recorded as close to river water values [1] this doesn’t necessarily mean that this marsh environment is suitable for plankton communities since the Water resources in Iraq, especially in the last two decades have also suffered of remarkable stress in terms of water quantity due to different reasons such as the dams built on Tigris and Euphrates in the riparian countries, the global climatic changes and the local severe decrease of the annual precipitation rates and improper planning of water uses inside Iraq. Water quality is certainly affected by the quantity and quality of supplies coming from different sources. However, a continuous sampling to represent all stations and in shorter intervals may well lead to a more reliable understanding of Z-IBI in the area. Moreover, expanding the metrics to include other groups will certainly reduce the existing gap.
Seven sites at the Central Marsh were selected (Table 3), the Z-IBI values for these sites ranged between 16.0 “Poor” ecosystem conditions during the summer of 2005 at Al Baseta site/CM6 and 30.0 “Fair to Good” ecosystem conditions at Al-Khanziri/CM7 during the winter of 2007. Although various stations reflect different pattern of quality still one can observe with few exception that values increased over time at all stations. In general, values were lower during 2005 and 2006, in contrast to 2007; nevertheless, values above 30.0 were not recorded indicating slightly higher values than “Fair” ecosystem conditions. This is reflected in the mean values (Table 3) as well. The explanation for such condition may be due to the zooplankton ratio which was very low during algal blooms and more eutrophic conditions, and an increase in phytoplankton biomass associated with decrease in zooplankton biomass reflecting zooplankton death caused by chemicals produced by the algae and large filamentous sized algae. In contrast, Kane [4] explained this phenomenon by phosphorus loading. Calanoid copepods indicate more oligotrophic conditions and Cyclopoid copepods with Cladocerans are indicators of more eutrophic conditions.
Rotifera composition was used as an indicator of lake trophic status. For example the species Branchionus spp., Filinia longiseta, Keratella cochlearis, and Trichocerca multicrinis were used as indicators for eutrophic waters, while the species Kellicotta longispina, Keratella heimalis, and Polyarthra dolichoptera were found in

Table 3. Seasonal variations of Z-IBI at different sites of the Central marsh.
mesotrophic and oligotrophic waters [4].
The ratio of zooplankton to phytoplankton was proposed as an indicator of lake ecosystem’s health for the Ecological Modeling Method (EMM) developed by Xu et al. [41]. This ratio is very low during algal blooms and more eutrophic conditions, due to an increase in phytoplankton biomass and a decrease in zooplankton biomass and due to interference to zooplankton death caused by chemicals produced by the large filamentous sized algae. This ratio decreases under other types of chemical pollution. The ratio also indicates the energy transfer efficiency between lower and upper trophic levels [42]. When the ratio is low, less energy is available for trophic levels above zooplankton.
The mean values in the Central Marsh ranged between 20.9 - 26.3 during the summer of 2005 and the winter of 2007, respectively, and 25.1 during the summer of 2007, which indicate an improvement in water quality over time. The density of Cyanobacteria was low in the winter of 2007. Further research, including studying the influence of many biotic factors on zooplankton in more nearby stations will lead to a refinement of the index [21].
The levels of Z-IBI at Al Hammar marsh ranged between 16.0 to 28.0 indicating “Poor-Fair” ecosystem conditions. This result is consistent with previous study of Richarson and Hussein [1] who showed that AlHammar had the highest concentrations of most water constituents, which indicates that this reflooded site is more saline and chemically enriched.
Degradation in water quality was generally evident at all stations, as higher values were recorded in the summer of 2005 in contrast to the summer of 2007 at almost all stations (Table 4). Similarly, a gradual time-wise degradation was almost evident from the mean values of the results from the summer of 2005 to the summer of 2007 as values were reduced from 22.9 to 20.3 and 18.2 throughout the summer of 2005, 2006 and 2007, respectively. This was clear when comparing mean values of the winter of 2006 with those of 2007, as the values were 20.8 to 20.4, respectively.
Results of this investigation in this area of the marsh show a decrease in zooplankton populations and an increase in phytoplankton biomass (paper under preparation). Very low density of Rotifera sensitive species were found whereas high density of Branchionus and Felenia longestai were observed in different stations of this area. However, because most of southern mashes have been greatly modified before 2003 [1], a particular challenge will be to determine which aspects of biological assemblage are “natural” and which are consequences of dryness, long term, and pervasive human activities. Additional bibliographic, systematic and ecological studies of the marshes fauna and flora will undoubtly be needed to address this issue and to allow continued development and application of the (IBI) concept in this region as what have been applied in Serbia [21], Mexico [7] and Italy [10] or other places of the world.
By comparing different marshes in respect to the mean values, the results generally showed that there is improvement in water quality over time since reflooding in the Central Marsh only, since the values increased from 20.9 to 25.1 between the summer of 2005 and the summer of 2007. The results clearly indicate that slight improvements of water quality in the Central marshes were evident, whereas degradation of water quality was observed in Al Hammar marshes. This may be due to removal of freshwater water flows from the Iranian side into the Al Hammar marsh due to the recent dike that has been constructed along the border [43].
The zooplankton index of biotic integrity (Z-IBI) was applied for the first time in Iraq in the present project in
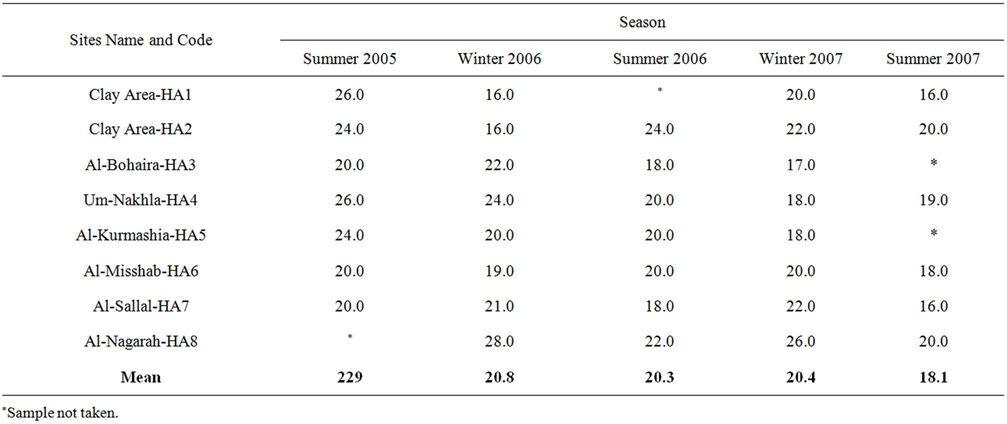
Table 4. Seasonal variations of Z-IBI at different sites of Al Hammar marsh.
order to show the states of zooplankton in southern marshes of Iraq. However these results may fill part of the existing gap in application of (IBI) in Iraqi inland waters and may further be used as baseline information applied in various water bodies in Iraq, leading to an overall Iraqi IBI. Finally from the current results, one might conclude a partial improvement of the status of the marshes, improved water quality, after the drying the marshes were stopped in 2003. Nevertheless, continuous ecological monitoring is necessary to follow up future changes t in southern marshes of Iraq.
4. Acknowledgements
The authors would like to express appreciation to Nature Iraq (NI) and Twin Rivers Institute, the American University of Iraq-Sulaimani (TRI, AUIS) who funded this research. We also acknowledge Haider Ahmed, Ali Mohammed and Hussam Jabbar (NI) for their efforts in field sampling and Miss S’uad Kadhem.
REFERENCES
- C. J. Richardson and N. A. Hussain, “Restoring the Garden of Eden: An Ecological Assessment of the Marshes of Iraq,” BioScience, Vol. 56, No. 6, 2006, pp. 477-489. doi:10.1641/0006-3568(2006)56[477:RTGOEA]2.0.CO;2
- J. R. Gammon and T. P. Simon, “Variation in a Great River index of Biotic Integrity over a 20 Year Period,” Hydrobiologia, Vol. 422-423, 2000, pp. 291-304.
- J. R. Karr, “Biological Integrity: A long-Neglected Aspect of Water Resource Management,” Ecological Applications, Vol. 1, No. 1, 1991, pp. 66-84. doi:10.2307/1941848
- D. D. Kane, “The Development of Planktonic Index of Biotic Integrity for Lake Erie,” Ph.D. Thesis, Ohio State University, Columbus, 2004.
- R. V. Lacouture, J. M. Johnson, C. Buchanan and H. G. Marshall, “Phytoplankton Index of Biotic Integrity for Chesapeake Bay and Its Tidal Tributaries,” Estuaries and Coasts, Vol. 29, 2006, pp. 598-616.
- J. Lyons, A. Gutiérrez-Hernández, E. Dìaz-Pardo, E. Soto-Galera, M. Medina-Nava and R. Pineda-López, “Development of a Preliminary Index Of Biotic Integrity (IBI) Based on Fish Assemblages to Assess Ecosystem Condition in the Lakes of Central Mexico,” Hydrobiologia, Vol. 418, No. 1, 2000, pp. 57-72. doi:10.1023/A:1003888032756
- N. Mecado-Silva, J. D. Lyons, G. Maldonado and M. M. Nova, “Validation of a Fish-Based Index of Biotic Integrity for Streams and Rivers of Central Mexico,” Reviews in Fish Biology and Fisheries, Vol. 12, No. 2-3, 2002, pp. 179-191. doi:10.1023/A:1025099711746
- A. Lumb, D. Halliwell and T. Sharma, “Application of CCME Quality Index to Monitor Water Quality: A Case of the Mackenzie River Basin, Canada,” Environmental Monitoring & Assessment, Vol. 113, No. 1-3, 2006, pp. 411-429. doi:10.1007/s10661-005-9092-6
- N. Gómez and M. Licursi, “The Pampean Diatom Index (IDP) for Assessment of Rivers and Streams in Argentina,” Aquatic Ecology, Vol. 35, No. 2, 2001, pp. 173-181. doi:10.1023/A:1011415209445
- A. G. Solimini, M. Bazzanti, A. Ruggiero and G. Carchini, “Developing a Multimetric Index of Ecological Integrity Based on Macroinvertebrates of Mountain Ponds in Central Italy,” Hydrobiologia, Vol. 597, No. 1, 2008, pp. 109-123. doi:10.1007/s10750-007-9226-7
- J. R. Karr and D. R. Dudley, “Ecological Perspective on Water Quality Goals,” Environmental Management, Vol. 5, No. 1, 1981, pp. 55-68. doi:10.1007/BF01866609
- J. R. Karr, “Assessment of Biotic Integrity Using Fish Communities,” Fisheries, Vol. 6, No. 6, 1981, pp. 21-27. doi:10.1577/1548-8446(1981)006<0021:AOBIUF>2.0.CO;2
- J. R. Karr and E. W. Chu, “Biological Monitoring and Assessment: Using Multimetric Indexes Effectively,” University of Washington, Seattle, 1997.
- L. S. For, J. R. Karr and R. W. Wisseman, “Assessing Invertebrate Responses to Human Activities,” Journal of the North American Benthological Society, Vol. 15, No. 2, 1996, pp. 212-231. doi:10.2307/1467949
- S. B. Weisberg, J. Ranasinghe, D. M. Dauer, L. C. Schaffner, R. J. Diaz and J. B. Frithson, “An Estuarine Benthic Index of Biotic Integrity for Chesapeake Bay,” Estuaries, Vol. 20, No. 1, 1997, pp. 149-158. doi:10.2307/1352728
- D. W. Schindler, “Detecting Ecosystem Response to Anthropogenic Stress,” Canadian Journal of Fisheries and Aquatic Sciences, Vol. 44, 1987, pp. 6-25. doi:10.1139/f87-276
- J. E. Gannon and R. S. Stemberger, “Zooplankton (Especially Crustaceans and Rotifers) as Indicators of Water Quality,” Transactions of the American Microscopical Society, Vol. 97, No. 1, 1978, pp. 16-35. doi:10.2307/3225681
- R. S. Stemberger and E. Miller, “A Zooplankton N:P Ratio Indicator for Lakes,” Environmental Monitoring & Assessment, Vol. 51, No. 1-2, 1998, pp. 29-51. doi:10.1023/A:1005965223474
- P. Schriver, J. Bogestrand and E. Jeppesen Sondergaard, “Impact of Submerged Macrophytes on Fish-ZooplanktonHytoplankton Interactions: Large-Scale Enclosure Experiments in a Shallow Eutrophic Lake,” Freshwater Biology, Vol. 33, No. 2, 1995, pp. 255-270. doi:10.1111/j.1365-2427.1995.tb01166.x
- G. E. Hutchinson, “A Treatise on Limnology. Vol. II, Introduction to Lake Biology and the Limnoplankton,” John Wiley & Son, London, 1967.
- V. Simića and S. Simić, “Use of the River Macrozoobenthos of Serbia to Formulate a Biotic Index,” Hydrobiologia, Vol. 416, 1999, pp. 51-64. doi:10.1023/A:1003864610386
- E. McCauley and J. Kalff, “Empirical Relationships between Phytoplankton and Zooplankton Biomass in Lakes,” Canadian Journal of Fisheries & Aquatic Sciences, Vol. 38, No. 4, 1981, pp. 458-463. doi:10.1139/f81-063
- M. L. Pace, “An Empirical Analysis of Zooplankton Community Size Structure across Lake Trophic Gradients,” Limnology & Oceanography, Vol. 31, No. 1, 1986, pp. 45-55. doi:10.4319/lo.1986.31.1.0045
- S. Dodson, “Predicting Crustacean Zooplankton Species Richness,” Limnology & Oceanography, Vol. 37, No. 4, 1992, pp. 848-856. doi:10.4319/lo.1992.37.4.0848
- M. T. Brett, “Zooplankton Communities and Acidification Processes (a Review),” Water, Air, & Soil Pollution, Vol. 44, No. 3-4, 1989, pp. 387-414.
- W. N. Keller and D. Yan, “Recovery of Crustacean Zooplankton Species Richness in Sudbury Area Lakes Following Water Quality Improvements,” Canadian Journal of Fisheries and Aquatic Sciences, Vol. 48, No. 9, 1991, pp. 1635-1644. doi:10.1139/f91-194
- D. R. Marmorek and J. Korman, “The Use of Zooplankton in a Biomonitoring Program to Detect Lake Acidification and Recovery,” Water, Air, & Soil Pollution, Vol. 69, No. 3-4, 1993, pp. 223-241. doi:10.1007/BF00478160
- N. D. Yan, W. Keller, K. M. Somers, T. W. Pawson and R. E. Girard, “Recovery of Crustacean Zooplankton Communities from Acid and Metal Contamination: Comparing Manipulated and Reference Lakes,” Canadian Journal of Fisheries and Aquatic Sciences, Vol. 53, No. 6, 1996, pp. 1301-1327. doi:10.1139/f96-065
- S. R. Carpenter and J. F. Kitchell, “The Trophic Cascade in Lakes,” Cambridge University Press, England, 1993. doi:10.1017/CBO9780511525513
- B. E. Cuker “Field Experiment on the Influence of Suspended Clay and P on the Plankton of a Small Lake,” Limnology & Oceanography, Vol. 32, No. 4, 1987, pp. 840-847. doi:10.4319/lo.1987.32.4.0840
- Nature Iraq, “Key Biodiversity Areas Program: Water Quality Data,” Unpublished Raw Data, 2005.
- Nature Iraq, “Key Biodiversity Areas Program: Water Quality Data,” Unpublished Raw Data, 2006.
- Nature Iraq, “Key Biodiversity Areas Program: Water Quality Data,” Unpublished Raw Data, 2007.
- H. B. Ward and G. C. Whipple, “Fresh-Water Biology,” 2nd edition, John Wiley, New York, 1959.
- T. Mizuno, “Illustration of the Fresh Water Plankton of Japan,” Hoikusha, Osaka, 1971 (in Japanese).
- M. D. Balcer, N. L. Korda and S. I. Dodson “Zooplankton of the Great Lakes,” University of Wisconsin Press, Madison, 1984.
- U. S. Environmental Protection Agency (USEPA) “Best Practices for Identifying Reference Condition, in MidAtlantic Streams,” 2006. http://www.ep.gov/bioiweb1/pdf/reference-EPA-260-F-06-002%20rev-pdf
- L. E. Astin, “Developing Biological Indicators from Diverse Data: The Potomac Basin-Wide Index of Benthic Integrity (B-IBI),” Ecological Indicators, Vol. 7, No. 4, 2007, pp. 895-908. doi:10.1016/j.ecolind.2006.09.004
- O. Johannsson, C. Dumitru and D. Graham, “Estimation of Zooplankton Mean Length for Use in an Index of Fish Community Structure and Its Application to Lake Erie,” Journal of Great Lakes Research, Vol. 25, No. 1, 1999, pp. 179-186. doi:10.1016/S0380-1330(99)70726-4
- S. A. Ludsin, M. W. Kershner, K. A. Blocksom, R. Knight and R. A. Stein, “Life after Death in Lake Erie: Nutrient Controls Drive Fish Species Richness, Rehabilitation,” Ecological Applications, Vol. 11, No. 3, 2001, pp. 731-746. doi:10.1890/1051-0761(2001)011[0731:LADILE]2.0.CO;2
- F. L. Xu, R. W. Dawson, S. Tao, J. Cao and B. G. Li, “A Method for Lake Ecosystem Health Assessment: An Ecological Modeling Method (EMM) and Its Application,” Hydrobiologia, Vol. 443, No. 1-3, 2001, pp. 159- 175.
- K. E. Havens, “Size structure and Energetics in a Plankton Food Web,” Oikos, Vol. 81, No. 2, 1998, pp. 346-358. doi:10.2307/3547055
- C. J. Richardson. “The Status of Mesopotamian Marsh Restoration in Iraq: A Case Study of Transboundary Water Issues and Internal Water Allocation Problems,” in: K. Korhonen-Kurki and M. Fox, eds., Towards New Solutions in Managing Environmental Crisis. Helsinki University, Helsinki, 2010, pp. 59-72.