Atmospheric and Climate Sciences
Vol.3 No.3(2013), Article ID:34088,12 pages DOI:10.4236/acs.2013.33042
An Air Mass Based Approach to the Establishment of Spring Season Synoptic Characteristics in the Northeast United States
Department of Earth and Atmospheric Sciences, State University of New York College at Oneonta, Oneonta, USA
Email: Melissa.Godek@oneonta.edu
Copyright © 2013 Rebecca Zander et al. This is an open access article distributed under the Creative Commons Attribution License, which permits unrestricted use, distribution, and reproduction in any medium, provided the original work is properly cited.
Received April 5, 2013; revised May 6, 2013; accepted May 14, 2013
Keywords: Air Mass; Spring Season; Northeast United States; Spatial Synoptic Classification; Climate Change
ABSTRACT
The Northeast United States spring is indicative of major meteorological and biological change though the seasonal boundaries are difficult to define and may even be changing with global climate warming. This research aims to obtain a synoptic meteorological definition of the spring season through an assessment of air mass frequency over the past 60 years. The validity of recent speculations that the onset and termination of spring have changed in recent decades with global change is also examined. The Spatial Synoptic Classification is utilized to define daily air masses over the region. Annual and seasonal baseline frequencies are identified and their differences are acquired to characterize the season. Seasonal frequency departures of the early and late segments of the period of record are calculated and examined for practical and statistical significance. The daily boundaries of early and late spring are also isolated and assessed across the period of record to identify important changes in the season’s initiation and termination through time. Results indicate that the Northeast spring season is dominated by dry air masses, mainly the Dry Moderate and Dry Polar types. Prior to 1975, more polar air masses are detected while after 1975 more moderate and tropical types are identified. Late spring is characterized by increased variability in all moist air mass frequencies. These findings indicate that, from a synoptic perspective, the season is dry through time but modern springs are also warmer than those of past decades and the initiation of the season is likely arriving earlier. The end of the season represents more variable day-to-day air mass conditions in modern times than detected in past decades.
1. Introduction
The record-setting 2011 tornado season demonstrates that the impacts of springtime circulation patterns can be especially devastating for locals whose homes and towns are destroyed, as evidenced in Joplin, MO [1]. In April alone, 758 confirmed tornadoes were reported that year [2]. With the vested interest of companies and commerce in the spring season, and that so many people feel the effects of this changing time of year, it is surprising that the definition of “spring” remains somewhat arbitrary. There is no single, universally referenced definition for spring. The astronomical spring season is associated with the arrival of the Vernal Equinox on 23 March each year, ending at the Summer Solstice on 23 June [3]. Despite obvious Earth-Sun relationship linkages to meteorology, the meteorological spring season is different and typified by the three-month period of March-April-May [4].
Sometimes the overlapping intervals of February-MarchApril and April-May-June are also designated as springtime periods in atmospheric research [5]. Interestingly, the general public can associate spring with anything from growing seasons to collegiate academic terms to the beginning of Daylight Saving time and northern switch from frozen-to-liquid precipitation patterns [6,7].
In order to obtain a definition of the spring season from a synoptic meteorological perspective, it is worthwhile to consider the advantages of an air-mass based approach. The spring season can be explained by a number of meteorological changes in variables like temperature, dew point temperature, day length, precipitation and cloud cover fraction. Spring in the heavily populated and agriculturally productive Northeast is also a time of change in frontal low-pressure systems that are advected across the region. Air masses serve as a unique way to characterize many of these conditions all at once since, by definition, they represent a suite of weather conditions that exist over a wide spatial area. Since air masses also mark the boundaries of frontal positions, an air mass assessment can give much more information at once about a season than examining individual meteorological variables.
The lack of recent meteorological literature on the spatial and temporal aspects of the seasons poses a considerable challenge to defining current spring season boundaries. In northern regions, like the Northeast, it is quite possible that climate changes have altered the characteristics and timing of spring. It is interesting to note that these changes may also be occurring in the South though the effects are likely to be most evident in areas of high seasonality, like the Northeast. Reference [8] identified 1975 as the exact timing of transition in several meteorological variables related to global change. This transition year has yet to be examined to see if springs prior to 1975 were different than those since 1975. This information would be of great importance to the approximate 95 million people that live in the Northeast region [9,10].
Therefore, the overall goal of this research is to obtain a synoptic meteorological definition of the spring season through an assessment of air mass type frequency in the Northeast United States. It is hypothesized that air masses can be used successfully to describe the season in this region because the types of air masses present in the winter likely become more or less frequent as the spring season approaches and a similar response may be observed with the shift from spring to summer. A secondary goal of this investigation will test the validity of recent speculations that the beginning and end of the spring season has changed over the past few decades. To do so, air mass frequencies prior to and following 1975 will be examined for changes. It is hypothesized that notable differences may be observed related to the global change signal. Finally, the daily “boundaries” of the onset and ending of the season will also be assessed to see if the timing of the spring season is shifting.
1.1. Characterizing Spring and Seasonal Change
Over the past few decades some attempts to define criteria for characterizing spring season onsets and departures have been made. Other investigations have explored the nature of earlier seasonal onsets with time. Reference [11] compared the standard astronomical definition of spring to the meteorological definition by evaluating average global temperatures in relation to the lag in solar radiation observed at the Earth’s surface. Results indicate that in the northern hemisphere mid-latitudes the meteorological definition is a better representation of the season. Oceans and southern hemisphere location variability patterns are better explained by the astronomical definition.
A recent biological investigation was conducted to discover if the onset of spring in the western United States has changed with time. The research examined the phenological event of the appearance of the first leaf of lilac and honeysuckle each year for the past 55 years. These particular plants respond well to atmospheric variations (especially temperature) and serve as good indications of when the spring season begins. It was found that from 1950-2005, the onset of Spring has advanced 1.5 days per decade [12]. References [13] and [14] found that some bird species begin earlier migration treks as a result of earlier springtime onsets. Similarly, reference [15] performed a meta-analysis of 61 previous North American and European studies that investigated over 690 species and species groups including birds during the past 50 years. This assessment found earlier spring arrivals and breeding during warm periods and that the overall mean spring phenology change for all species is 5.1 days earlier per decade. Reference [16] assessed the arrival of the first North American lilac blooms to see if the spring season changed from 1959 to 1993. Regional patterns indicated that the northwestern and northeastern United States, as well as southwestern Canada, have phenological evidence for a slight advancement of the spring season (as first blooms increased by 0.14 days per year, or, 4.2 days of spring arrived earlier over the past 30 years). Reference [17] studied the timing of the last freeze days in spring and fall across the United States to see if growing seasons are becoming longer in recent decades. The date of the last spring freeze was found to be occurring earlier, by about 1.3 days per decade. The length of the “frostfree” time (a period between the first and last freeze dates) had additionally increased through time.
In many regions of the United States the oncoming of spring can be determined by general weather patterns that are triggered by changes in meteorological variables unique to the spring months. Primarily, the onset of spring coincides with an increase in surface air temperatures. This can lead to excess runoff as winter snow packs begin to melt. Reference [18] found that during the spring season, stream discharge in the Catskill Mountains peaks during periods of rapid snowmelt. Additionally, if the spring season shifts to an earlier date, a related shift in snowmelt will occur causing streams in mountainous regions to produce excess runoff earlier than normal. Reference [19] demonstrated that several of New York’s many reservoirs may begin to fill before expected each year due to excess runoff. One possible result of this could be a greater rate of evaporation over reservoirs. Further, excess accumulated stream discharge from spring rains could mean a greater chance for flooding downstream of reservoirs [20]. Reference [21] shows a record for spring ice melt on lakes in the Northeast from 1850 to 2000. An advancement of the ice melt by nine days was detected in northern and mountainous regions and ice melt arrived 16 days earlier in southern lakes.
1.2. The Spatial Synoptic Classification
To define a season’s atmospheric parameters it is useful to develop a temporal understanding of regional air masses. The traditional and widely used Bergeron classification uses source regions to define four theoretical air masses that can impact the United States [22]. It is important to note, however, that these air masses are not recorded daily at any locations and air masses generally do not retain the same characteristics as the source region once advected to another region. Reference [23] describes the re-development of a more modern air mass, or weather type, classification scheme known as the Spatial Synoptic Classification (SSC). Rather than source region, the SSC index classifies days into similar groupings based on the overlying meteorological conditions present at the time. These variables are used collectively in an algorithm so that the SSC can assign a specific air mass type to a city daily.
The SSC is comprised of six air mass classification types; Moist Tropical (MT), Moist Moderate (MM), Moist Polar (MP), Dry Tropical (DT), Dry Moderate (DM), and Dry Polar (DP) [23]. In addition, the SSC includes a Transitional air mass classification (TR). There are specific meteorological conditions that are characteristic of each air mass. The MT denotes conditions that are typically associated with southerly flow and the advection of warm moist air. The MM type is characteristic of air that is humid and relatively mild with respect to temperature. The MP type is characteristic of cool, humid air that is often associated with systems including the Aleutian and Icelandic Lows. Similar to the classic cT air mass classification, DT air masses are associated with “dry heat” and are characterized by high temperatures and large dew point depressions at the surface [23]. When this DT air mass type advects northward, it often experiences cooling and the result is the DM air mass type. Another dry variety air mass is the DP type. This air mass type is associated with cold, arid air that is often associated with Arctic high pressure systems. The TR air mass classification is assigned when the prevalent weather conditions are changing due to a cold frontal passage or other synoptic feature [23].
Current research has used the SSC to investigate a variety of meteorological, climatological and even health issues. The diverse applications indicate that the SSC is both convenient and applicable in a variety of atmospheric science analyses. For instance, reference [24] used the SSC to help identify days in which significant snow cover ablation was observed in the Central Appalachians. Reference [25] used the SSC to identify a relationship between particular air mass types and the number of emergency room visits for individuals suffering from asthma or other respiratory illnesses in North Carolina. Reference [26] incorporated the SSC into an investigation of the climatology of the TR air mass type in the winter season.
2. Methods and Analysis
Air mass data for stations across the region are acquired from the Spatial Synoptic Classification (SSC) [23]. The physical boundaries of the Northeast region are defined with latitude and longitude criteria as 38˚N - 45˚N and 69˚W - 82.5˚W. Station latitude and longitude identifiers are obtained from the National Climatic Data Center (NCDC) and Environment Canada’s National Climate Data and Information Archive [27,28]. Stations with greater than 90% complete daily records from 1950-2010 are selected for analysis. Two exceptions are made to achieve a cohesive spatial coverage in central PA. These stations include Harrisburg and Williamsport, PA (80.3% and 88.9% complete records, respectively). Further, in an instance with two stations situated very close together (as found with New York City’s JFK and LaGuardia) the station with the most complete record is chosen. With these requirements 33 high-quality stations represent the Northeast region in this analysis (Figure 1). Given the confines, the region mostly includes United States stations though the two Canadian stations within the limits are also included for a robust set of stations with cohesive spatial coverage.
2.1. Annual and Seasonal Baseline Frequencies
Annual baselines are established for each station in the study region between 1 January 1950 and 31 December 2010. The percent frequency is calculated as the number of days classed in each air mass type compared to the total number of days on record. The baselines established are used to identify the air masses that are dominant at each station in the Northeast region through time. Since

Figure 1. Northeast region stations.
the region is known to exhibit high seasonality the seasonal air mass frequencies should differ from the annual frequencies obtained. Therefore, a seasonal frequency analysis is also conducted as a second baseline. In doing so, the air masses uniquely characteristic of the spring season at each station can be identified through time. Important air masses across the region are those with large frequencies at all stations in the region. Figure 2 displays an example for Newark, NJ where the DM, DP and MM are the most prominent springtime air masses. The most infrequent types are the warm DT and MT varieties at this station. Annual and seasonal frequencies are then compared to find the air masses most influential during the spring season. Differences are calculated between the baseline mean frequencies and statistically significant departures at the 95% and 99% confidence levels are identified with a two sample test of two proportions. At times, practically significant differences are also highlighted as those with meaning not captured in the statistical analysis.
2.2. Early and Late Record Frequencies
Changes in the air mass signatures of the Northeast spring season over time are examined. Considering suggestions of reference [8], the springtime period of record is divided into “Early” and “Late” intervals around the year 1975. This year is defined as a marker for the general start of atmospheric variable responses, like temperature and precipitation, to the global change signal. In this analysis the Early and Late periods are represented by the years 1950-1975 and 1976-2010, respectively. Then, the percent frequencies of all air masses are obtained for the Early and Late periods (Figure 3). To identify significant deviations from the long-term record, the differences between the Early and Late period frequencies and seasonal baseline frequencies are calculated and tested for statistical significance. Next, the air mass types most prevalent within each period and those with the most significant departures from the long-term record are assessed. The spatial cohesion of regional findings is also evaluated. These characteristic weather conditions provide insight
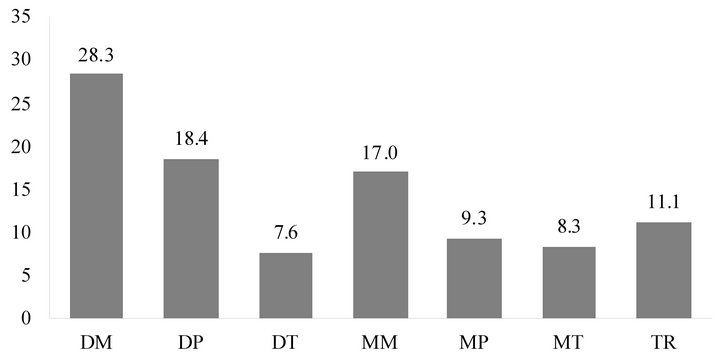
Figure 2. 1950-2010 Newark, NJ spring air mass frequency (%).
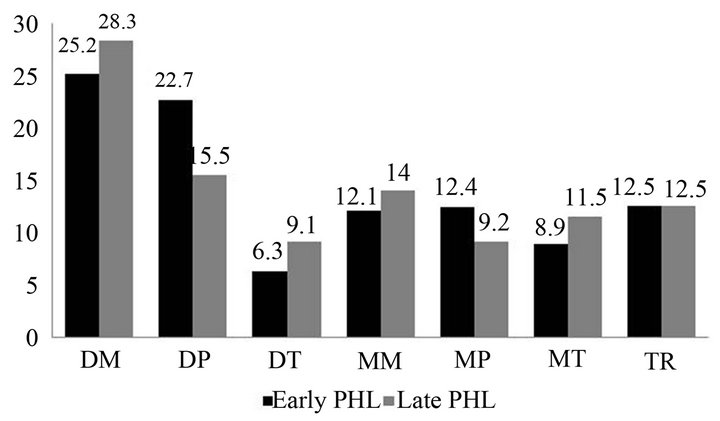
Figure 3. 1950-1975 (black) and 1976-2010 (gray) Philadelphia, PA spring air mass frequency (%).
into the extent that the Northeast spring seasons have changed in the past 60 years. For example, if springs of the past (prior to 1975) do not deviate much from recent springs (since 1976) then small, insignificant differences between the Early and Late records are expected. However, if the spring seasons are changing, perhaps as a product of global change, then the differences are anticipated to be substantial. The global warming signal may also be indicative of more frequent tropical and moderate air masses and less frequent polar air masses in the Late period.
2.3. Seasonal Boundary Frequencies
The final portion of this analysis is aimed at determining whether the initialization and termination of Northeast region springs have changed, perhaps with temporal shifts, over the past several decades. These shifts can represent anything from earlier spring onsets and longer springs to earlier summer onsets and shorter springs. Air mass frequencies are analyzed here for practically and statistically significant departures across only the start and end of the spring season. These differences are compared for periods around the year 1975.
The days prior to and following the established start date of 1 March and end date of 31 May are assessed as 15 February-15 March (“Start” of spring) and 15 May-15 June (“End” of spring). To see if Early record air mass frequencies within these boundaries vary from those of the Late record, two unique frequency sets are acquired for each half of the period of record (Sets 1 and 2, respectively). In each set, the “Start” and “End” periods are given an “A” and “B” designation. For example, Set 1A represents the air mass frequencies for the years 1950- 1975 between 15 February and 15 March. Set 1B represents 1950-1975 frequencies between 15 May and 15 June. Set 2A depicts frequencies for 1976-2010 between 15 February and 15 March. Set 2B are frequencies for 1976-2010 between 15 May and 15 June. The sets are compared to identify any prominent air mass changes that may indicate the season is shifting. This was achieved by finding the differences of Set 2A-1A and 2B-1B. Set A departures highlight synoptic changes in the initiation of spring whereas Set B departures show synoptic changes at season’s end. If no temporal shift is occurring at the oncoming of spring it is expected that the frequencies for Sets 1 and 2 will be similar. However, if the beginning or ending of the seasonal frequencies are markedly different in Sets 1 and 2, then it may be that the timing of the spring season is dissimilar. Figure 4 shows the four sets obtained at the Wilkes-Barre Scranton, PA station. Sets 1A and 1B represent air mass frequencies for the beginning and end of spring, respectively in the Early record. Sets 2A and 2B are frequencies obtained for the Late record.
3. Results
3.1. Annual and Seasonal Baselines
The DM is the most common weather type across the Northeast with 18% - 30% of the annual total. North and west stations generally have fewer and east locations have more (Figure 5). DM is also the most frequent in spring with 15% - 30% frequency. DP is the second most frequent type throughout the year with frequencies of 17% - 27% annually. DP air masses remain dominant in spring with frequencies between 18% - 29%. Southern stations have fewer DP days than northern stations. These results provide evidence for an annually dry Northeast over the past 50 years. The two air masses alone account for nearly half of all spring air mass days in the Northeast. This is surprising since the region lies between major moisture sources and spring is popularly considered a wet season with “April showers”.
MM is often the third most frequent air mass annually (13% - 19% mean frequency) with higher values north and nearest the Great Lakes and Atlantic Ocean. MM air masses range from 9% - 13% in the spring season with more near water sources. Annually and seasonally MP frequencies resemble that of the MM air mass but with greater variability across the region. Annually, eastern station frequencies range from 6% - 10% while the west frequencies are 12% - 20%. In spring, at some western locations MP days represent 24% of the total air mass days. More moderate and cool air mass types than warm, tropical types (DT and MT) makes sense given the northern latitude situation of the region and that many modifications are possible between air mass origins and the Northeast.
MT frequencies are between 6% -16% annually and 2% - 14% in spring. Though relatively infrequent, this type is more common in the south. The TR air mass has high spatial cohesion across the Northeast, with annual frequencies from 9% - 12% and spring frequencies of
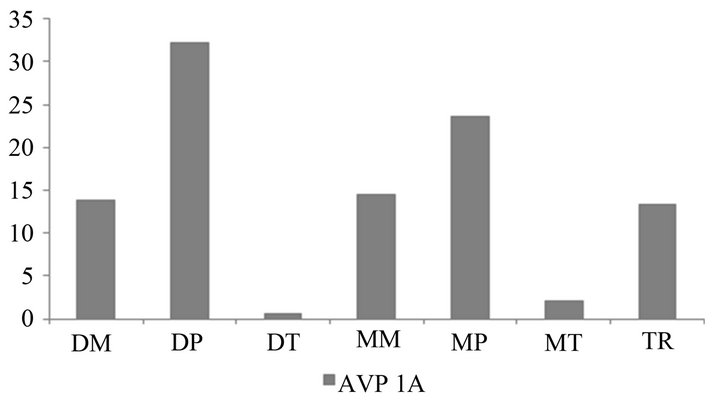
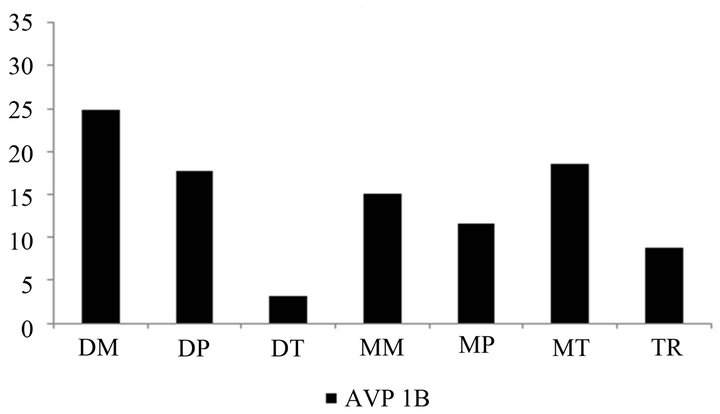
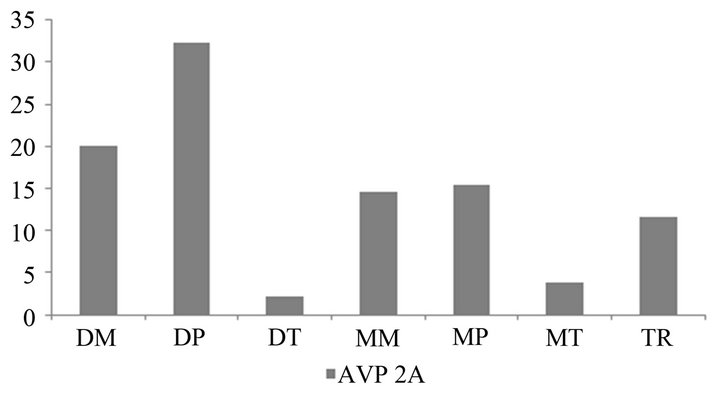
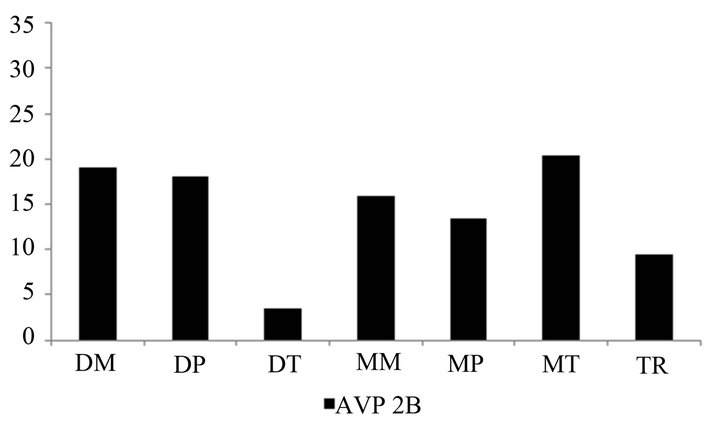
Figure 4. Wilkes-Barre—Scranton, PA spring air mass frequency (%) for days representing the: 1950-1975 start of spring, 1950-1975 end of spring, 1976-2010 start of spring, and 1976-2010 end of spring (top to bottom).
10% - 14% at all locations. The least frequent air mass annually is DT (1% - 6%). Like MT, more are detected at southeastern stations. In spring DT air mass ranges are slightly higher, from 1% - 8%. Fewer DT days than other types is likely attributed to modifications to less pure air
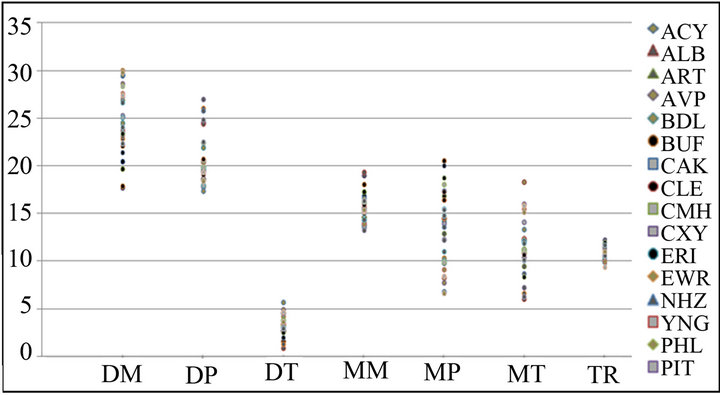
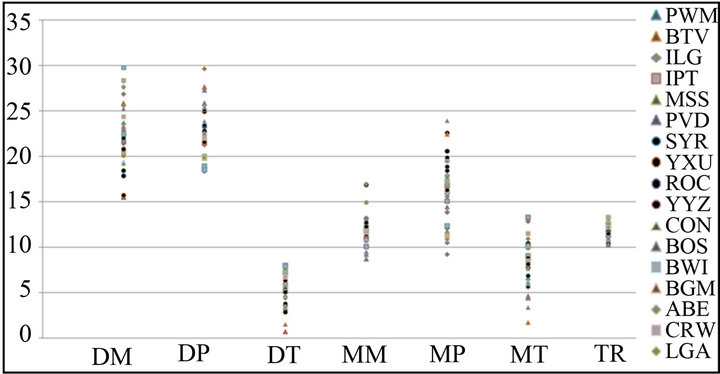
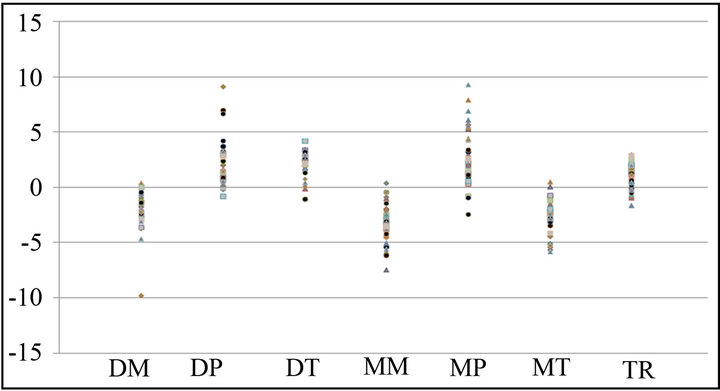
Figure 5. 1950-2010 Northeast annual (top) and spring (middle) air mass frequency (%). Differences between annual and spring baseline frequencies are also shown (bottom). Note: The station key that spans the top two figures should be referenced in all figures to follow.
as it traverses the country toward the region.
Baseline Departures
Differences between the seasonal and annual baselines indicate the region has 0% - 5% fewer DM days in spring (see Figure 5). This decrease is less apparent in the north and more pronounced in southern areas. For 20 stations, these departures are statistically significant at the 95% and 99% confidence level. Conversely, DP exhibits a 0% - 4% increase in springtime frequency with larger increases in the region’s north and west (18 stations exhibiting statistically significant departures). Another dry variety, the DT, also displays a statistically significant increase of 0% - 4% from the annual baseline at 29 stations. This departure is logical considering the influx of warm air in these months. Southern stations exhibit greater increases in DT.
Spring MM frequencies decrease by 0% - 8% from the annual baseline with larger decreases in the north and west. At 29 stations these departures are statistically significant at the levels tested. There is less spatial cohesion in MP tendencies throughout the region. Stations in the north and west experience a 1% - 2% decrease while most other locales have a statistically significant increase of 0% - 8%. Throughout the region, MT exhibits a significant decrease in spring prevalence of 0% - 6% from the annual baseline. This departure is lower at western stations. The TR air mass increases by 0% - 3% from the annual tendency in southern stations and a decrease of 1% - 2% at northern stations is detected.
These synoptic air mass departures indicate that the spring season in the Northeast is notably drier than the rest of the year. The majority of dry air masses increase in spring and every moist type experiences decreases (with some coastal station exceptions). Regardless of the thermal character of Northeast region air, the moist weather types are replaced by dry types in spring. It is worth noting that MP increases along the coast may be explained by the Atlantic retaining fairly cool winter properties relative to the region’s interior. This could cause coastal sites to be more influenced by moist, polar air. Since spring is the temporal transition from winter to summer it is interesting that both moderate air mass types are less prevalent in spring. This finding likely means that more pure types are moving in and out of the region and less modified air is present in this season.
3.2. Early and Late Records
3.2.1. Early Record: 1950-1975
In the Early record DM, DP and MP are the most prevalent varieties identified across the region. DM mean frequency is chiefly between 16% - 29%, while the DP air mass is slightly more prominent (18% - 29% frequency) (Figure 6). Fewer cold DP air mass days occur in the south and more DP days are present in the north. The prominence of the DM type, a relatively common air mass at all times in the Northeast region, is not surprising. Finding a large number of DM days in the Early record emphasizes the relatively dry and mild conditions that have prevailed here. With the high number of DP days, it can be seen that the springs of 1950-1975 were not considerably moist seasons.
MP days represent 11% - 26% of the days in the Early record. Though MP is a rare air mass at southern locations, frequencies are higher for this moist air mass at stations near the Atlantic coast and Great Lakes. The MM air mass frequency generally ranges from 8% - 18% (with typically higher values north and near the lakes) and the other moist variety, MT, has less prominence in the region with 2% - 15% frequency in the Early record. The upper limit values represent the southeastern region
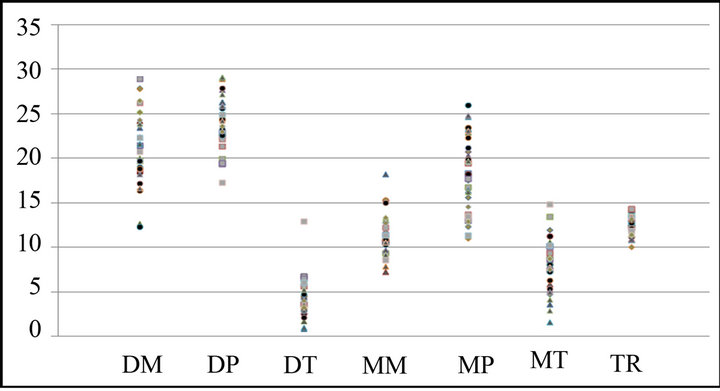
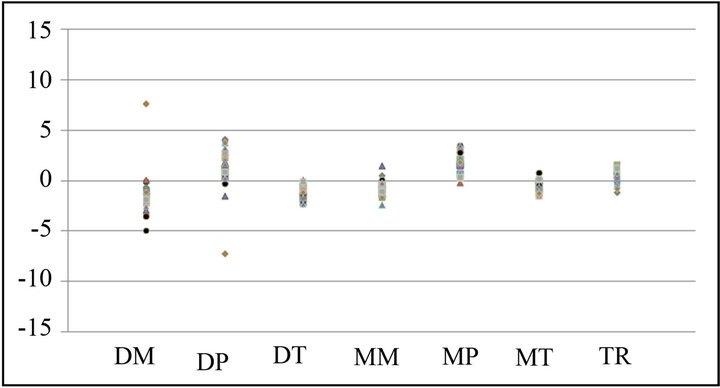
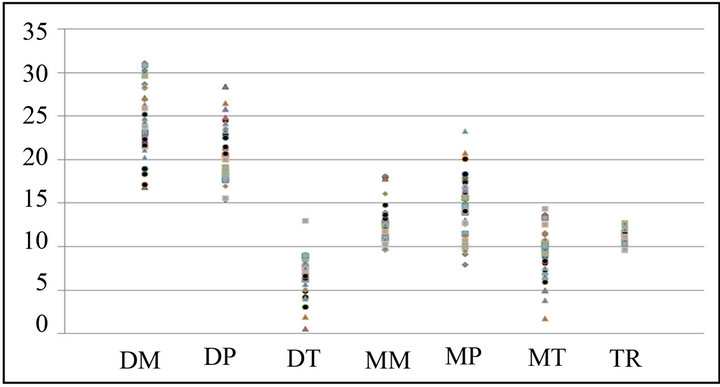
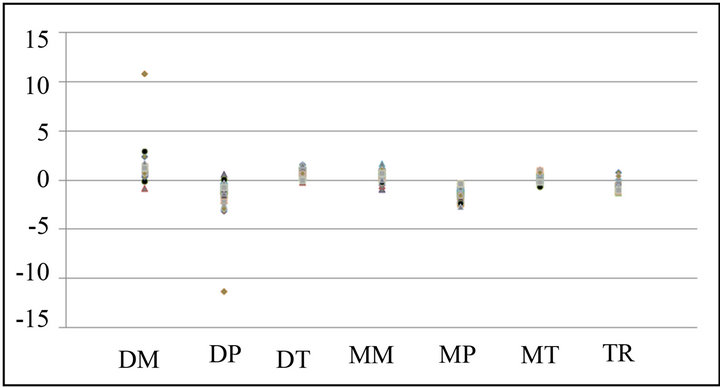
Figure 6. Northeast spring air mass frequency and frequency departures (%) for the: Early record, Early record minus Baseline, Late record, and Late record minus Baseline (top to bottom).
stations. Though more present across the southern tier, the warm DT is the least frequent weather type over the 25 year period (mainly 2% - 7% mean frequency) and TR is also relatively infrequent (10% -14%).
With the high number of DP and MP types (the coolest air masses identified in the SSC) the character of the Early record seasons, other than being relatively dry, is developed. In connection with so few DT and MT days, these findings indicate that the Early record spring season was undeniably cool and perhaps resembled the winter season more than those of modern times.
3.2.2. Late Record: 1976-2010
For the Late period, DM is again the most frequent air mass. Lower frequencies are detected in the north and west of the region and higher values in the south and east. DM days account for 17% - 31% of all springtime air masses in this period (see Figure 6). The second most frequent variety is the cool DP (15% - 29% of all air mass days with higher values in the north and lower values south and east). The MM and MP moist types account for generally 9% - 18% and 9% - 21%, respecttively, of all spring days here. Both the MM and MP have slightly higher frequencies at coastal locations and generally decreased total frequencies inland. This finding makes sense given proximity to moisture sources. For the entire region, the TR air mass has consistent frequencies and high spatial cohesion among the stations (9% - 13% of all air mass days across the late record). The two least frequent air masses found in the late period are the warm DT and MT. MT days represent 2% - 14% of all Late record days, with lower frequencies observed in the north (e.g., Portland, ME accounted for only 1.8%) and higher frequencies in the southeast (e.g., Charleston’s 14.5% MT frequency). The warm DT air mass generally makes up 1% - 8% of all air masses here. Not surprisingly, higher DT values are detected in the southeast and lower values in the north (e.g., Brunswick, ME has 0.7% frequency).
The Late record findings show that the DM and the DP are still the most prominent air mass types, consistent with the notion that Northeast springs tend to be dry. Results also indicate that warmer temperatures may have been experienced in modern springs. This can be seen with the slightly higher percentage of moderate and tropical air mass types (mild to hot varieties, respectively).
3.2.3. Early and Late Record Departures
In the Early record, a decrease of 0% - 4% in DM air mass frequency is detected at most stations, representing somewhat fewer DM days in spring between 1950 and 1975 compared to the number identified in springs across the period of record (see Figure 6). While 11 of these station departures are statistically significant, this finding has less practical significance since so many DM days are identified in both periods and the departures are small. Generally, there are also fewer DT days in the Early record (0% - 2%, with 23 statistically significant station departures), fewer MT days (0% - 1%, with 3 significant departures) and fewer MM days (0% - 2% with 4 significant differences detected).
The DP and MP air masses are more frequent in the Early record (both with around 1% - 4% increases). Ten stations have statistically significant departures in DP while only 3 exhibit significant MP differences. The TR air mass departures vary from station to station, with some stations exhibiting increases and some experienceing decreases, all with a magnitude of −1% - 1% change.
The notable decreases in tropical varieties alongside increases in polar varieties indicate that the Early record is indeed marked by cooler springtime conditions. The strong departure of the DT is important since so few of these types are present in Spring to begin with. In other words, a decrease of 2% is substantial if only 4% occur in the baseline.
The Late record differences are generally opposite to those of the Early record findings (see Figure 6). All moderate and tropical varieties are more prominent in modern springs. Positive station departures are detected in this period for the DM (1% - 3%, with 6 statistically significant differences), DT (0% - 3%, with 16 significant findings), MM (−1% - 2%, with 3 stations exhibiting significant differences) and MT (0% - 1%, with 2 stations exhibiting significant departures).
The prominent moderate and tropical air masses replace the cold, polar types that were more dominant in past springs (e.g., the Early record) regardless of the moisture properties. Decreases in the cold DP frequency of 0% - 4% and MP of 0% - 3% are uncovered. Nine stations exhibit statistically significant departures in DP while 15 exhibit significance for MP. The differences in TR air mass are similar to the Early record and vary by station.
Both the Early and Late record periods are relatively dry as they are dominated by the DM and the DP. By comparison, the departures identified document strong evidence that springs from 1950-1975 were cooler than springs following 1975 and that the spring season has warmed with time, perhaps taking on more summer season characteristics.
3.3. Early Spring: 15 Feb-15 Mar
3.3.1. Early Record: 1950-1975
Set 1A days are assessed to highlight the synoptic conditions at the beginning of the spring season in past decades. The results show the two most frequent air masses across the region at all stations are the cool DP and MP types (Figure 7). The DP frequency range is 21% - 40%, with lower values in the southeast and west parts of the region. The range of MP frequency is large, 12% - 35%. The upper values tend to represent western stations while lower frequencies are identified in the southeast. The high total of both polar air mass varieties supports the notion that decades ago the transition to spring was cool in the Northeast region and probably the character of the air at this time remained like that of the winter.
In set 1A the DM is the third most frequent weather type (generally 11% - 26% frequency) with lower values found in the north and west. Though the finding is not intuitive, DM is most prevalent at coastal locations. More logical given the transition from winter, DT remains relatively infrequent in late February and early March (0 to 3%). A few exceptions exist in the southern reaches with a maximum frequency of 7.9% found in Charleston, WV. MT is also a rare air mass here with a range of 1% - 7% across the region. A noteworthy exception of 10.1% is detected in Charleston, WV. The MM air mass tends to situate in the middle of the total frequency ranges, with around 8% - 20% frequency. Though the moderate and tropical air masses are certainly present, these varieties take a back seat to the cool types which may show that the warmth associated with spring seasons did not arrive until after March 15 in these years. The TR air mass ex-
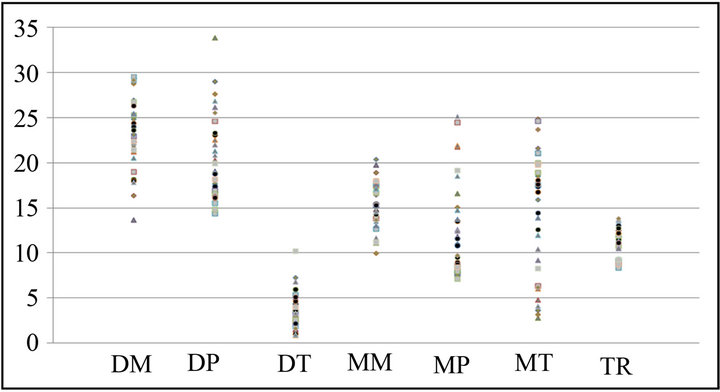
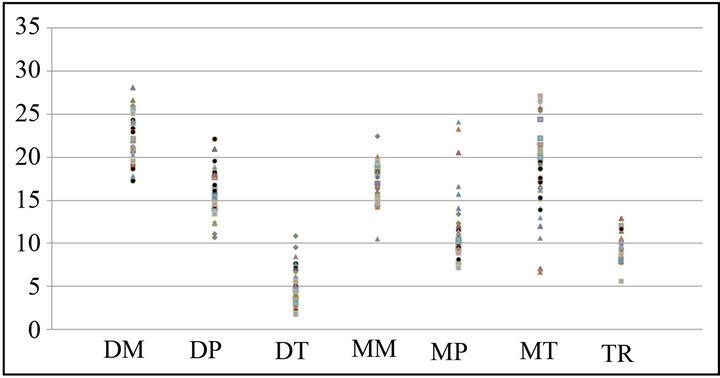
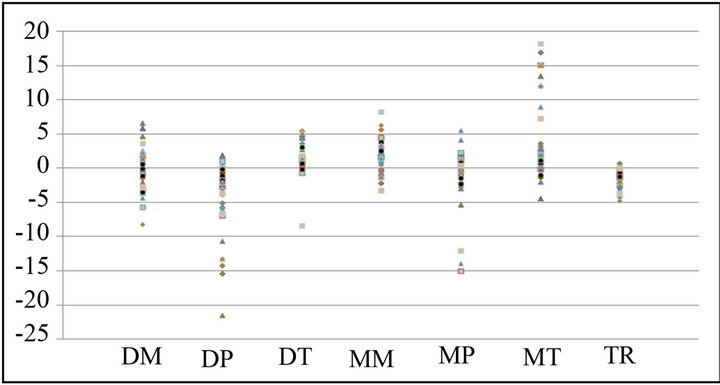
Figure 7. 15 February-15 March air mass frequency (%) for the Early record (1A) , Late record (2A) and Early minus Late record departures (2A-1A) (top to bottom).
hibited a range of 9% - 16%.
3.3.2. Late Record: 1976-2010
Set 2A days are examined to understand the synoptic conditions at the beginning of the spring season in recent decades. Here, the onset of spring is marked by a large presence of the cool, dry DP air mass (see Figure 7). It is the most dominant air mass with frequencies up to 41% across the region. The warmer DM air mass is less frequent at this time of year, particularly at northeastern stations, making up 11% - 18% of the total air mass frequency. Not surprisingly, this mild and dry air mass is more prominent in the Southeast. The TR air mass frequency in this interval matched that of the Early record (10% - 15%).
A wide range of moist air mass frequencies are found across the region in early spring. The ranges are all greater than those detected for the same 30 day period in the Early record. The MM dominates 10% - 20% of the time. The MT exhibited a much wider range in frequency tendency across the region with 0% - 27% of the total days. This is a substantial increase from that detected across the Northeast in the Early record. The cool, moist MP also displays a large range, like that of the Early record with 6% - 28% of the days recorded as this air mass type. There is also a rather high range in DT air mass days (0% - 7% of the total air mass days). No spatial cohesion related to the distribution of these frequencies across the region could be detected.
Like the Early record, the Late record indicates that the beginning of spring exhibits characteristically cool conditions, as seen with the high number of DP and MP air mass days. In addition, there appears to be little consistency in the number of moist air mass types experienced across the region. The range of these varieties (warm, moderate and cool) is substantial. While some Northeast stations only receive the MT air mass 4% of the time, others experience this type more frequently and this is not explained by obvious, intuitive north-south distinctions. This indicates that the onset of spring in the Northeast is quite complex and that thermal changes are only one flux experienced as the season initiates.
3.3.3. Early Season Spring Departures
For days representing spring onset, the set 2A-1A differences are examined to see if the synoptic signatures of the periods are distinct. If so, the unique characteristics in the Late record may indicate whether or not the season is starting earlier than in previous decades. The findings of this research support that notion since the Early record is synoptically colder than the Late record (see Figure 7). The largest statistically significant departures found (at 25 stations) are for the MP air mass with a decrease of 0% - 22%. This means fewer MP days are present in the Late record than in the Early record. Although this type has the largest differences detected, there is low spatial cohesion across the region. DP also decreases at some locations, from 0% - 15%. Eight stations exhibit a statistically significant departure in this variety. However, at around half of these stations DP tends to increases from 0% - 5%.
Set 2A-1A data mainly show an increase in tropical and moderate air masses indicating warmer types are more prevalent in the Late record at the beginning of spring. First, there is a general increase in the DT air mass of 0% - 4%, with 24 stations showing statistical significance. Small, insignificant negative departures are also detected for this type. The MT also has a general increase of 0% - 3% with exceptions of 11% - 18% even detected throughout the region (with 14 statistically significant station departures). The MM air mass has both a decrease of 0% - 4% and an increase of 0% - 8%. Even though it exhibits both increases and decreases there is low spatial consistency about where that happens. DM also shows both increases and decreases but it has a general increase of 1% - 8% (and 16 significant station differences) and few decreases across the region. The TR air mass typically decreased from 0% - 5%.
These differences show that the Early record was synoptically cooler than the Late record for the onset of spring. The large decrease in the MP and even DP air masses indicates that cold types are being replaced by moderate and tropical air masses in modern times which display increases. There are small increases in the moist air masses but the most significant change is thermally. Thermal changes in dominant air masses can further mean that the onset of spring in the Northeast is arriving earlier in the Late record compared to the Early record.
3.4. Late Spring: 15 May-15 Jun
3.4.1. Early Record: 1950-1975
Set 1B days are assessed to pinpoint the synoptic conditions at the end of the spring season in past decades. Results indicate that the DP and DM are the two most frequent air masses in this period with 14% - 34% and 13% - 30% frequency, respectively (Figure 8). DP is generally less prevalent further from the interior Canadian source, at southern stations, and more dominant in the north and along the coast. Western and coastal areas tend to record fewer total DM days. Little spatial cohesion is noticed for the MM, MP and MT types despite considerable variability in frequency at this time of year. The only spatial relationship observed makes sense in that locations nearest a water body tend to have more moist air masses. MM days represent 10% - 21% of all the late season days in the Early record. MP represents 7% - 25% of these days and MT days have frequency ranges of 3% - 25%.
A range of 1% - 7% of DT days are identified for this period in the Northeast, making DT the least frequent air mass in the region. Finally, TR air masses account for 7% - 14% of total days in this record which is near the findings of all other analyses conducted.
Finding many dry types here is consistent with results from previous sections indicating that spring is dry. Fewer DT air masses may mean that warmer conditions were less prominent at the season’s termination decades ago. The large range of moist air mass tendencies indicates that there are as many cold, moist types as warm, moist types at the end of the Early record seasons (even if this varies greatly from station to station). The time of year does not seem to greatly influence the thermal nature of prominent air masses.
3.4.2. Late Record: 1976-2010
Set 2B days are markers of the synoptic conditions at the end of the spring season in recent decades. DM and MT days are the most common at this time in the Late record. DM frequency ranges from 17% - 28% (lower values are focused at western region stations and higher values along the coast) (see Figure 8). The MT air mass, which also exhibits the largest variability range, makes up 6% - 27% of all days. The lowest values are observed in areas to the north and highest values are at stations to the south and near the coast.
The DP air mass is slightly less frequent (11% - 23% of all air mass days in this period). The other dry air mass, DT, is the most prominent of any other interval examined with 2% - 11% which represents many more DT days than detected at the end of spring prior to 1976.
As found with set 1B, the MM and MP air mass frequency in this period is variable, from around 11% - 23% and 7% - 24%, respectively. Finally, the TR air mass has the same relative range as detected in earlier periods.
Overall, this period is one with low regional cohesion among air mass occurrence. A number of the air masses examined are present with great variability across the Northeast and some locations have springtime frequencies well beyond the tendency of the majority. The end of spring in recent decades appears to be notably warm and dry, as evidenced with the most dominant air masses. The prominence of the DT and MT types at southern stations may indicate that the period is no longer representing the end of spring but the onset of the summer season. At this time, it is likely that tropical air masses are advecting from the southeastern US and perhaps the southern locations of the Northeast region experience the earliest arrival of summer.
3.4.3. Late Season Spring Departures
The 2B-1B difference results depict changes at the termi-
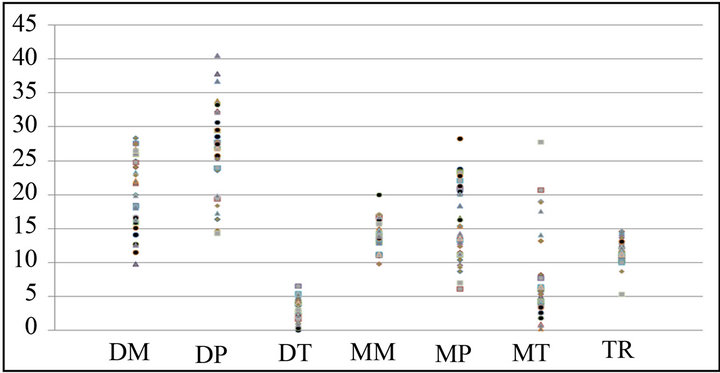
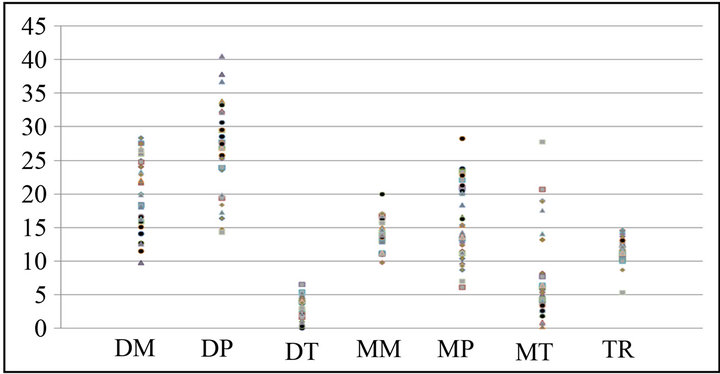
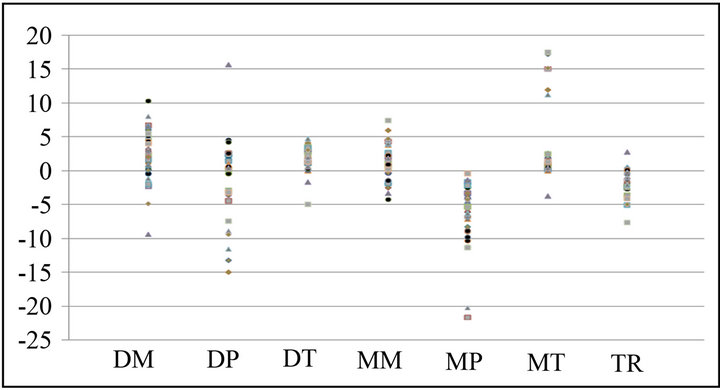
Figure 8. 15 May-15 June air mass frequency (%) for the Early record (1B) , Late record (2B) and Early minus Late record departures (2B-1B) (top to bottom).
nation of spring across the first and second half of the record examined. DT days are 0% - 5% more common in the Late record. This small value change is nevertheless a statistically significant departure for 13 stations. The more dominant MT days are represented with a 0 to as much as 19% increase in frequency (with 11 stations showing significance). A few stations demonstrate a very modest, 0% - 4%, and insignificant decrease in MT frequency.
Little overall change with DM air masses is observed since stations experience departures on the order of −6% - 6% between the two records (see Figure 8). Less change is also noticed for MM air mass days, demonstrated by station frequency departures of −4% - 8%. The TR days are generally 0% - 5% less frequent in the Late record than discovered in the Early record. For each of these air masses seven stations displayed significant departures with random spatial coverage.
Another important finding of the Late record end of spring comes with large regional declines in the cold DP and MP air masses. DP days are from 0% - 22% less frequent in the Late record. Approximately half of these stations exhibited statistical significance, generally those with higher differences. In late May and early June, MP types are also significantly less prevalent in modern times. Although some stations show a 0% - 5% increase in MP days, most have a 0% - 15% decrease.
These findings give good indication that warmer air is arriving in the northeastern US earlier than it used to. While the spring termination of previous decades contained a mix of warm and cool air masses, the prominent decrease in cool varieties and increase in warm types provides substantial support that the end of spring has changed since 1975. This may mean that the spring warmth lasts longer than it used to. This may also be a condition analogous to the earlier initiation of the summer season across the Northeast. It is likely that these air masses are more prominent in the summer season than in spring.
4. Conclusions and Future Research
There are multiple objectives to this research with the main goal being an attempt to find an air mass based description of the spring season. The important air mass types identified in both the annual and seasonal baseline analyses show that this is not only possible but that the DM and DP are the dominant air masses for the entire period of record. These important synoptic features of the season indicate that the Northeast is relatively dry at this time of year which is compelling because it contradicts the prevalent ideas depicted in New England lore about spring showers and the ferocity of early March weather.
Another aim of the research is to determine if spring characteristics have changed over the period of study and if the timing of spring onset has shifted since 1975. Unlike the baseline results, the examination of the Early and Late records provides a set of more expected results given the findings in Reference [8]. That research identifies 1975 as a year of marked change in meteorological variables. Therefore, it can be assumed that differences associated with climate change would be evident prior to and following this year. In the Northeast, Early and Late record results are consistent with the baseline analysis in terms of the lack of moisture seen in spring. The real differences across the decades appears to be associated with the thermal qualities of air masses. High frequencies of polar air mass types DP and MP are seen in the Early record which is indicative of cooler temperatures, whereas the Late record shows an increasing amount of all moderate and tropical air mass types which points to added regional warming.
With respect to the onset of spring, the early record displays polar air mass types making up the majority of days, a situation believed to be thermally similar to winter-like conditions. The Late record also appears to be cool, however an increase in the range of moist air mass dominance (particularly for MP) is noteworthy. This could mean that in recent times MP air masses are moving out and being replaced mostly by moderate and tropical types, indicating that warmer air is arriving sooner when compared to the early record.
For the termination of spring, a greater balance of warm and cool air mass types are observed. In comparing the differences between the Early and Late record season ends, it is found again that warmer air is arriving sooner due to the increase in MT and DT while polar types are decreasing. Overall, the Northeast spring, as defined synoptically by air masses, is consistently dry and the Late record shows that springs seem to be getting warmer since 1975 as well as possibly arriving earlier.
Both the region’s people and industries can benefit from a better understanding of the spring characteristics of the Northeast. Farmers may be able to more accurately select a time to begin planting to ensure optimal crop yield, tourist operations can maximize profits if the beginning of spring is more well defined, and forecasters could better recognize favorable conditions for the development of severe weather, thus ensuring the safety of people within each county warning area. A synoptic seasonal analysis has never before been attempted in this manner. This study shows that it can be done successfully and could be applied to other seasons for even more information about the role of air masses in seasonal variability and change. Worthwhile future pursuits should be aimed at verifying some of the temporal shifts mentioned in this research with an examination of air mass characteristics in winter and summer. This could only help to better identify the character of seasonal transitions. For example it would be advantageous to investigate if spring termination is occurring later, or if it is actually summer onset happening earlier.
5. Acknowledgements
The authors thank Danielle Browarski, Sarah Galligan, Kathleen Giacalone, Conor Jones, Thomas King, Daniel Linek, Alex Lyakhov, Seth Masten and Jonathan Visnosky for assistance with this analysis.
REFERENCES
- K. M. Simmons and D. Sutter, “The 2011 Tornadoes and the Future of Tornado Research,” Bulletin of the American Meteorological Society, Vol. 93, No. 7, 2012, pp. 2-11. doi:10.1175/BAMS-D-11-00126.1
- NOAA National Weather Service Storm Prediction Center, “Monthly and Seasonal US Tornado Summaries,” 2012. http://www.spc.noaa.gov/climo/online/monthly/newm.html
- C. D. Ahrens, “Essentials of Meteorology: An Invitation to the Atmosphere,” 6th Edition, Cengage Learning, 2012.
- F. K. Lutgens, E. J. Tarbuck and D. Tassa, “The Atmosphere: An Introduction to Meteorology,” 10th Edition, Prentice Hall, New York, 2006.
- NOAA National Weather Service Climate Prediction Center, “Global ENSO Temperature and Precipitation Linear Regressions,” 2013. http://www.cpc.ncep.noaa.gov/products/precip/CWlink/ENSO/regressions/
- D. E. Christiansen, “Impacts of Climate Change on the Growing Season in the United States,” Earth Interactions, Vol. 15, No. 33, 2011, pp. 1-17. doi:10.1175/2011EI376.1
- L. H. Lin, X. Huang and N.-C. Lau, “Winter-to-Spring Transition in East Asia: A Planetary-Scale Perspective of the South China Spring Rain Onset,” Journal of Climate, Vol. 21, 2008, pp. 3081-3096. doi:10.1175/2007JCLI1611.1
- R. E. Livezey, K. Y. Vinnikov, M. M. Timofeyeva, R. Tinker and H. M. Van Den Dool, “Estimation and Extrapolation of Climate Normals and Climatic Trends,” Journal of the American Meteorological Society, Vol. 46, 2007, pp. 1759-1776.
- United States Census Bureau, “United States Census 2010,” 2010. http://2010.census.gov/2010census
- Census of Canada, “2011 Census Population Counts,” 2012. http://www12.statcan.gc.ca/census-recensement/index-eng.cfm
- K. E. Trenberth, “What Are the Seasons?” Bulletin of the American Meteorological Society, Vol. 64, No. 11, 1983, pp. 1277-1282.
- T. R. Ault, A. K. Macalady, G. T. Pederson, J. L. Betancourt and M. D. Schwartz, “Northern Hemisphere Modes of Variability and the Timing of Spring in Western North America,” Journal of Climate, Vol. 24, 2011, pp. 4003- 4013. doi:10.1175/2011JCLI4069.1
- I. M. Tombre, et al., “The Onset of Spring and Timing of Migration in Two Arctic Nesting Goose Populations: The Pink-Footed Goose Anser bachyrhynchus and the Barnacle Goose Branta leucopsis,” Journal of Avian Biology, Vol. 39, No. 6, 2008, pp. 691-703. doi:10.1111/j.1600-048X.2008.04440.x
- D. Robson and C. Barriocanal, “Ecological Conditions in Wintering and Passage Areas as Determinants of Timing of Spring Migration in Trans-Saharan Migratory Birds,” Journal of Animal Ecology, Vol. 80, 2011, pp. 320-331. doi:10.1111/j.1365-2656.2010.01772.x
- T. L. Root, J. T. Price, K. R. Hall, S. H. Schneider, C. Rosenzweig and A. J. Pounds, “Fingerprints of Global Warming on Wild Animals and Plants,” Nature, Vol. 421, No. 6918, 2003, pp. 57-60. doi:10.1038/nature01333
- M. D. Schwartz and B. Reiter, “Changes in North American Spring,” International Journal of Climatology, Vol. 20, No. 8, 2000, pp. 929-932. doi:10.1002/1097-0088(20000630)20:8<929::AID-JOC557>3.0.CO;2-5
- D. R. Easterling, “Recent Changes in Frost Days and the Frost Free Season in the United States,” Bulletin of the American Meteorological Society, Vol. 83, No. 9, 2002, pp. 1327-1332.
- D. R. Warren, A. G. Ernst and B. P, Baldigo, “Influence of Spring Floods on Year-Class Strength of Fall and Spring-Spawning Salmonids in Catskill Mountain Streams,” Transactions of the American Fisheries Society, Vol. 138, 2009, pp. 200-210. doi:10.1577/T08-046.1
- D. A. Burns, J. Klaus and M. R. McHale, “Recent Climate Trends and Implications for Water Resources in the Catskill Mountain Region, New York, USA,” Journal of Hydrology, Vol. 336, 2007, pp. 155-170. doi:10.1016/j.jhydrol.2006.12.019
- T. P. Suro and G. D. Firda, “Flood of April 2-3, 2005, Esopus Creek Basin, New York,” US Geological Survey Open-File Report 2007-1036, 2006, p. 85.
- G. A. Hodgkins and I. C. James II, “Historical Ice-Out Dates for 29 Lakes,” US Geological Survey Open-File Report 02-34, 2002, pp. 1-32.
- T. Bergeron, “Über die Dreidimensional Verknüpfende Wetteranalyse, I. Tiel.,” Geofysiske Publikasjoner, Vol. 5, 1928, pp. 1-111.
- S. C. Sheridan, “The Redevelopment of a Weather-Type Classification Scheme for North America,” International Journal of Climatology, Vol. 22, 2002, pp. 51-68. doi:10.1002/joc.709
- D. J. Leathers, D. Graybeal, T. Mote, A. Grundstein and D. Robinson, “The Role of Airmass Types and Surface Energy Fluxes in Snow Cover Ablation in the Central Appalachians,” Journal of Applied Meteorology, Vol. 43, No. 12, 2004, pp. 1887-1898. doi:10.1175/JAM2172.1
- A. F. Hanna, et al., “Associations between Ozone and Morbidity Using the Spatial Synoptic Classification System,” Environmental Health, Vol. 10, No. 1, 2011, pp. 1-15. doi:10.1186/1476-069X-10-49
- D. M. Hondula and R. E. Davis, “Climatology on Winter Transition Days for the Contiguous USA, 1951-2007,” Theoretical and Applied Climatology, Vol. 103, No. 1-2, 2010, pp. 27-37. doi:10.1007/s00704-010-0278-7
- NOAA National Climatic Data Center, “Historical Observing Metadata Repository,” 2012. http://www.ncdc.noaa.gov/homr/
- Environment Canada, “National Climate Data and Information Archive,” 2012. http://climate.weatheroffice.gc.ca/Welcome_e.htm