Agricultural Sciences
Vol.3 No.3(2012), Article ID:19044,10 pages DOI:10.4236/as.2012.33051
Relationship between cation exchange capacity and the saline phase of Cheliff sol
![]()
Biology Department, Faculty of Science, Hassiba Ben Bouali University, Chlef, Algeria; djamal_saidi@yahoo.fr
Received 14 January 2012; revised 25 February 2012; accepted 7 March 2012
Keywords: CECMetson; CECe; Salinity Index; Salinity; Sodicity; Physical Properties
ABSTRACT
T Measurements of the cation exchange capacity (CEC) show significant soil properties, in particular its ability to retain the cations because of their mobility in the soil. Thirteen soil samples rich in electrolytes of the Cheliff plain (Algeria) were analyzed in order to measure their CEC and to draw up the existing relationship between texture, organic matter content and pH. In calcareous soils, the CECe values are always higher than those measured at pH 7. Regression equations using the percentages of organic carbon and clay as independent variables would make it possible to estimate 90% of the variability of the CEC measured in the ammonium acetate buffered at pH 7 and 89% of the variability for that measured at the pH of the soil. These percentages are particularly useful due to the fact that they make it possible to estimate the CEC of the soil according to the pH only starting from the organic matter and texture. The correlations between the salinity indices, the parameters of the saline phase and the physical properties, show that the cobalt-hexamine method makes it possible to characterize the soil of this plain with more precision than the Metson method. It constitutes a means for following-up the chemical quality of the soil. The Metson method makes it possible to approach the reactivity of the soil in relation with the geometry of the components. The measurement of the CEC at pH 7 makes it possible to envisage the water content at the permanent wilting point of the plants. Finally, it is noticed that a sodisation of the adsorbing compound, which consequently generates a reduction in the structural stability and a reduction in the infiltration always leads to the salinity in these soil types.
1. INTRODUCTION
Currently, it is known that the reaction of a saline soil depends upon the amount and the nature of the clay fraction as well as the salinity level and the nature of the common cations and anions in the soil solution [1-6]. The fine clay fraction essentially ensures the regulation of the physicochemical phenomena. This fraction plays an important role not only in the water retention and the soil structure, but also in the retention and the bioavailability of the nutrient elements that are essential to plants. The surface properties of the soil components can be characterized using two types of data, namely the cation exchange capacity (CEC) and the specific surface of the clay fraction (SS). Generally, the total surface is determined using a strongly adsorbed, polar organic molecule such as ethylene glycol monoethylether (EGME) [7]. The cation exchange capacity of a soil measures the surface electric charge of soil components [8,9]. Both CEC and specific surface of the soil were used as a predicting criteria tool to evaluate the properties of the soil components. The water retention to clays is closely related to the cation exchange capacity and specific surface [6,10] showed that the cation exchange capacity was a good estimate of the water properties in the clay horizons of low organic matter content. The CEC measurement has to be done at a specific soil solution pH in order to avoid the variable charges due to the change in soil pH [9]. In the usual methods, the CEC is measured at pH = 7 (Metson method) for the lightly acid or neutral soils and at pH = 8.2 (Bower method) for the alkaline soils. Furthermore, in the presence of differently soluble salts, these methods seem not to be accurate. Under salinity onditions, it is difficult to make a monoionic absorbent on the soil material [8,11].
The objective of the present investigation is to compare the results obtained using two standardized methods of the cation exchange capacity (CEC) and their importance in the calcareous, saline soils of Cheliff plain area, north Algeria, which have clay loam texture. The relationships between the CEC and the salinity, the sodicity and some physical properties of the soils will be also evaluated.
2. MATERIALS AND METHODS
2.1. Study Area
The study was conducted in the Mina area (lat. 36˚10'N, long. 00˚30' & 1˚20'E) of Algerian lower Cheliff Valley (Figure 1). The specific climate is semi-arid where the summer is very hot and the winter is cold. The mean annual rainfall in this area is 350 mm and the mean annual temperature is 18˚C with only some major fluctuations through the year. The altitude at this plain is about 70 m above the sea level and the parent material of the soil is alluvium. The studied soils are pedologically young and developed from rich clay calcareous material [12-14]. Soil particles that have a diameter < 2 µm are mainly illites accompanied with a mixture of clay minerals of smectite, kaolinite and of chlorite [15].
2.2. Soils Samples
Soil samples were collected from the upper layer of the Mina fields, Algerian Cheliff plain. Thirteen samples were taken from the surface horizon (0 - 30 cm) of each cultivated soil and analyzed using the standardized methods. The granulometric analysis was carried out without decalcification after the dispersion with sodium hexametaphosphate. The percentage of organic carbon is given according to the Anne method; the pH of the soil is measured in a 1:2.5 of soil to water suspension. Total calcium carbonate is obtained by a volumetric calcimeter of Bernard. The specific surface was measured using ethylene glycol mono ethylether (EGME), according to the protocol developed by [7]. Both cation exchange capacity and the cation exchange extraction were determined in an accredited analysis laboratory of INRA, Arras, France at its usual soil pH and using cobalt hexamine (Cohex) trichloride, [Co(NH3)6]Cl3 as an exchange solution [8] and at pH 7 using ammonium acetate as an exchange solution, which was proposed by [16]. These two methods are standardized [17].
2.3. Water Retention
The determination of water retention was related to the fragments size (5 - 10 cm3). The apparent density of the fragments was measured using a petrol method [17,18]. Six water contents were used as metric potential values of –10 kPa (PF = 1), –330 kPa (pF = 2.5), –1000 kPa (pF = 3.0), –3300 kPa (pF = 3.5), –10000 kPa (pF = 4.0), and –15000 kPa (pF = 4.2). Then measurements were carried out using pneumatic devices. This device makes that it is possible to put at balance 30 to 40 bounds on the balance at the same time in only one cell [19]. The water content is measured after 7 days of the setting to the balance at the selected pressure and then, the cell content is ovendried at 105˚C for at least 24 hours.
2.4. Structural Stability
The aggregate stability was measured on a diameter of 3 - 5 mm aggregates according to the method proposed by
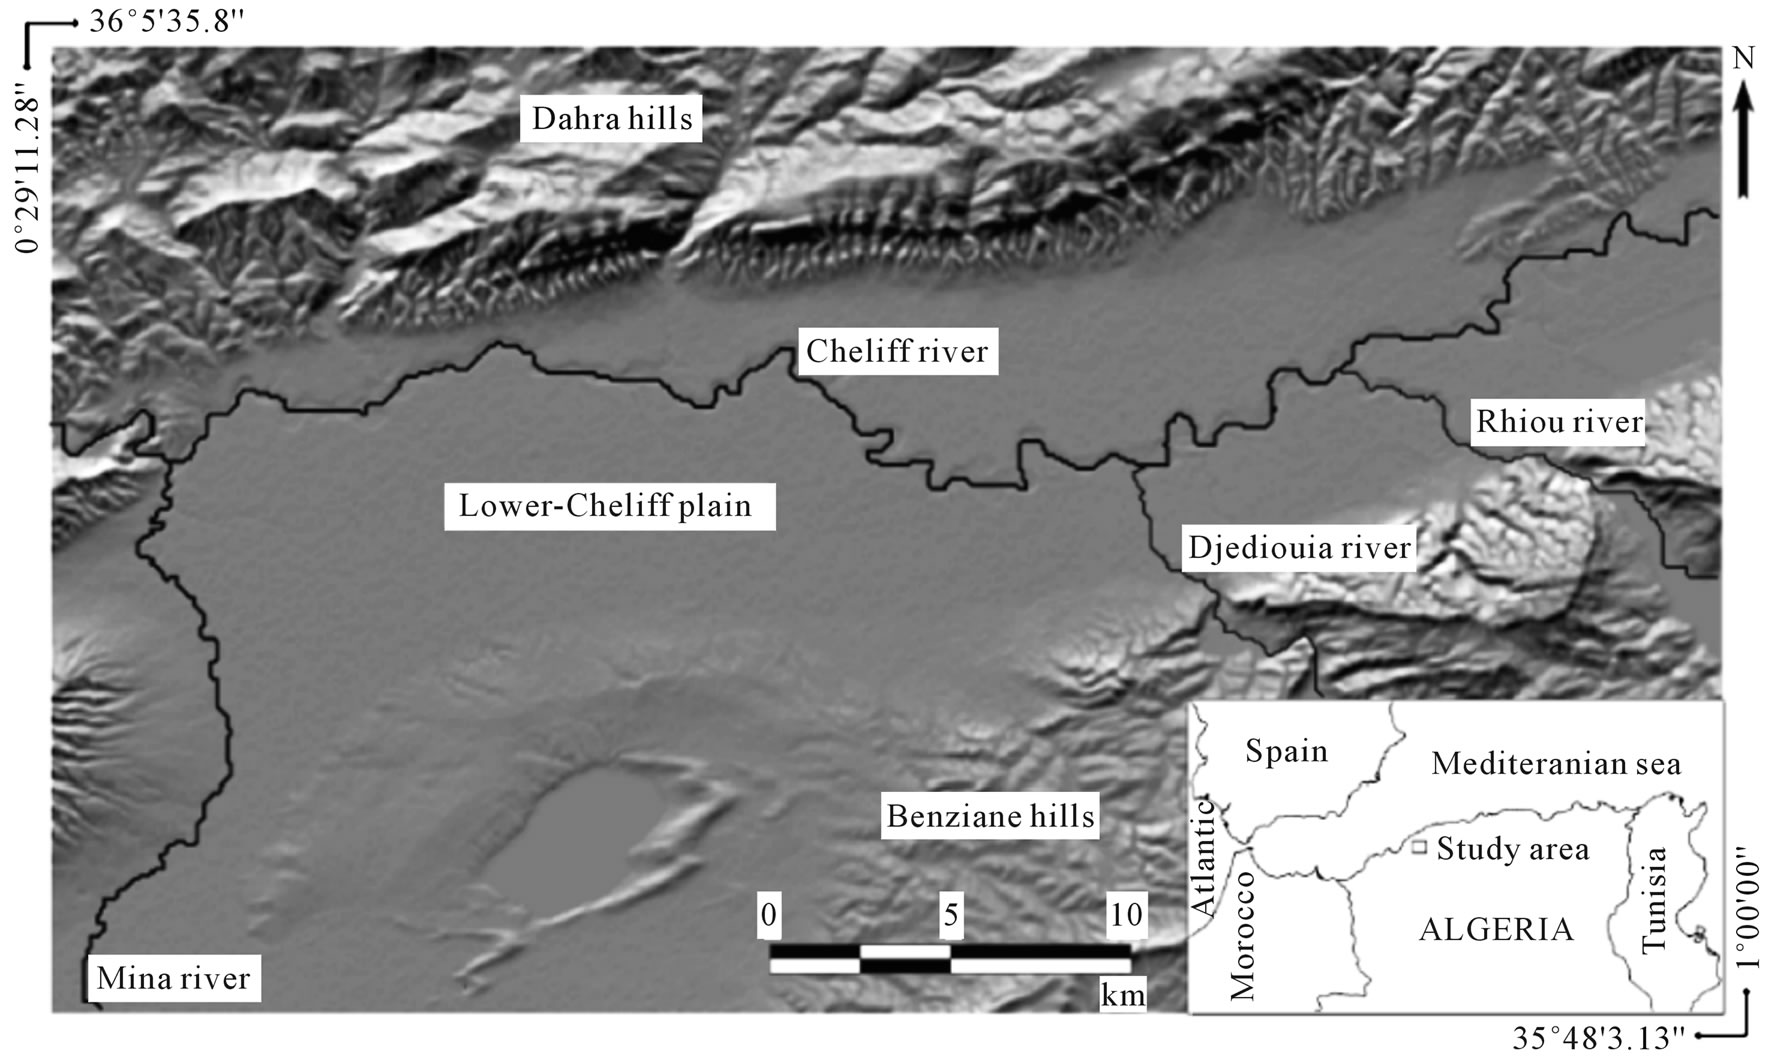
Figure 1. Location of the study area in northern Algeria, showing the lower-Cheliff plain.
Le Bissonnais [20]. Its objective is to give a realistic description of the behaviour of soil materials subjected to the action of the rain and to allow a relative classification of materials with respect to this behaviour. In summary, the method is designed to distinguish between the various mechanisms of breakdown: slaking due to fast wetting, micro-cracking due to slow wetting and mechanical breakdown by stirring of prewetted aggregates. The laser particle-measurement instrument of Mastersizer S (Malvern Ltd Instrument) was used. It is based on the Mie theory of light diffusion to calculate the diameter of the particles. To apply this theory, it is enough to choose the structure type of the sample and nature of liquid phase in the suspension. In this study, it is supposed that the particles are in water suspension. A selected type of lens (300 RF) makes that is possible to measure a diameter between 0.05 and 880 µm. The fraction > 500 µm was obtained by the classic sieving method. The mean weight diameter (MWD), which is the sum of the percentage fractions of the soil remaining on each class multiplied by the mean aperture of the adjacent meshes, is calculated from the fragment-size distribution. The MWD ranges between 0.001 mm and 3.5 mm. An average MWD is calculated to summarize the results of three treatments. This non-destructive technique characterized by using the resulting fragment-size distribution with the laser diffraction instrument has the advantage to ensure the repetitively of measurements acquired in order to control their stability. On the other hand, it allows to measure the disintegration kinetics of the soil structure according to the time of agitation. In this case, the MWD (bis) is the result of calculation after a 5 minutes interval between the first and the second measurement.
2.5. Soil Infiltration Measurement under Simulated Rain
2.5.1. The Rainfall Simulator
The artificial rain was implemented using a sprinkling device. The rain simulator is established according to the model designed by Asseline and Valentin [21]. It consists of a watering system fixed at pyramidic tower of 4 metres in height and protected from the wind action by a removable cover. Sprinkling is ensured by a metering jet (tube no. 6540) assembled on an oscillating arm whose movement is printed by an electric motor. This infiltrometer with sprinkling makes that is possible to simulate rain of controllable intensities on a measurement seat. The range of available intensity varies from 20 to 150 mm/h. The protocol of simulation includes several rain tests of an average intensity of 30 mm/h (±2 mm∙h–1) during one hour and half is 45 mm of precipitation. It corresponds well to that meets in the zone of study for a natural rain event of decennial recurrence. The flux of water through the sample was measured every 5 min., and the ratio between final infiltration and the rainfall (the final infiltration coefficient) was calculated for the experiment. The treatments were replicated three times for each soil.
2.5.2. Preparation of the Samples
The soils samples of approximately 10 cm distance in-between are distributed on a PVC plate measuring 50 × 50 cm. The soil samples of a volume of 78.5 cm3 resting on a bed of 1 cm of calibrated and washed sand are put in cylinders made of PVC of a diameter of 5 cm and a 5 cm height. They are transparent in order to be able to control the moistening visually. They are perforated at their bases to be used as holes of evacuation for the infiltration measurement. The soils are initially saturated by the base. They are then exposed to a rainfall simulated by using distilled water until the rate of stabilized infiltration is obtained. The standard conditions of the simulator operation for each episode rain are calibrated and checked. The analysis of each group of data primarily relates to the evaluation release time of the infiltration and thereafter, to the measurement of the water volume infiltrated for each rainy event.
3. RESULTS AND DISCUSSION
3.1. Statistical Characterisation of Sample Population
The general statistics of the physical and chemical characteristics of the soils are given in Table 1. They indicate the prevalence of soils that have basic pH and are generally calcareous, with contents of organic matter ranging between 0.5% and 3% and a clay loam texture. The samples are characterised by averages raised for electrical conductivity and the quantity of total soluble cations translating a strong variability of the results in this area. In the calcareous soils, the value of the CECe measured at the soil pH is always higher than that measured at pH 7.
3.2. Importance of CEC Measurements in the Context of the Saline Phase
The cation exchange capacity (CEC) constitutes the privileged characterization tool of the soil surface properties. Two methods were tested in this study. The first one is based on the determination of the CEC at the natural pH of the soil (CECe). The value of the CEC then depends upon the geochemical environment, in particular the pH. The second method determines the CEC at pH 7 which makes to compare materials on the standard bases (CECMetson). The results of Table 1 show that the CEC values vary from 17 to 25 cmol∙kg–1 when it is measured at the natural pH of the soil and from
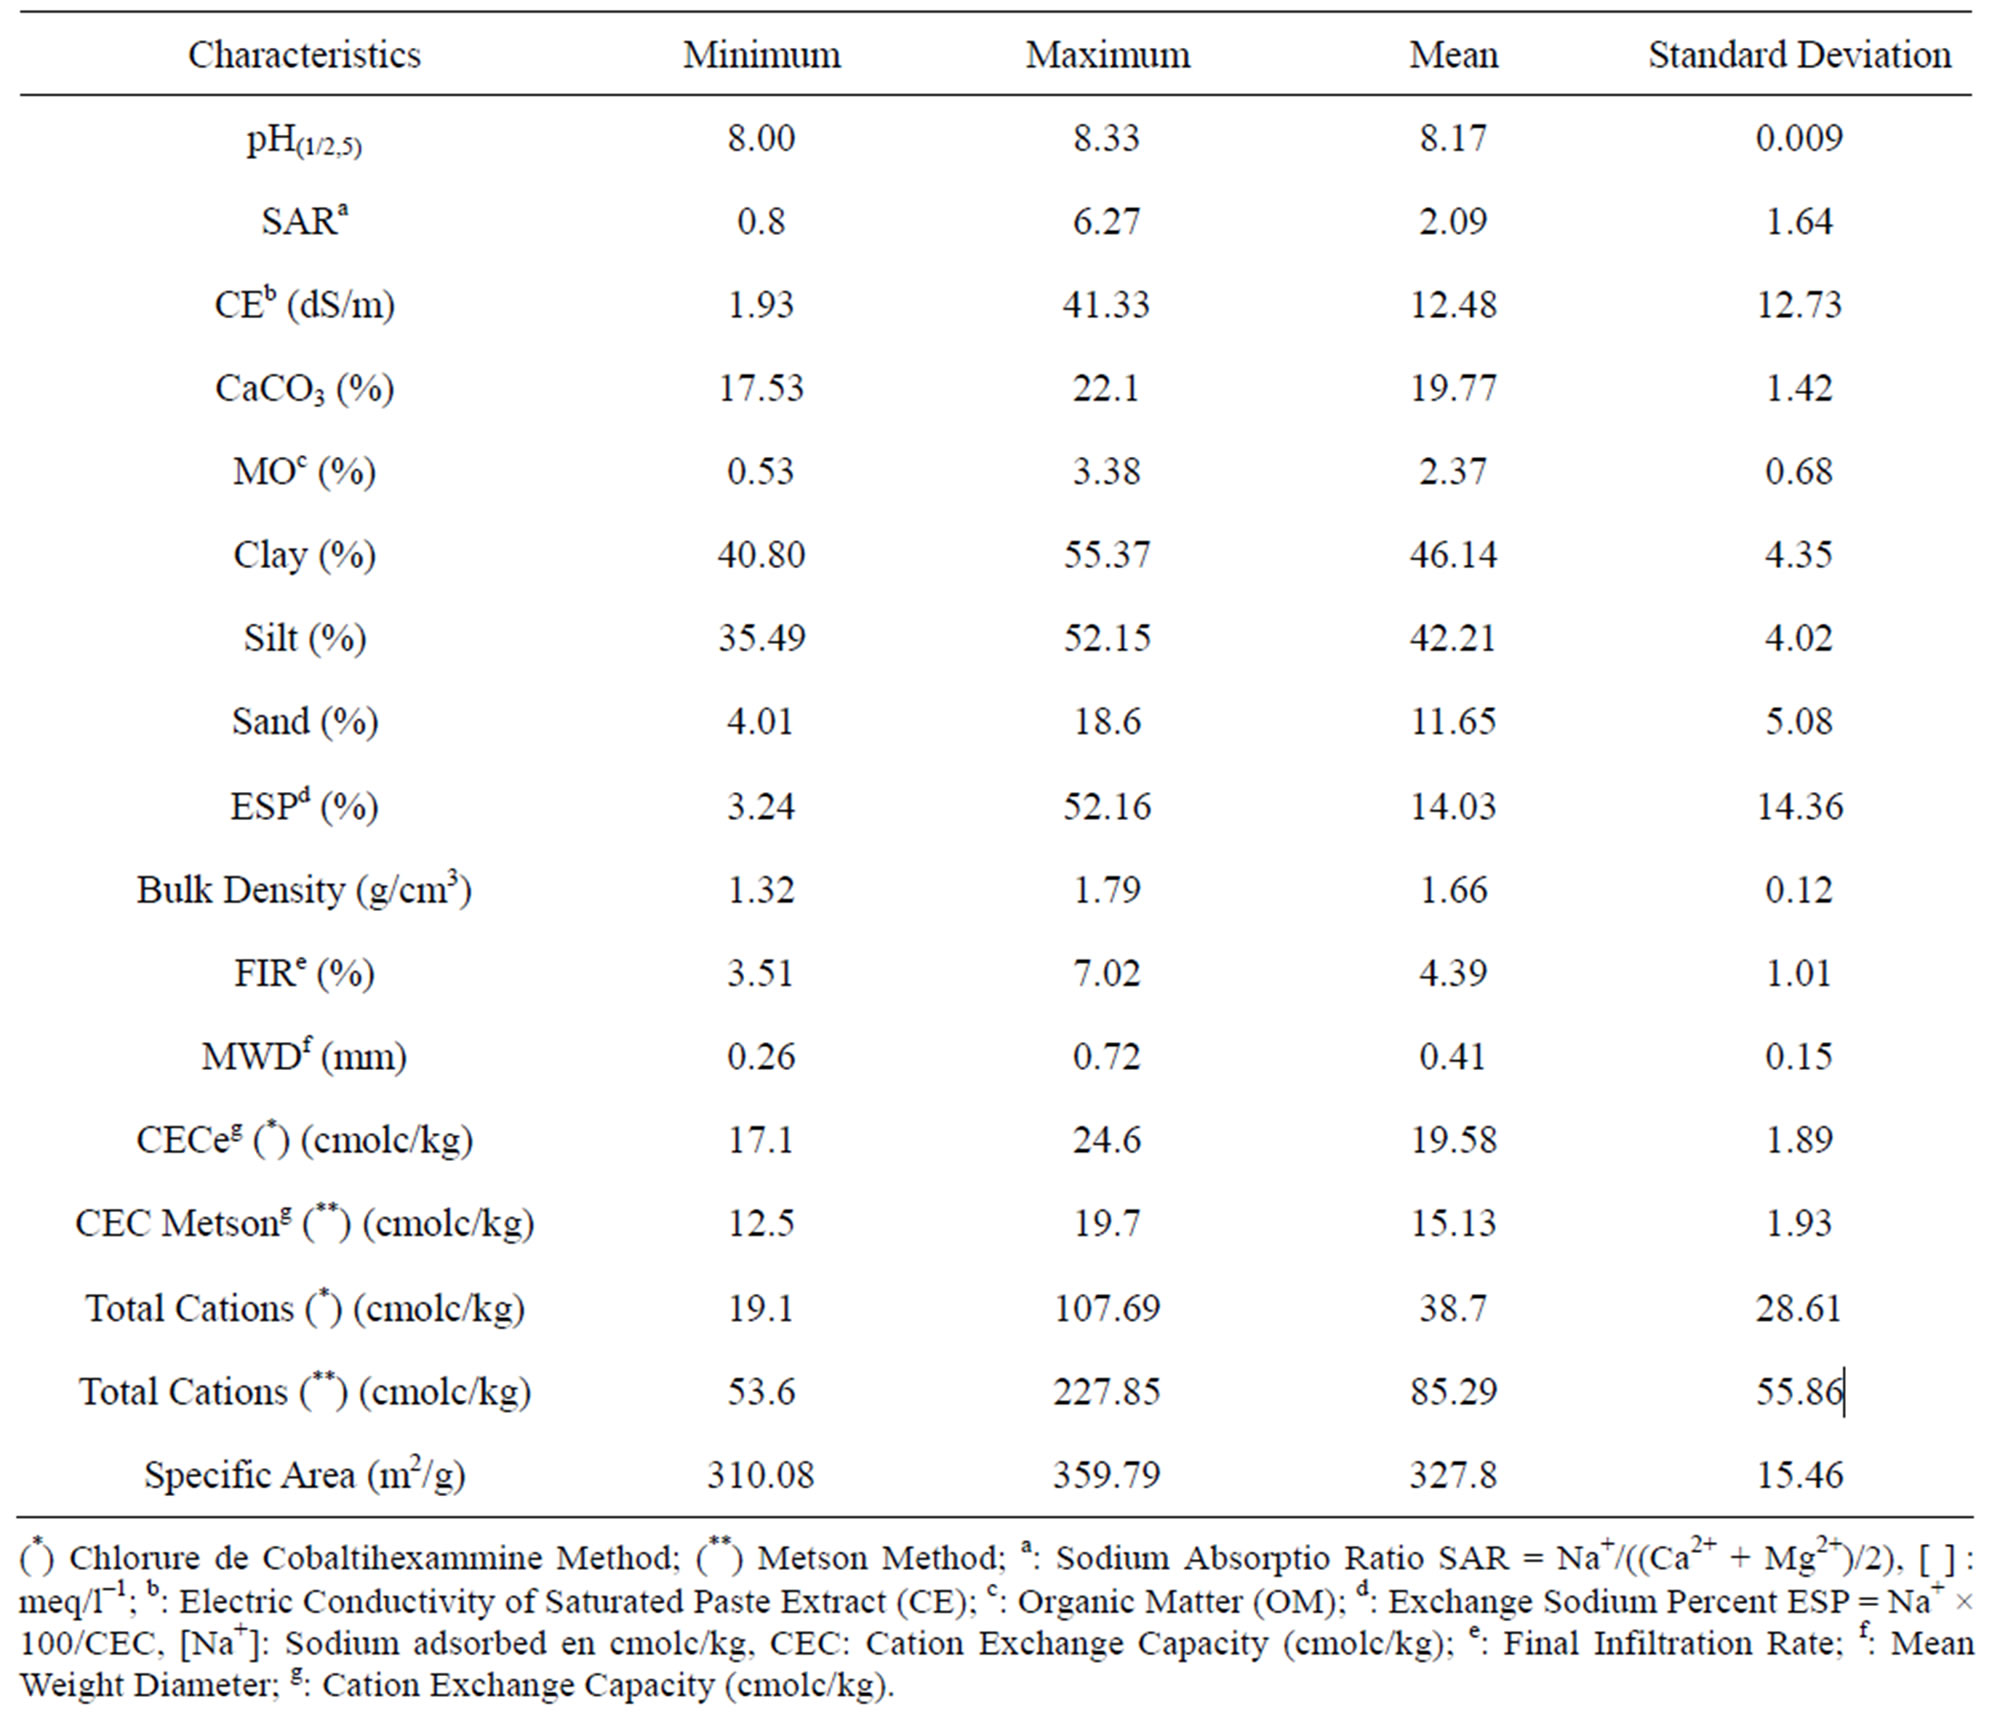
Table 1. General statistics of various physical and chemical characteristics of the soil Cheliff plain samples.
12 to 20 cmol∙kg–1 when it is measured at the pH 7. The difference between the cobalt-hexamine method of [11] and the Metson method [16] takes account of the pH reached during the initial saturation of samples [9]. In the first method, it is the usual pH, that the soil approaches, but in the second one, the soil pH equals to 7. Comparing the values of the two methods in Figure 2, it is realized that the CEC values with cobalt-hexamine (CECe) are higher compared to those of the Metson method (CEC7). However, the exchangeable bases of the Metson method are higher compared to those of the cobalt-hexamine method (Table 1). According to [22], this difference resides in the fact that during measurement with pH equal to 7, a part of the carbonates is dissolved. The result is that the cations extracted come in particular from the setting in calcium solution. On the other hand, the CEC with the cobalt-hexamine measured at the pH of the soil (CECe). This makes that it is possible to extract the exchangeable cations and those that are present in the solution from the soil without the effect of carbonate dissolution. Moreover, the CEC values of the soil depend, at the same time, upon the mineralogical nature of clays and the electric surface charges developed
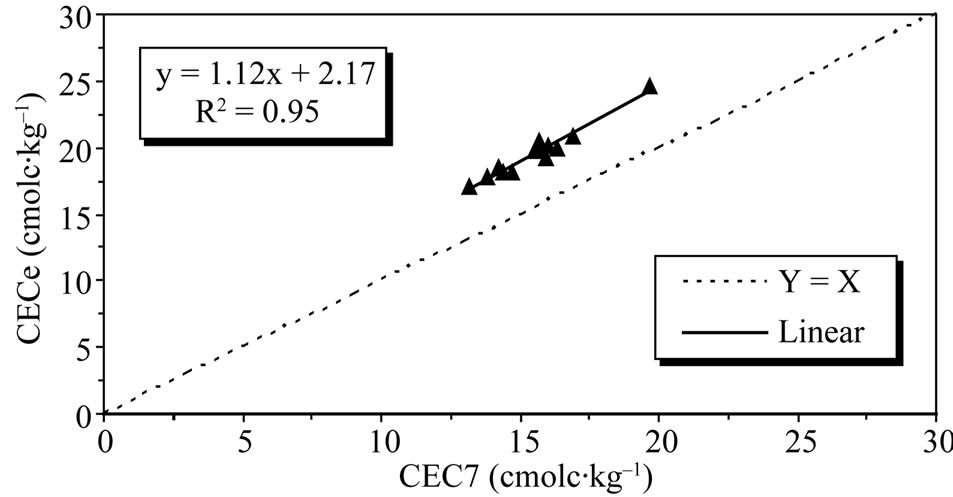
Figure 2. Relationship between the cation exchange capacity measured with the cobalt hexamine trichloride method and with the Metson method.
by the organic matter. The multiple linear regressions (Table 2) show that the CEC of the clays and the organic matter are regarded as additives [23,24]. An average value of CECe of 41.26 cmol∙kg–1 is obtained for clays of Cheliff plain. Clay content explains 65% of the CEC variability of the soil measured with the cobalt-hexamine. On the other hand, when one uses the Metson method, the average CEC value of clay is 39.94 cmol∙kg–1 and clay content explains only 60% of the variability. The
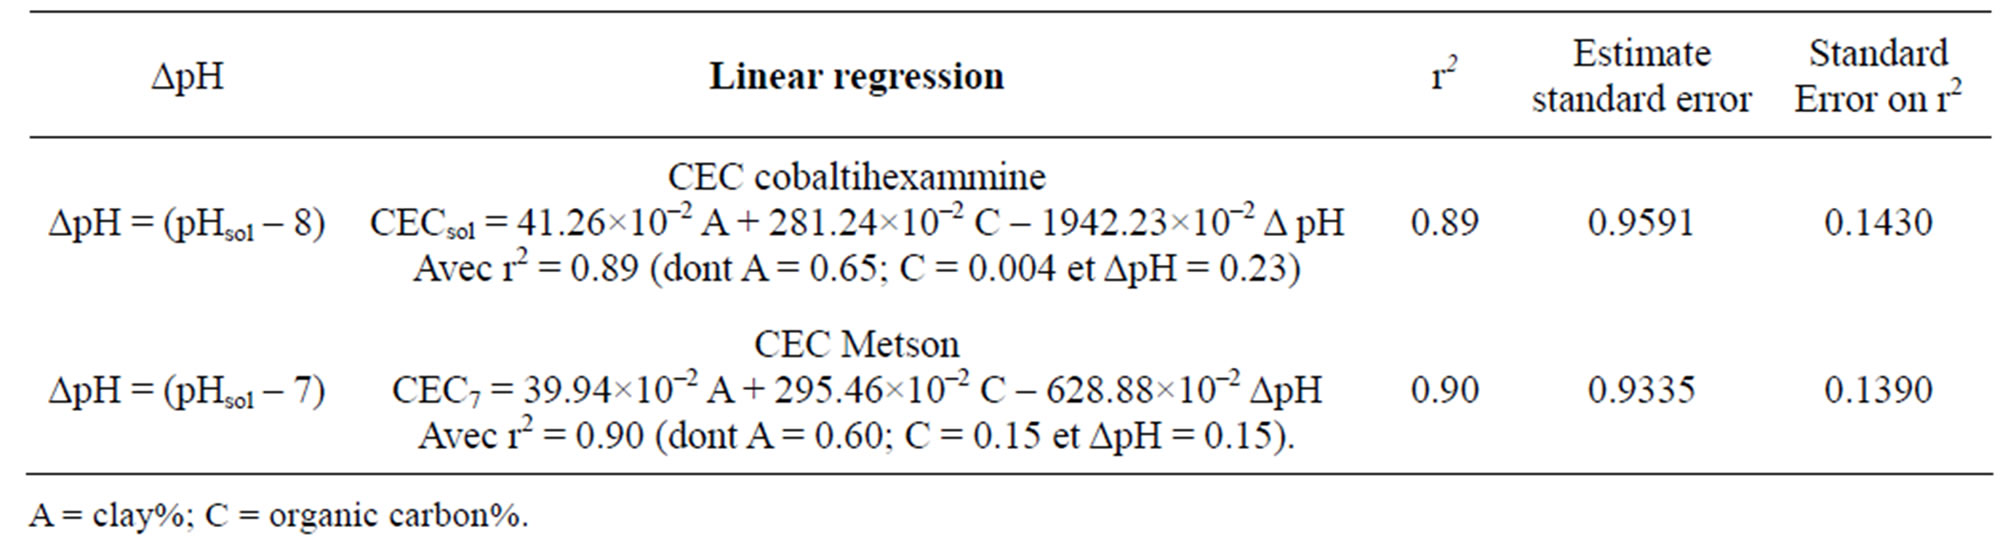
Table 2. Linear regression between the CEC of the soil and their physical and chemical characteristics.
organic matter explains a large part of variability for Metson method than cobalt-hexamine method. Differences between the CEC values of the organic matter are obtained. These last differences (on the basis of 58% of carbon) are evaluated, with 1710 mmol(+)∙kg–1 for the Metson method and 1630 mmol(+)∙kg–1 for that with the cobalt-hexamine. However, as the organic matter content is weak, its weight is not as significant as that of clay. This explains 0.4% and 15% of the variability of the cobalt-hexamine CECe and the CEC Metson, respectively.
It appears that the value of the CEC results from the cumulated properties of the clay and the organic matter. The fact that there is a measurement difference between both methods according to their implementation (pH of the soil, CECe; and pH 7, CEC7), makes the possibility to coarsely characterize the state of reactive surfaces and their contribution to the pH of the sample. In this direction, for the Metson method, the used (ΔpH) corresponds to the difference between the pH of the soil and the pH of the extraction solution. With regard to the cobalt-hexamine method, the used ΔpH corresponds to the difference between the real pH and the minimum pH found in the studied soils. The regression equations indeed use a differentiation factor of the (ΔpH) as independent variable to justify 23% and 15% of the CECe and CEC7 variability, respectively. This CEC variation due to (ΔpH) is attributed to the action of protonation/ deprotonation. Shortly, to evaluate the CEC by these two methods, one can realize that the independent variables explain 89% and 90% of the CEC variability. The CECe that carried out with the pH close to the soil is less influenced by the organic matter, since its contribution is, in this type of soil, often unimportant. It is justified only by 0.4% of variability due to organic matter and would be dependent on the clay which presents variable loads of edge according to the pH. The CEC at the standard pH 7 (Metson method), is justified by 15% of variability due to the dissociation of the phenol groupings of the organic components at pH 7. According to regression equations, these various ratios are useful because they make it possible to estimate the CEC of the soil at any pH only starting from the organic matter and of texture. These values agree with the bibliographical data [23].
3.3. Salinity Index Determination
According to the various CEC results obtained and the exchangeable cations, which were extracted using ammonium acetate and the cobalt hexamine (Cohex) trichloride, two salinity indices could be defined. These indices will be applied to both methods used in the determination of CEC and exchangeable cations.
Salinity index 1 (SI1) = Scations/CEC(1)
Salinity index 2 (cmolc∙kg–1) (SI2) = Scations – CEC (2)
SI1 and SI2 are related to the method with the cobalthexamine, whereas for the Metson method SI3 and SI4 are used. The electrical conductivity of the saturated paste (ECe), the sodium of adsorption ratio (SAR) and the exchangeable sodium percentage (ESP) were measured and estimated from the equations that were modelled by the linear relations 3 and 4 as follow:
Y = aSI1 + b(3)
Y = cSI2 + d(4)
SI is the index of the salinity, the b and d are constants, a and c are the slopes of the regression.
The statistical analysis that relates to manpower of 13 samples (Table 3) shows that SI1, SI2 and SI3 explain 87% of the electrical conductivity (EC) variance. On the other hand, SI4 explains only 80% of this variance. It is noticed that when the sum of the exchangeable cations extracted with the cobalt-hexamine is equal to the cation exchange capacity, indices SI1 and SI2 take the values of 1 and 0, respectively, whereas the salinity, which is expressed by electrical conductivity, is higher than 4 dS∙m–1. The presence of cations in excess compared to the CEC confirms the presence of salts, including magnesium and calcium salts. In addition, the sum of the exchangeable cations was never equal to the cation exchange capacity extracted with ammonium acetate. A ratio of 6/1 for index SI3 and a difference of 70 cmolc/kg for index SI4 make that it is possible to classify the soil samples in the category of the strongly saline soils because of their electrical conductivity has values higher than 12.00 dS∙ m–1. This clearly shows that the quantity of cations extracted with pH 7 is much higher than that extracted with
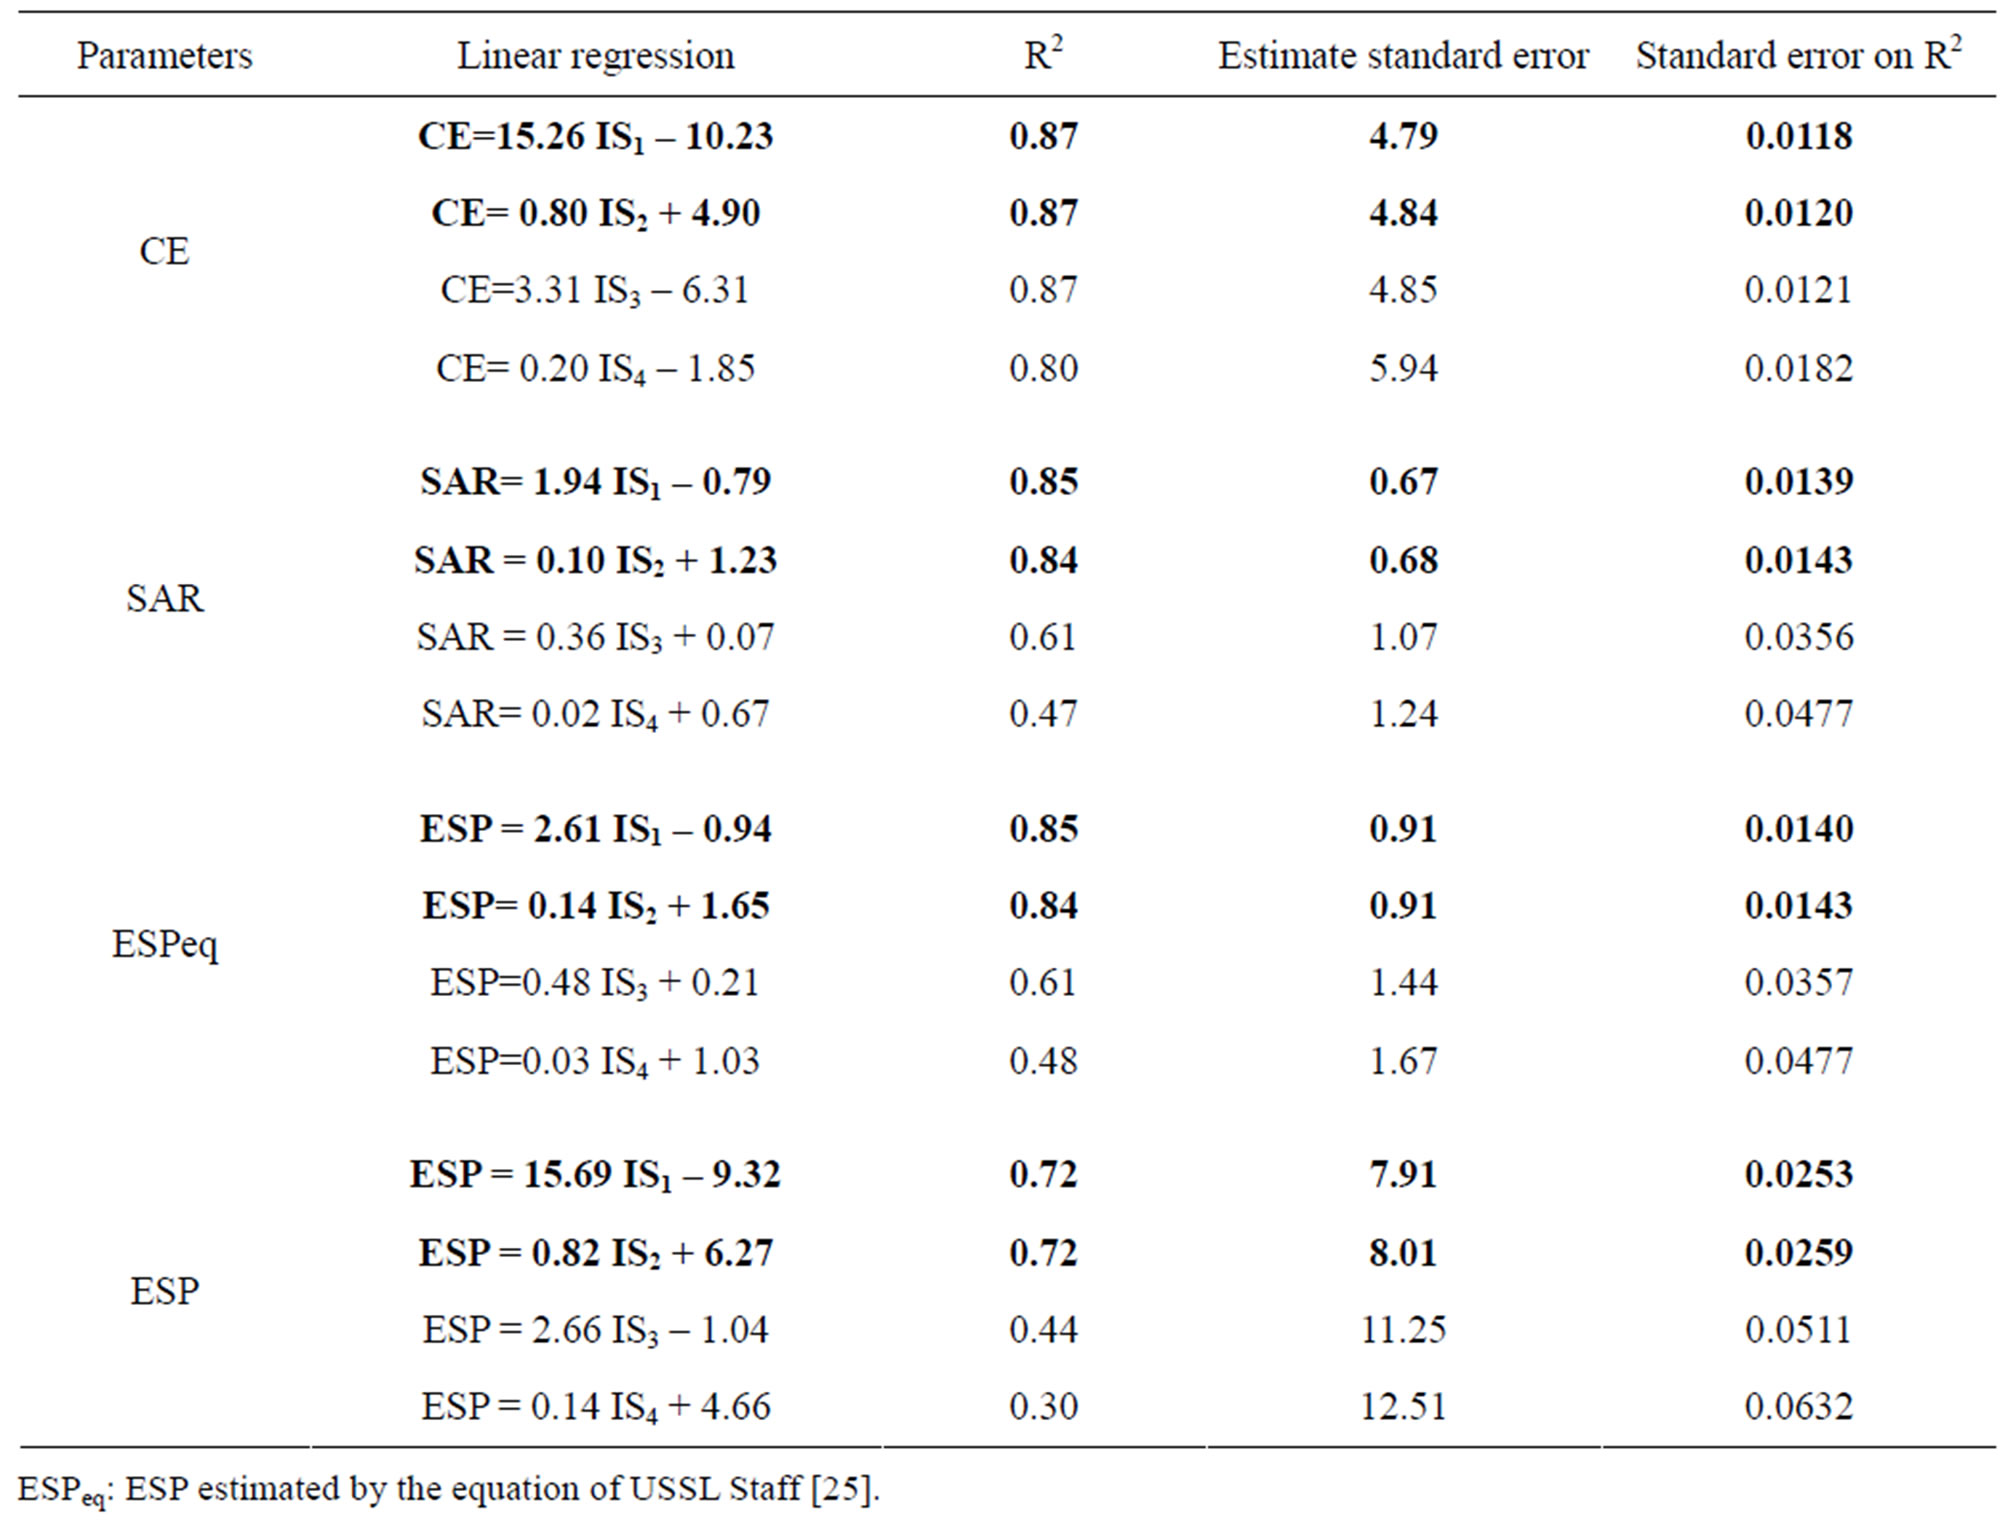
Table 3. Linear regression between the parameters of salinity & sodicity and the salinity indices. The data in boldface characters correspond to the regressions obtained to the measurement made with the pH close to the soil (cobalt-hexamine).
the pH close to the soil. So, the cobalt-hexamine method is an indicator about the state of the soil salinity (Table 3). For the Metson method, the electrical conductivity (EC) expresses at the same time the electrolytic load of the solution, which comes from the phenomenon of dissolution of calcite at pH 7. The salinity index is also dependent on the SAR (formula 7) of the soil solution. These indices explain 60% to 85% of the sodicity variance of Mina plain soils. As it is shown in Table 4, the values of the determining coefficient are higher for the SAR and ESP when the explanatory variables use the data of the cobalt-hexamine method. By using the Metson method, the relation between the salinity index and the parameters of sodicity is low. The typical error and the standard error r2 are justifying it, which are appreciably higher than the others. The correlation matrix (Table 4) shows the various connections which can exist between salinity and sodicity. In the case of the salinity of the saturated paste extract, it corresponds to many soluble salts.
Figure 3 indicates the relation between the salinity index 2, which represents the quantity of cations in soil solution, and the total soluble cations of the extract of saturated soil paste. The equation of the straight regression line shows that the slope value is lower than 1,
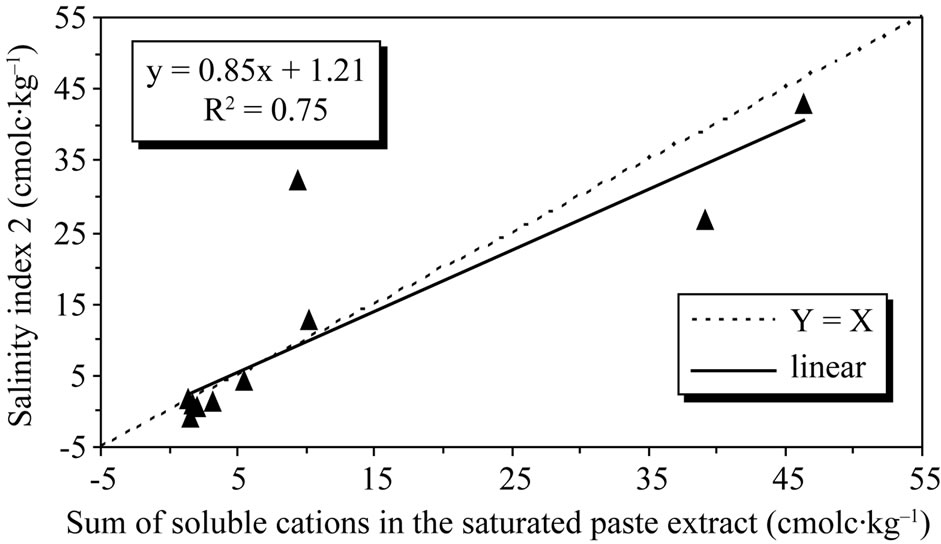
Figure 3. Relationship between the salinity index 2 estimated by the cobalt hexamine trichloride method and the total soluble cations from the saturated paste extract.
which explains why the sum of total soluble salts extracted from saturated soil paste is higher than those extracted with the cobalt-hexamine. It can be concluded from the cobalt-hexamine extraction that the dilution ratio (1/10) used with water was not sufficient to extract all the cations that are present in the saline soils of Cheliff plain.
To characterize the saline soils of Cheliff plain, the CEC effective and the exchangeable cations extracted at the pH of the soil used as a criterion of evaluation must
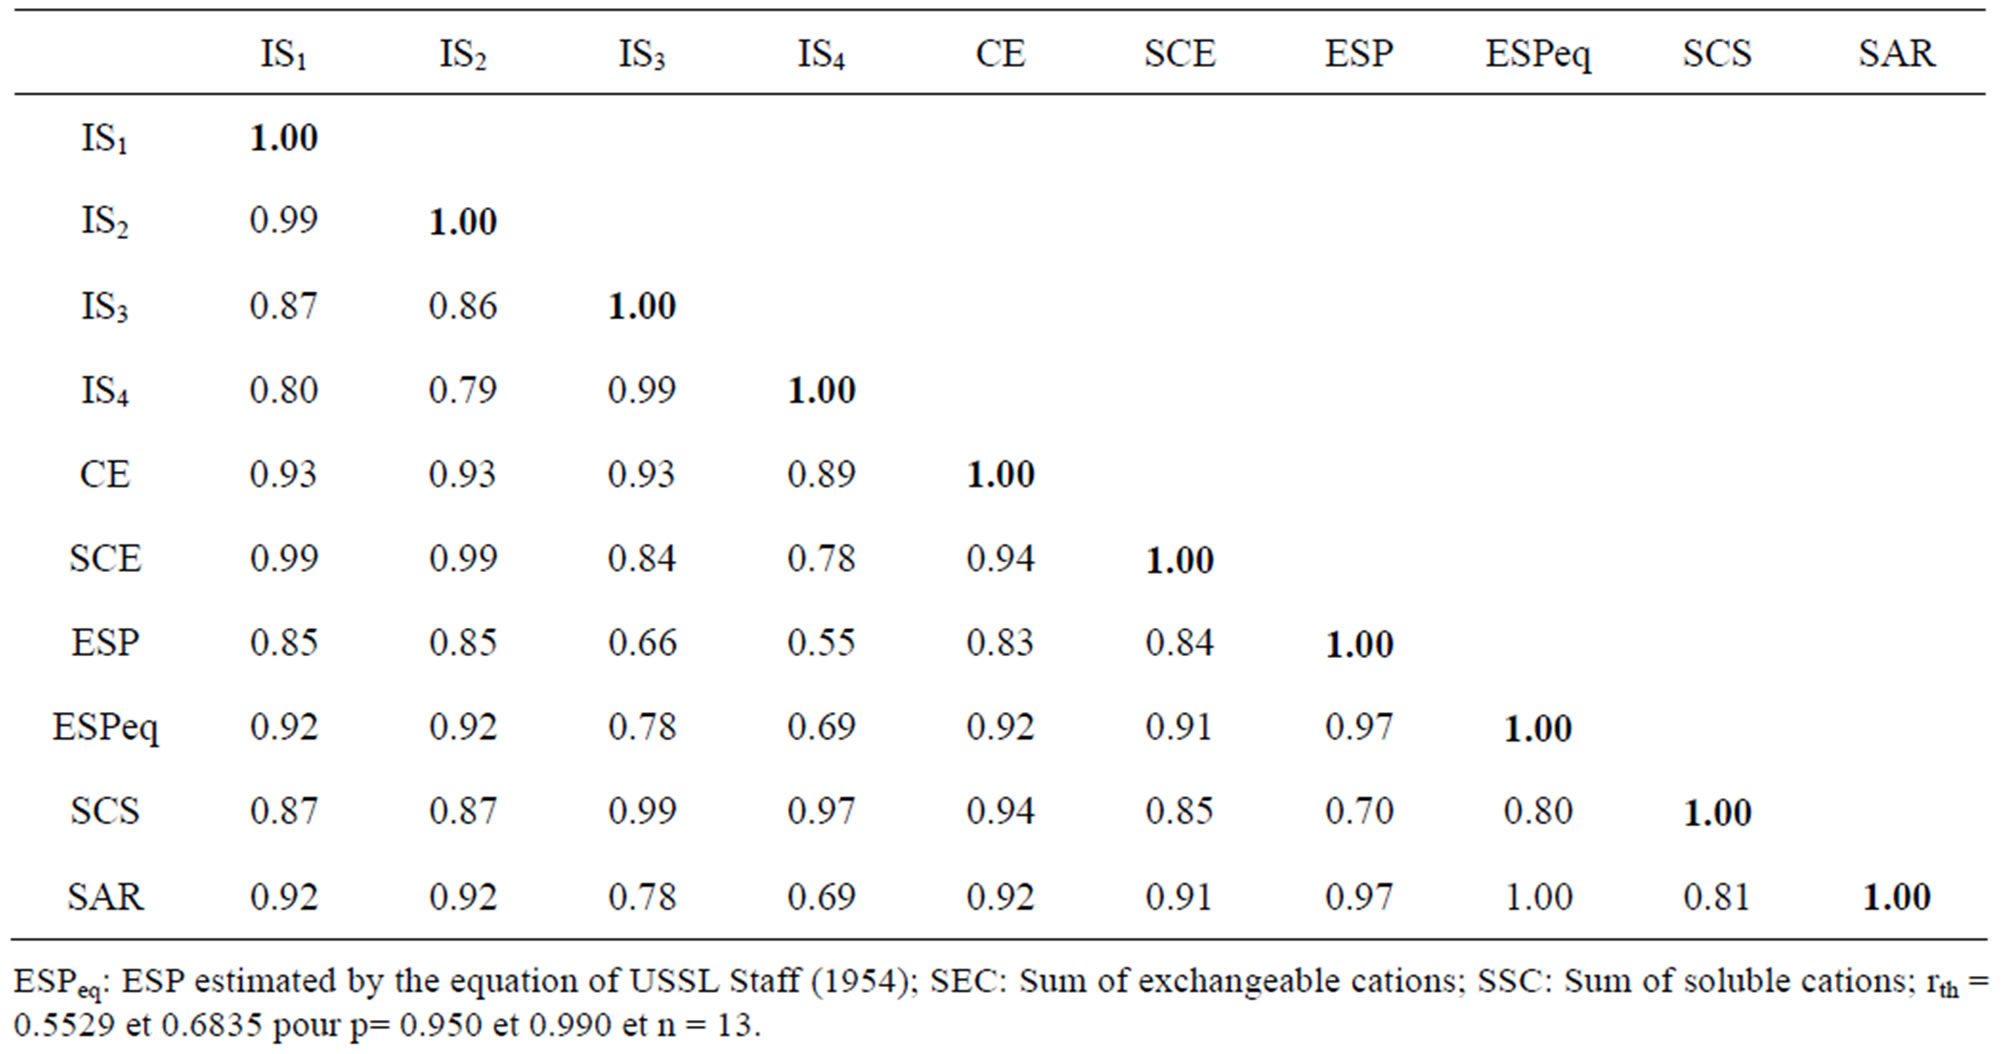
Table 4. Matrix correlation between the salinity indexes and the parameter of salinity & sodicity (the signifycant correlations at p = 0.005 are underlined).
be adapted well compared to those extracted with standard pH 7. Through the total cations and the CEC, it can be regrouped the soils of Mina in Cheliff plain. It is also necessary to define the parameters of the saline phase as follows:
ESP = (100 * Exchange Na)/cationic exchange capacity (5)
ESP = (100 * Echangeable Na)/S(Exchangeable Ca + Mg + K + Na)(6)
SAR = [Na+]/([Ca2+ + Mg2+]/2)1/2(7))
ESPeq = 1.475 * SAR/(1 + 0.0147 * SAR) [25].
• The none-saline soils regroup which are the soils whose electrical conductivity is lower than 4 dS/m and the quantity of the total cations is almost identical to the CEC. Therefore, without excess cations in the soil solution, ESP will be evaluated on the basis of CEC (Formula 5).
• The saline soils regroup which are the soils whose electrical conductivity is higher than 4 dS/m and the quantity of the total cations is higher than the CEC. In this case, the exchangeable cations are obtained by the difference between total cations and soluble cations of the saturated soil paste extract. ESP will be evaluated on the basis of sum of the exchangeable bases (Formula 6).
• The saline soils have an evolution dominated by the presence of strong quantities of salts more soluble than gypsum. In general, the salinity is measured by the electric conductivity of the saturated soil paste extract (ECe). The richness of the soil exchange complex by sodium ion and the degradation susceptibility of soil physical properties are characterized by the exchangeable sodium percentage (ESP) and sodium adsorption ratio (SAR) when they exceed the values of 15% and 10%, respectively. They are usually used to envision the evolution of the exchange complex composition and to define the term of sodicity. It is noticed, according to the matrix of correlation (Table 5) that the SAR and ESP increase with increasing the electrical conductivity with a correlation coefficient higher than 0.90. This indicates that the salinity of the soils is accompanied by a sodization of the soil exchange complex. In addition, both salinity indices (SI1 and SI2) make that it is possible to well characterize the saline phases (sodicity & salinity) and could be used to estimate the level of salinization and alkalization.
3.4. Influences of Salinity Index on Soil Physical Properties
3.4.1. Water Retention
Measurements of water retention were taken on the natural water samples of various salinity levels. The results had a range of potentials from 10 kPa (pF = 1.0) to 15000 kPa (pF = 4.2), i.e. that represented a range of moisture content going from the field capacity to the point of permanent witting of the plants. With water potential bottoms (pF = 4.2), the water retention appears to be very strongly correlated to the cation exchange capacity when it is measured at the standard pH 7 (CEC7) and to the specific surface (SS) area (Table 5). On the other hand, the relationship obtained with CEC effective measured using cobalt-hexamine method is not close to the coefficient of correlation (r = 0.68).
It also appears that the standard CEC (Metson method)
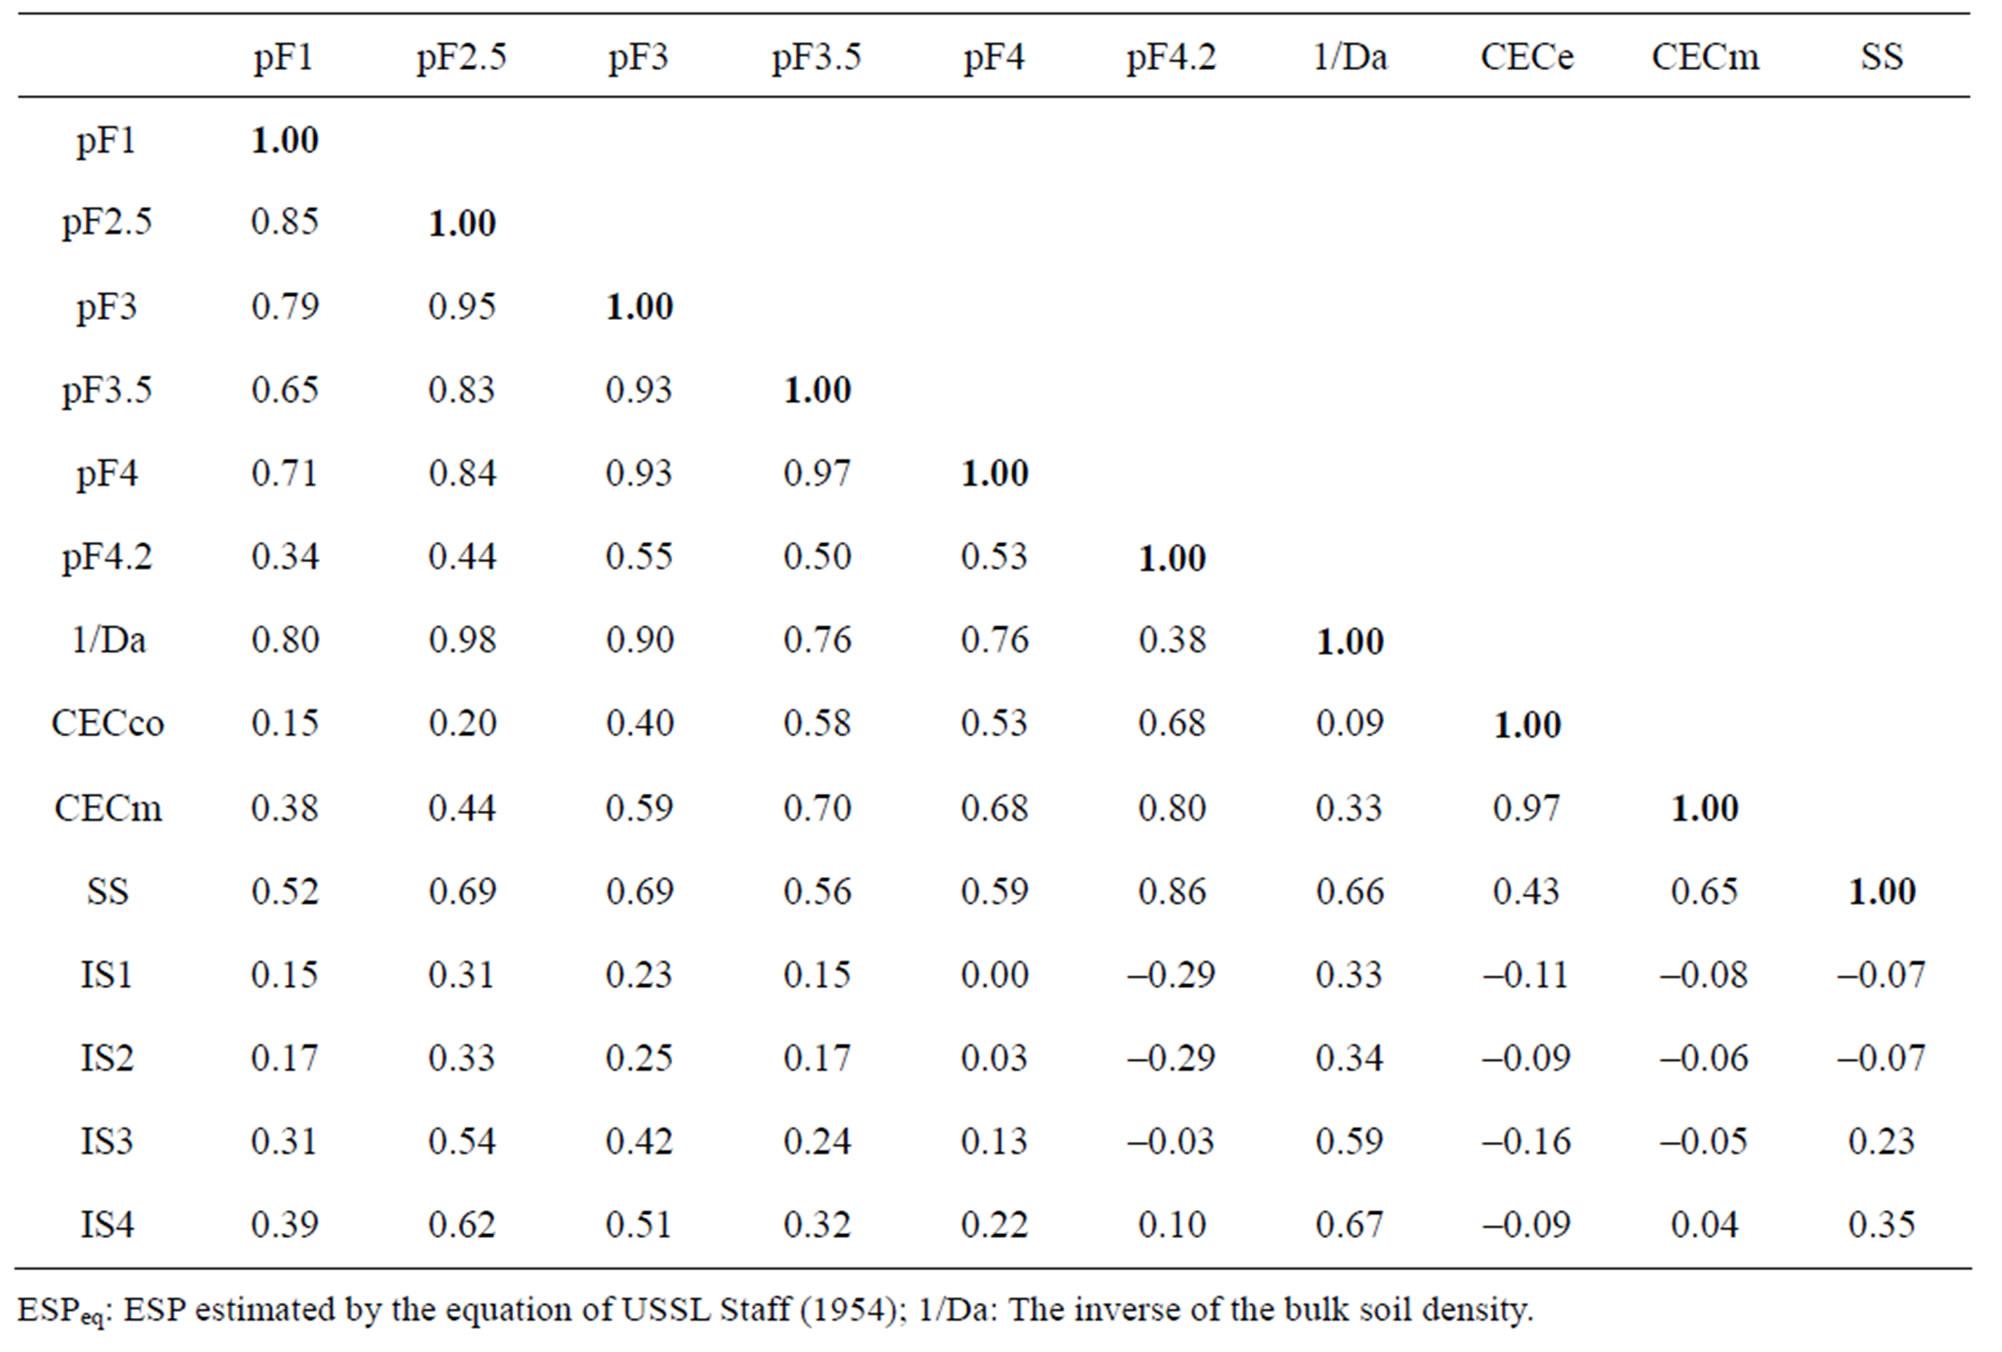
Table 5. Matrix of linear correlation between the salinity indexes and the water retention properties (the significant correlations at p = 0.005 are underlined).
and specific surface area (SS) could be used as a suitable criterion for the soil water retention. These results agree with those of [6] and [24]. For high water potentials in the vicinity of the field capacity (pF between 1 and 3), the correlation coefficients obtained between the CEC and the water content are weak. On the other hand, the best relations are obtained with the inverse of the apparent soil density (1/Da). The apparent soil density varies from 1.3 to 1.8 for the studied soil samples. The apparent density of the soil is also an indicator of the water retention for the field capacity because the variation of water content is primarily related to the evolution of structural porosity and thus to the structure of the soil. These results are in accordance with these of [26], which showed that the water retention at pF 2.5 was well correlated to the inverse of the apparent soil density (1/Da).
3.4.2. The Structural Stability and the Hydrodynamic Behaviour of the Soils
As it is shown in Table 6, the salinity index calculated using the results of cobalt-hexamine measurement is well correlated to the inverse of the mean weight diameter (1/MWD) and to the final infiltration coefficient (FIC). It is also noticed that the relation is better between both SI1 and SI2 indices and the structural disintegration under an agitation during 5 minutes (MWDbis). The structural stability and the water infiltration of the soils remain the most adapted means to evaluate the sensitivity of the soils to the mechanisms of disintegration. The linear correlation coefficients estimated between these tests (1/MWD and FIC) and the parameters of the saline phase (Table 6) indicate rather strong relations between the electrical conductivity of saturated paste extract (ECe), the sum of the exchangeable cations (SEC), the exchangeable sodium percentage (ESP) and the sodium absorption ratio (SAR). The sum of the soluble cations (SSC) is not significantly dependent on any of the physical parameters. So, the effect of the soil solution concentration is less apparent. Both the inverse of the mean weight diameter (1/MWD) and the final infiltration coefficient of (FIC) have correlation coefficients slightly higher with sodicity than with salinity. It is noticed that the variables of sodicity (ESP, SAR and ESPeq) are better than the variables of salinity (ECe and SI) with respect to the disintegration under an agitation during 5 minutes (I/MWDbis). This means that the exchangeable sodium content controls the physicochemical mechanism of dispersion during disintegration, which involves the production of fine particles. This influence is explained by the role of sodium in the dispersion of soil particles [4,27] and the reduction of water infiltration. These two effects strongly contribute to closing the surface when the samples are subjected to the simulated rains of 30 mm/h [28,29].
4. CONCLUSION
The present study shows that it is possible to estimate
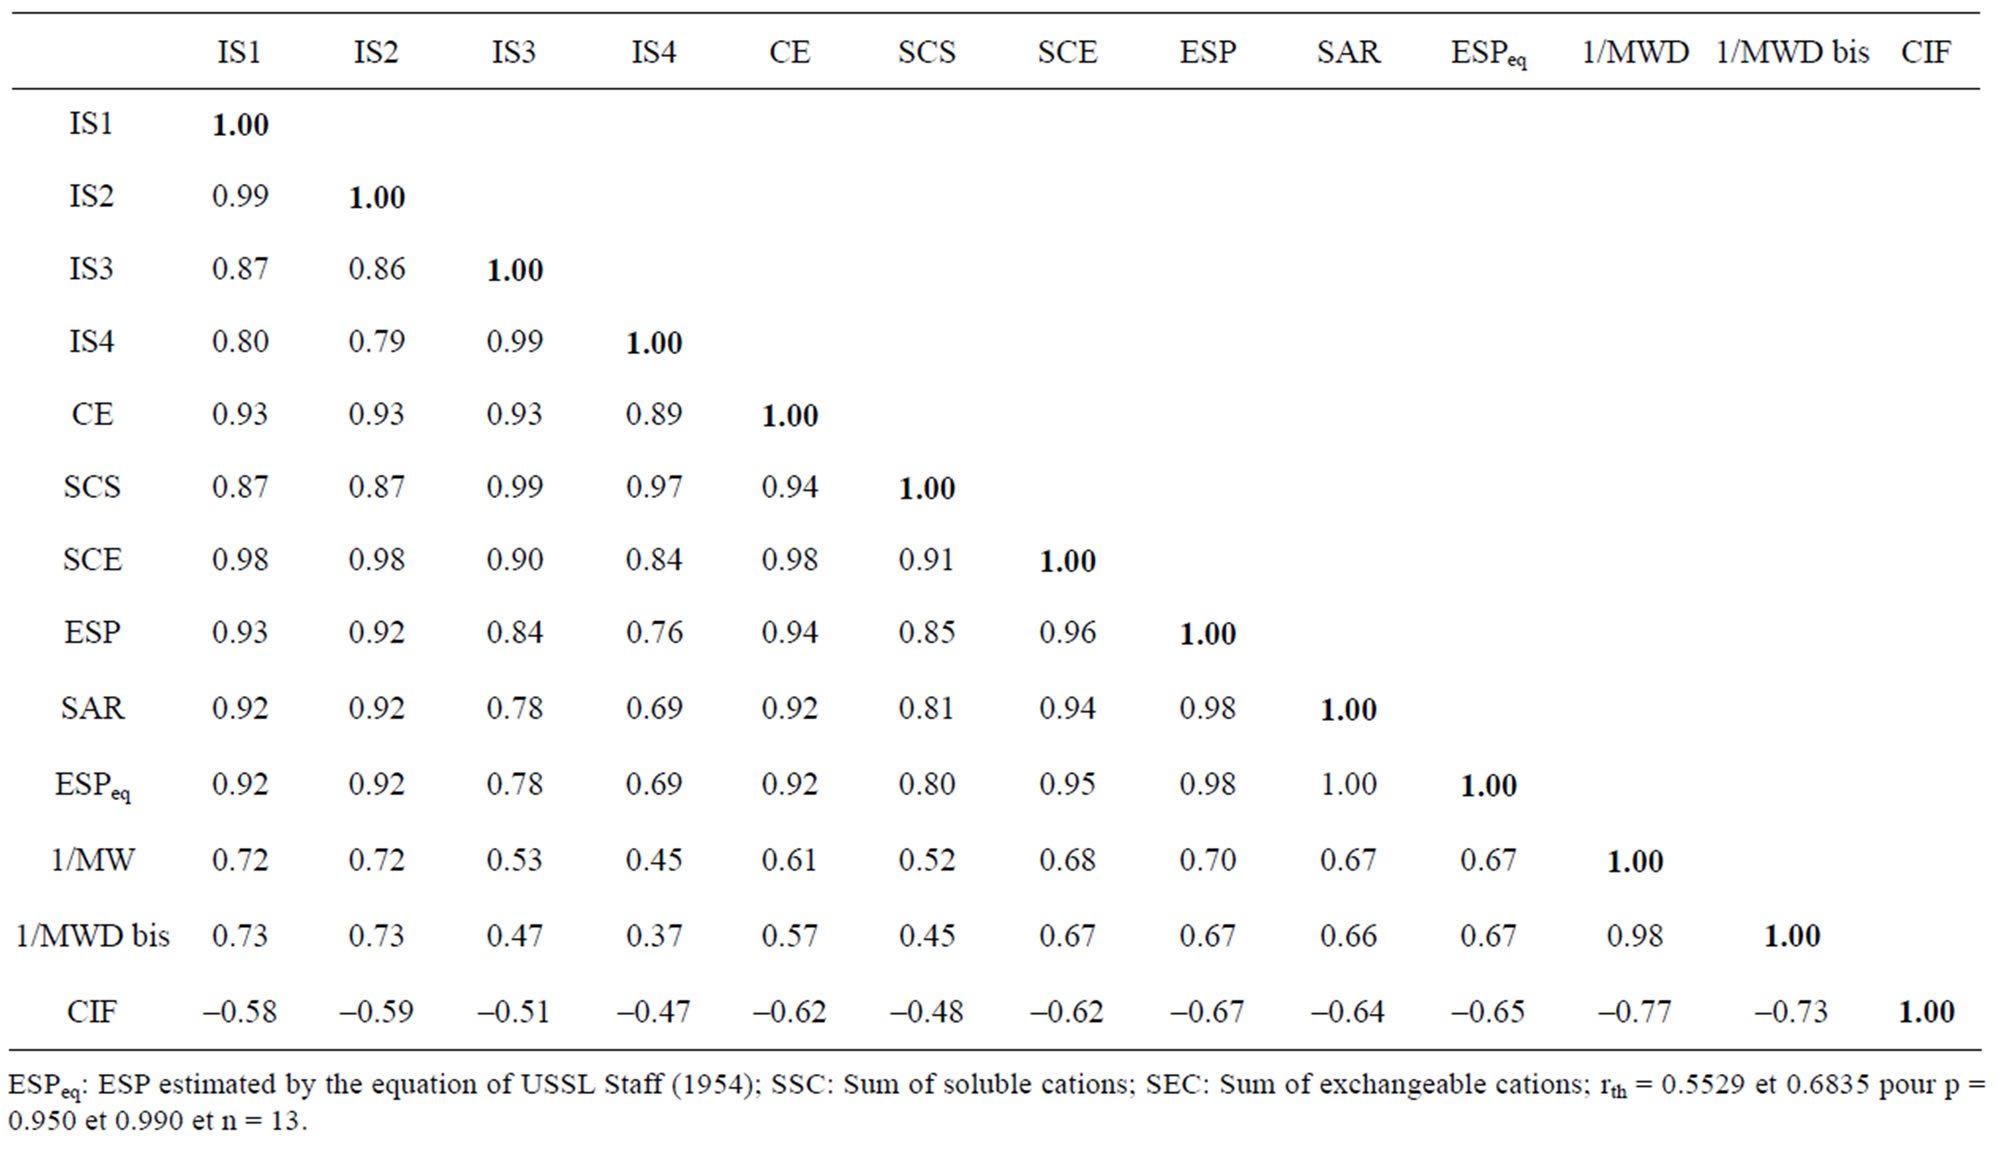
Table 6. Matrix of linear correlations between the salinity indexes, the salinity and sodicity parameters and the physical properties (the significant correlations at p = 0.005 are underlined).
the cation exchange capacity of the Cheliff soils from the clay content, the organic matter content and the pH of the soil. It also reveals that measurements of the CEC and the total cations carried out at the pH of the soil with the cobalt-hexamine cation make that it is possible to approach the chemical properties of the soils, such as sodicity. On the other hand, the measurement of the CEC at pH 7 presents the disadvantage of dissolving a part of carbonates and thus it is not adapted to measure the exchangeable cations and CEC in calcareous soils. However, the measurement of the CEC carried out at the standard pH 7 seems an indicator of the hydraulic soil properties at water potential bottoms, in relation to specific surface area. The inverse of the apparent density and the specific surface seems good indicators to estimate the properties of water retention at the field capacity and the permanent witting point, respectively. The influence of salinity is relatively less significant than the sodicity and the cation concentration of soil solution is not synonymous with bad stability. In general, It is clear that the relation of the saline phase and the physical properties results is not on the agenda. A detailed study is necessary. So, in this direction, we started a study on the effects of exchangeable sodium and cation concentration of the solution on the physical properties of clay materials of the Cheliff plain. We can say shortly that our study is a contribution to evaluate the quality of the estimate and the development of the pedotransfer functions to predict the behaviours of the Cheliff plains’ saline soils.
REFERENCES
- McNeal, B.L. and Coleman, N.T. (1966) Effect of solution composition on soil hydraulic conductivity. Soil Science American Proceeding, 20, 308-312. doi:10.2136/sssaj1966.03615995003000030007x
- El-Swaify, S.A. (1973) Structural change in tropical soils due to anions in irrigation water. Soil Science, 115, 64-72. doi:10.1097/00010694-197301000-00009
- Cass, A. and Sumner, M.E. (1982) Soil pore structural stability and irrigation water quality. I. Empirical sodium stability model. Soil Science Society of American Journal, 46, 503-506. doi:10.2136/sssaj1982.03615995004600030011x
- Halitim, A., Robert, M., Tessier, D. and Prost, R. (1984) Influence de cations échangeables (Na+, Ca2+, Mg2+) et de la concentration saline sur le comportement physique (rétention en eau et conductivité hydraulique) de la montmorillonite. Agronomie, 4, 451-459. doi:10.1051/agro:19840507
- Daoud, Y. and Robert, M. (1992) Influence of particle size and clay organisation on hydraulic conductivity and moisture retention of clays from saline soils. Applied Clay Science, 6, 293-299. doi:10.1016/S0169-1317(09)90004-7
- Tessier, D., Biggore, F. and Bruand, H. (1999) La capacité d’échange: Outil de prévision des propriétés physiques des sols. Compte Rendu d’Académie des Sciences, 85, 37-46.
- Heilman, M.O., Carter, O.L. and Gonzalez, C.L. (1965) Ethylene glycol mono ethyl ether for determining surface area of silicate minerals. Soil Science, 100, 356-360. doi:10.1097/00010694-196511000-00011
- Ciesielski, H. and Sterckemann, T. (1997) Determination of exchange capacity and exchangeable cations in soils by means of cobalt hexamine trichloride. Effects of experimental conditions. Agronomie, 17, 1-7. doi:10.1051/agro:19970101
- Charlet, I. and Schlegel, M.L. (1999) La capacité d’échange des sols. Structures et charges à l’interface eau/ particule. Compte Rendu d’Académie d’Agriculture, 85, 7-24.
- Bruand, A. and Zimmer, D. (1992) Relation entre la capacité d'échange cationique et le volume poral dans les sols argileux: Incidences sur la morphologie de la phase argileuse à l’échelle des assemblages élémentaires. Compte Rendu d’Académie des Sciences, 315, 223-229.
- Orsini, L. and Remy, J.C. (1976) Utilisation du chlorure de cobaltihexammine pour la détermination simultanée de la capacité d’échange et des bases échangeables des sols. Bulletin de l’AFES Science du Sol, 4, 269-275.
- Boulaine, J. (1957) Etude des sols des plaines du chélif. Thèse d’Etat, l’Université d’Alger.
- Saidi, D. (1985) Etude agropédologique de la plaine de la Mina (Relizane) et évaluation des propriétés physiques des sols. Thèse Ing., INA., Alger.
- Daoud, Y. (1983) Contribution à l’étude de la dynamique des sels dans un sol irrigué du périmètre du Haut Cheliff (Algérie). Thèse de Docteur Ingénieur de l’ENSA de Rennes.
- Saidi, D. (2005) Influence de la phase saline sur les propriétés physiques des matériaux argileux du Bas Cheliff. Thèse de Doctorat d’Etat, INA, Alger.
- Metson, A.J. (1956) Methods of chemical analysis for soil survey samples. New Zealand Soil Bureau Bulletin No. 12.
- Monnier, G., Stengel, P. and Fies, J.C. (1973) Une méthode de mesure de la densité apparente de petits agglomérats terreux. Application à l’analyse des systèmes de porosité du sol. Annals Agronomique, 25, 533-545.
- AFNOR (1996) Qualité des sols. Recueils de normes Française, AFNOR, Paris.
- Tessier, D. and Berrier, J. (1979) Utilisation de la microscopie électronique à balayage dans l’étude des sols. Observations des sols humides soumis à différents pF. Sciences du Sol, 1, 67-82.
- Le Bissonnais, Y. (1996) Aggregate stability and assessment of soil crustability and erodibility. I. Theory and methodology. European Journal of Soil Science, 47, 425- 437. doi:10.1111/j.1365-2389.1996.tb01843.x
- Asseline, J. and Valentin, C. (1978) Le simulateur de pluies de l’ORSTOM. Cahier Hydrologique de l’ORSTOM, 4, 321-347.
- Julien, J.L. and Turpin, A. (1999) Surfaces réactives et raisonnement de quelques propriétés chimiques des sols acides. Compte Rendu d’Académie d’Agriculture, 85, 25- 35.
- Curtin, O. and Rostad, H.P.W. (1997) Cation exchange and buffer potential of Saskatchewan soils estimated from texture, organic matter and pH. Canadian Journal of Soil Science, 77, 621-626. doi:10.4141/S97-015
- Bigorre, F., Tessier, D. and Pedro, G. (1999) Contribution des argiles et des matières organiques à la rétention de l’eau dans les sols. Signification et rôle fondamental de la capacité d’échange en cations. Compte Rendu d’Académie des Sciences, 330, 245-250.
- US Salinity Laboratory Staff (1954) Diagnosis and improvement of saline and alkali soils. USDA Handbook.
- Bruand, A., Duval, O., Gaillard, H., Darthout, R. and Jamagne, M. (1996) Variabilité des propriétés de rétention en eau des sols. Importance de la densité apparente. Etude et Gestion des Sols, 3, 27-40.
- Shainberg, I. and Letey, J. (1984) Response of soil to sodic and saline conditions. Hilgardia, 52, 1-57.
- Le Bissonnais, Y. (1988) Aggregate stability and assessment of soil crustability and erodibility. I. Theory and methodology. European Journal of Soil Science, 47, 425- 437. doi:10.1111/j.1365-2389.1996.tb01843.x
- Yousaf, M., Ali, O.M. and Rhoades, J.D. (1987) Clay dispersion and hydraulic conductivity of some salt-affected arid land soil. Soil Science Society of America Journal, 51, 905-907. doi:10.2136/sssaj1987.03615995005100040013x