Agricultural Sciences
Vol.3 No.1(2012), Article ID:16847,10 pages DOI:10.4236/as.2012.31015
Resilience, reliability and risk analyses of maize, sorghum and sunflower in rain-fed systems using a soil moisture modeling approach
![]()
Water Research Group, Department of Geology, Faculty of Science, University of Botswana, Gaborone, Botswana; alemaw@mopipi.ub.bw, bfalemaw@gmail.com
Received 7 September 2011; revised 14 November 2011; accepted 15 December 2011
Keywords: Resilience; Reliability; Risk analysis; Agricultural drought index; Rain-fed agriculture; Soil moisture modeling; Limpopo basin
ABSTRACT
This paper is aimed at examining the applicability of methods for resilience, reliability and risk analyses of rain-fed agricultural systems from modeled continuous soil moisture availability in rain-fed crop lands. The methodology involves integration of soil and climatic data in a simple soil moisture accounting model to assess soil moisture availability, and a risk used as indicator of sustainability of rain-fed agricultural systems. It is also attempted to demonstrate the role of soil moisture modeling in risk analysis and agricultural water management in a semiarid region in Limpopo Basin where rain-fed agriculture is practiced. For this purpose, a daily -time step soil moisture accounting model is employed to simulate daily soil moisture, evaporation, surface runoff, and deep percolation using 40 years (1961-2000) of agro-climatic data, and cropping cycle data of maize, sorghum and sunflower. Using a sustainability criterion on crop water requirement and soil moisture availability, we determined resilience, risk and reliability as a quantitative measure of sustainability of rain-fed agriculture of these three crops. These soil moisture simulations and the sustainability criteria revealed further confirmation of the relative sensitivity to drought of these crops. Generally it is found that the risk of failure is relatively low for sorghum and relatively high for maize and sunflower in the two sites with some differences of severity of failure owing to the slightly different agro-climatic settings.
1. INTRODUCTION
Rainfall is the main source of water for raising crops in Africa despite the greatest problem of tremendous variability in rainfall from year to year and season to season. Rain-fed agriculture based to a large extent on small-holder, subsistence agriculture is a source of livelihood of the majority of the population in sub-Saharan Africa. An estimated 38% of the population in sub-aharan Africa (roughly 260 million people) lives in droughtprone drylands [1]. Sustainability of rain-fed agriculture is a challenge for most agricultural areas for production of food for their communities. One of such areas in Botswana where rain fed agriculture, mainly maize, sorghum and sunflower is practiced are Palapye and Bobonong districts in SE Botswana, which are considered in this manuscript as case study sites.
In such arid and semi arid regions, understanding the degree of sustainability of rain-fed agriculture is an important research area for agricultural planning, management and decision making. Soil moisture modeling plays a major role in the study of availability of soil moisture to crops. This study is devoted to studying the agricultural sustainability of growing maize, sorghum and sunflower in north-eastern Botswana by employing a sustainability criteria based on crop water requirement and soil moisture availability during the cropping periods of these crops. The criteria used were based on indices of risk, reliability and resilience to develop a quantitative measure of sustainability.
In agricultural water management, the most important decision criteria is to determine the level of soil moisture and its reliability to sustain crop growth without excessively depleting the available soil moisture storage. Agricultural water management includes water harvesting that involves all methods for concentrating, storing, and collecting surface runoff water in different media for agricultural uses. A common straight-forward definition of water harvesting is collection of runoff for productive use [2]. Runoff can be collected from roofs or ground surfaces (rainwater harvesting) as well as from seasonal streams (flood water harvesting) [3].
In order to study the soil-crop-atmosphere water and energy balances, the soil-vegetation-atmospheric transfer (SVAT) models are commonly employed whose main concept is useful to identify the different hydrological processes that account for runoff production, soil moisture and crop water requirement. The core element of SVAT schemes is the soil hydrology scheme [4], which is used to determine the partitioning of rainfall into infiltration, runoff, drainage, and storage within the soil. Large scale soil moisture data are available from soil-water retention parameters, hydrological model and remote sensing data at the southern African scale [5] as well as from remote sensing (ERS scatterometer) and soil data at a global scale [6]. The use of such data has shortcomings in its spatial and temporal scale to study and understand the soil-plant relations at localized scale such as the Palapye and Bobonong agricultural districts considered in this study.
The soil and water assessment tool (SWAT) remains a typical tool used for agricultural land and water modeling applications. SWAT is a physically based, continuous model that simulates the impact of land management activities on water, sediment, pesticide, and nutrient yields. However, SWAT was initially developed for the comprehensive modeling of the impacts of management practices on water yield, sediment yield, crop growth, and agricultural chemical yields in large complex watersheds [7]. Although SWAT is generally applied to large river basins, many studies have used it to simulate annual water and sediment yield at both the river basin and small watershed scale [8,9]. SWAT is a semi-distributed model partitioned into a number of subwatersheds or subbasins. Runoff is predicted separately for each hydrologic response unit (HRU) using the curve number (CN) method or the Green-Ampt method, and routed to obtain the total runoff at the outlet of watershed [10].
Plant response to sub-optimal levels of soil moisture has been a subject of research conducted for several decades. Plant physiological responses to water stress and the underlying mechanisms are available in [11,12]. Specific studies were conducted to assess, on a more practical level, the response of single crops to various water stress levels, for example in sorghum [13]. The Food and Agricultural Organization (FAO) of the United Nations has compiled the experience, practices, and guidelines on crop water requirement and crop evapotranspiration [14-16].
The DSSAT (Decision Support System for Agrotechnology Transfer) model is widely used and particularly well suited for simulating agricultural practices [17]. Other models have been developed with various degree of complexity for understanding water balance and soil climate estimates, a typical approach from recent example being the SoilClim model [18]. A deterministic simplified continuous simulation model for investigating long-term soil moisture fluctuations provided in [19] also made evaluation of detailed modeling approaches in soil moisture modeling.
The objective of the manuscript are: 1) to report on the application of a model for simulation of daily soil moisture using a soil moisture accounting crop-specific (SMACS) model, for growing of maize, sorghum and sunflower under rain-fed conditions in the two agricultural districts in Botswana by considering rooting depth, soil moisture characteristics, cropping period, and crop cycle coefficients data based on [14], and other local hydro climatic data; 2) to undertake a thorough assessment of soil-water-plant relationships and determine the proportion of available moisture content to sustain crop growth during the entire crop cycle of each crop from daily simulation at daily time steps for the period 1961- 2000; and 3) to assess and report on the relative degree of sustainability of these crops under rain-fed conditions using quantitative measures of resilience, reliability and risk, and demonstrate their use as quantitative agricultural drought indicators.
2. MATERIALS AND METHODS
2.1. The Soil Moisture Accounting Crop-Specific (SMACS) Model
A spreadsheet program called Soil Moisture Accounting Crop-Specific (SMACS) model is applied in this study in order to determine soil moisture variation and to assess the extent of soil moisture available to plants through the simulation of daily soil moisture. An earlier version of the model is found in [20] in which the approach followed is similar to the daily soil moisture accounting model of [21], which is commonly known as Simulator for Water Resources in Rural Basins (SWRRB) —a version of the SWAT model [8]—but with some modifications to few components in order to align with nature of data available to this study.
The basis of the SMACS model is the accounting of the daily moisture with the major terrestrial and atmospheric inputs of rainfall and potential evapotranspiration, along with the soil water retention properties and crop development factors. The model simulates the soil moisture of the farming areas of the Palapye and Bobonong agricultural districts area, in the Limpopo basin. A description of the SMACS model and its components is outlined as follows.
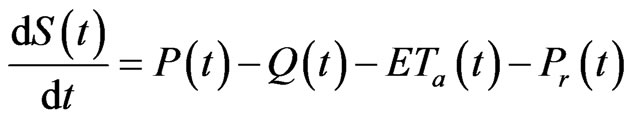
In the SMACS model [20], the soil moisture is modelled based on the continuity equation given by:
 (1)
(1)
This can be reduced to a simple water balance equation as:
 (2)
(2)
In which on a daily time scale, at day t, S(t) is the soil moisture content (mm), (t) is the amount of precipitation (mm/d), Q(t) is the amount of generated surface runoff (mm/d), ETa(t) is the actual evapotranspiration (mm/d), and Pr(t) is the percolation (mm/d) beyond the root zone.
Surface runoff is estimated using modification of the USDA Soil Conservation Service (SCS) Curve Number (CN) technique [22]. The CN is adjusted based on antecedent soil moisture conditions where the prevailing soil and land use is used to select a base CN. The reference evapotranspiration (ETo) was determined using the modified Penman-Monteith formula [15].
During a growing season the daily actual evapotranspiration, ETa = ETo*Kc*Ks where Ks the soil coefficient [14], and Kc is the crop coefficient at different growing stages of the crops considered in the study, estimated from the length of the growing period (LGP), as described in [11,14]. Percolation is estimated as that amount of water available when soil moisture of a given day in excess of the field capacity, and that satisfies the mass-balance equation, Eq.2.
Crop type, soil characteristics, rainfall, and climate are integrated in the soil water balance model to simulate a soil moisture regime assuming a particular crop at a time. For a crop under consideration, the mass-balance equation, Eq.2 was solved for the entire daily rainfall and temperature record period of 1961-2000. The analysis starts just before the beginning of the rain season so that the initial soil moisture can reasonably be assumed to be at wilting point (WP). During the cropping season of each crop the model further assumes a linear variation between the ratios of actual to reference crop evapotranspiration and simulated soil moisture when the later ranges between wilting point and field capacity.
2.2. Plant Water Use and Risk Assessment
The crop water requirements of the selected crops for known soil-water retention and crop characteristics must be determined. The purpose of the assessment of soilwater-plant relationships is primarily to estimate the mean frequency of water application or irrigation. This will in turn determines the level of soil moisture availability to cause stress to the crops. If analysis is based only on dry-spell analysis of rainfall, it determines the dry-spell duration longer than which will cause damage to crop yield.
The crop water requirements is the consumptive use of water by plants (ECROP), which is the same as the actual evapotranspiration, ETa described in Eq.2 during the cropping season of each crop. The daily ECROP is determined using SMACS model [20] in which the crop reference evapotranspiration is an input along with daily rainfall, soil-water retention parameters, and crop growth factors.
The frequency of crop water application (I), whether it is through irrigation or rainwater, is estimated using the formula in [16]:
 (3)
(3)
In which p is the fraction of total available soil water which can be used by the crop without affecting its transpiration and/or growth; Sa is total available soil water or moisture (SFC − SWP) in mm/m; SFC is available soil water or moisture at field capacity in mm/m; SWP is the available soil water or moisture at permanent wilting point in mm/m; and D is the depth of root zone of the crop (mm).
Not all the water that is held in the root zone between SWP and SFC is available to the crop. The depth of water (d) that is readily available to the crop is pSa and it is related to the depth of application or the water applied in the form of naturally available rainfall by the following equation:
 (4)
(4)
where fa is the water application efficiency (fraction). The value of fa translates to a measure of the degree of effectiveness of the available water reaching the root zone. The value of pSa will vary with the level of evaporative demand. Since the evaporative demand varies with the growing stages of crops, pSa will be different with different growing stages of a given crop, which is considered in the evaluation of different crops.
2.3. Plant Water Use and Risk Assessment
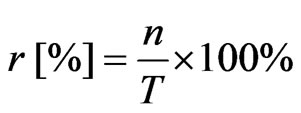
There is clear evidence showing that soil fertility constraints often constitute the primary limiting factor to crop growth also in drylands [23]. The current approach relies on the availability of soil moisture, which is an integrating variable for the underlying hydroclimatic and agronomic factors of rain-fed agricultural areas. The risk level for sustenance of rain-fed systems can be determined as a probability at which soil moisture (S) drops below a given moisture threshold (SWP + dt) during the crop’s LGP. The risk factor for the entire growing period (simulation period) of crops under rain-fed conditions can be calculated as defined as:
 (5)
(5)
where n is the number of days in which actual soil moisture S, drops below the critical soil moisture threshold (SWP + dt) during the total number of days (T) of the entire cropping period. In a period of years of analysis considered, T in days becomes the product of the number of the simulated years and the length of the growing period (LGP) in days.
The risk factor here is the same as the probability of failure which refers to the proportion of days to the total number of days or the length of the growing period (LGP), within which the simulated soil moisture drops below the amount which is set at p times the readily available soil moisture content (SFC − SWP) as stated in Eq.4. If other agricultural conditions such as land management and nutrient availability are not altered, then this risk factor integrates the prevailing hydroclimatology, soil moisture availability and crop-soil-water conditions, to assess sustainability of various crops under rain-fed conditions.
For assessment of soil moisture reliability and sustainability of rain-fed systems, we recommend a set of indices that are used as quantitative measures of agricultural drought. The indices measure reliability, risk of failure and resilience for classifying and assessing the sustainability of rain-fed agricultural systems. Reliability is a measure of frequency or probability that a system is in a satisfactory state meeting a given criterion. Resiliency generally indicates a measure of how quickly a system recovers from failure once failure has occurred. The computational scheme for these indices in this study is almost similar to that of [24-26], specifically tailored for indexing agricultural drought, analyzing risks and sustainability of rain-fed systems.
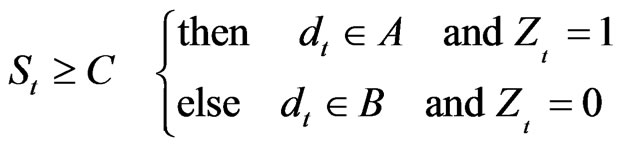
Defining a criterion (C) as the minimum required soil moisture from a rain-fed agricultural system, the daily soil moisture depth (dt) can be classified as a satisfactory state (A) or a failure state (B), i.e.,
 (6)
(6)
where Zt is a generic indicator variable. The daily available moisture content shown in Eq.4 was used as a criterion and, thus, system failure occurs when soil moisture is below the criterion at any given day.
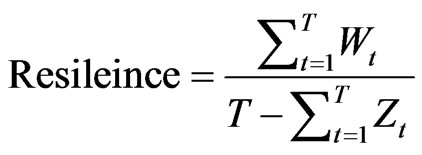
Another indicator, Wt which represents a transition from A to B, is defined as:
 (7)
(7)
The reliability, risk and resilience during the total time period (T) which is the sum of Length of Growing Period in a simulation period which can be defined as:
 (8)
(8)
 (9)
(9)
Literally value of risk calculated by Eq.5 can also be calculated as:
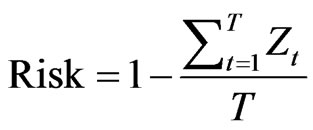 (10)
(10)
In engineering, these indices were previously used to evaluate reservoir operations [24,27] and water distribution systems [28] managing water quality of a river [25] as well as assessing climate change impacts on water resource systems [26]. This study examined the percentage changes in these indices computed for 10 year segments of the 40 years of analysis. These indices can suggest the degree of sustainability of rain-fed agricultural systems to support dry-land agriculture.
2.4. The Study Area and Data Used
In order to test the applicability of these indices in terms of characterizing sustainability of rain-fed agricultural practices, we considered Serowe and Bobonong agricultural districts in North-Eastern Botswana. The two agricultural districts considered in this case study located in the upland catchment within the Limpopo drainage basin, that is located between longitude 25030’-29030’E and latitude range of 20030’ to 21030’S. The 1961-2000 annual average rainfall over these districts (Palapye and Bobonong), calculated from Serowe and Bobonong rainfall records is 428 mm and 351 mm. with standard deviation of about 171 mm and 153 mm, respectively. The soil texture ranges from fine to course material and a predominately sandy loam soil type was considered for the two districts. There is lower to moderately medium drainage sloping generally to the Limpopo river drainage system that averages 0.5%. The predominant land use in the watershed is Shrub Savannah mixed with cultivation and plantation.
Historical precipitation of 40 years (1961-2000) daily record, and daily/monthly climatic data at stations found in close-by stations at Serowe and Bobonong were used. Length of cropping period and crop coefficients used in the SMACS model is adopted from [14]. Soil water retention properties of the clay loam soil within the active root zone of the crops is used based on unit water retentions for given soil texture according to [29].
The main reason for considering the two districts was to develop a conceptual framework for agricultural districts with slightly different agroclimatic conditions where slight interventions can results in improved agricultural practices given the current government’s plan to improve rain-fed agric productivity in the country: The salient characteristics of soil and crop yield in the study area are provided in Table 1.
3. RESULTS AND DISCUSSION
3.1. Application of Daily Moisture Simulation Model, SMACS
In this section, first the daily moisture accounting crop-specific (SMACS) model was applied in the study area. The model needs an initial soil moisture condition which was first assumed equal to SFC by starting the simulation with a wetter date/month, and it was optimized with a fractional value of the above soil moisture limit, until a minimum error was found in the simulated soil moisture between the beginning and end of the simulated hydrological year. Initial soil moisture and average annual soil moisture change between the beginning and end of the simulation years obtained for the three crop types is summarized in Table 2. The optimization covered all the first 10 years (1961-1990) record for the calibration of the model and the remaining 10 years (1991-2000) was used for model validation.
3.2. Simulated Soil Moisture and Resilience, Reliability and Risk Analysis
A number of factors affect proper crop growth and its yield apart from soil water. Among others are nutrient availability, seed variety and agricultural practice. However, the most important decision criteria adopted in this study is to determine the level of soil moisture and its reliability to sustain crop growth without excessively depleting the available soil moisture storage. Based on Eq.4, considering a water application efficiency of one hundred percent with the assumption that the rainwater is uniformly and well applied to the gentle slope and clays dominated plains of the Palapye and Bobonong agricultural districts area, one can determine the extent of fail
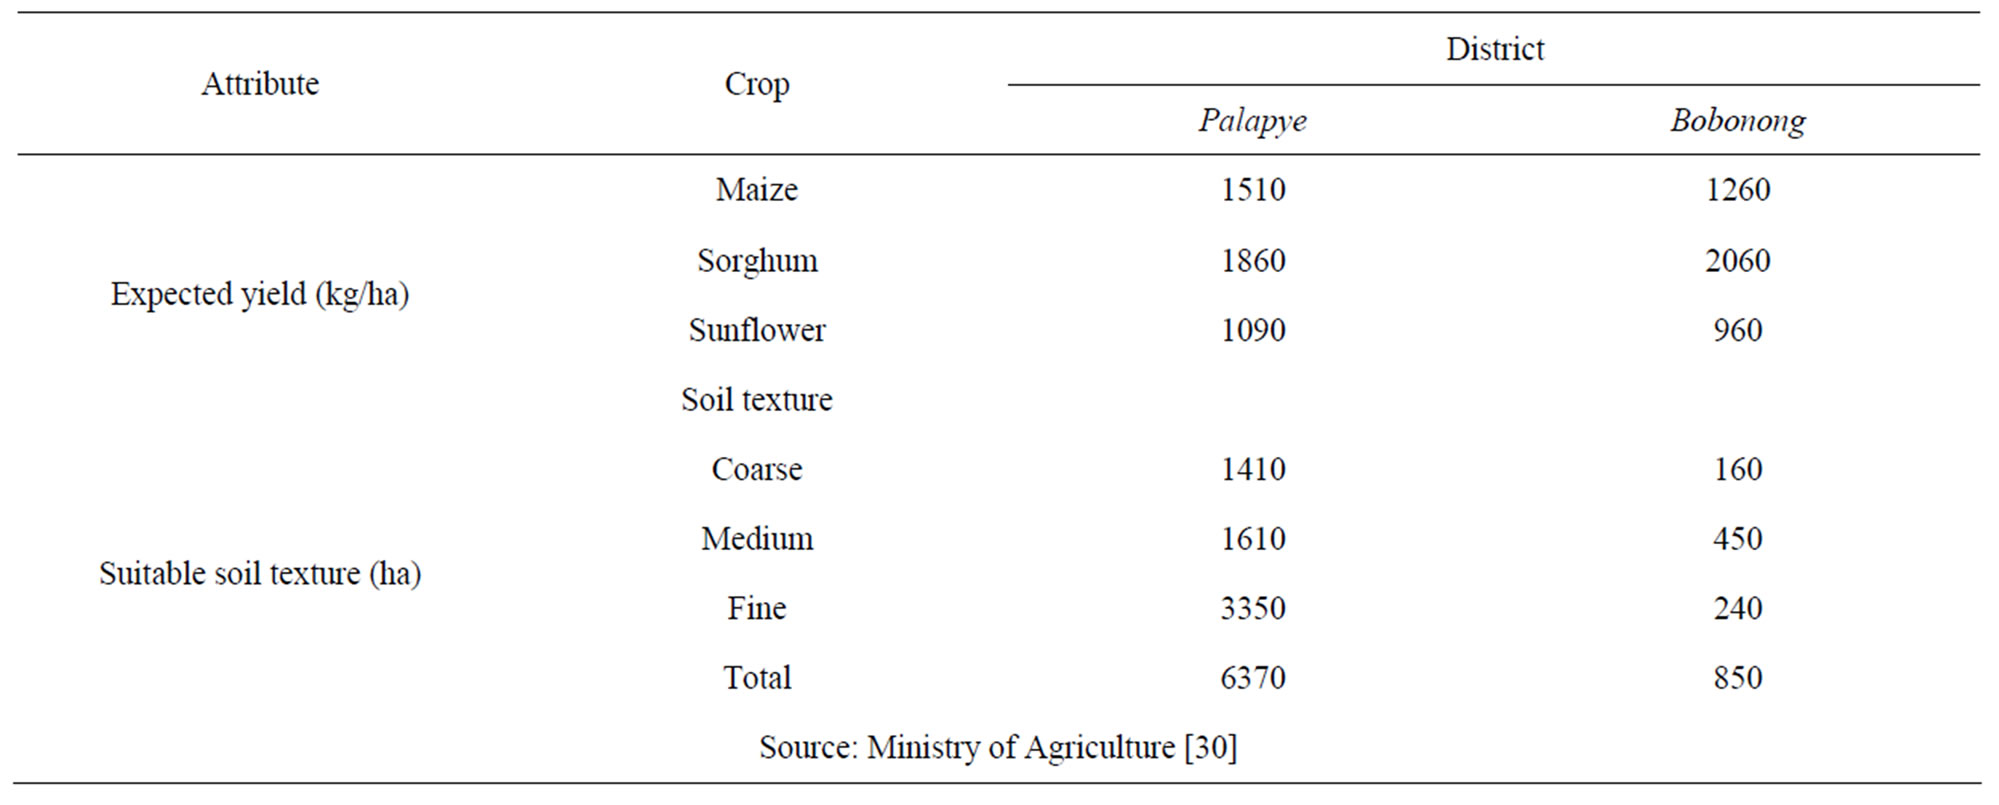
Table 1. Expected yield and soil types in the two districts of the study area.
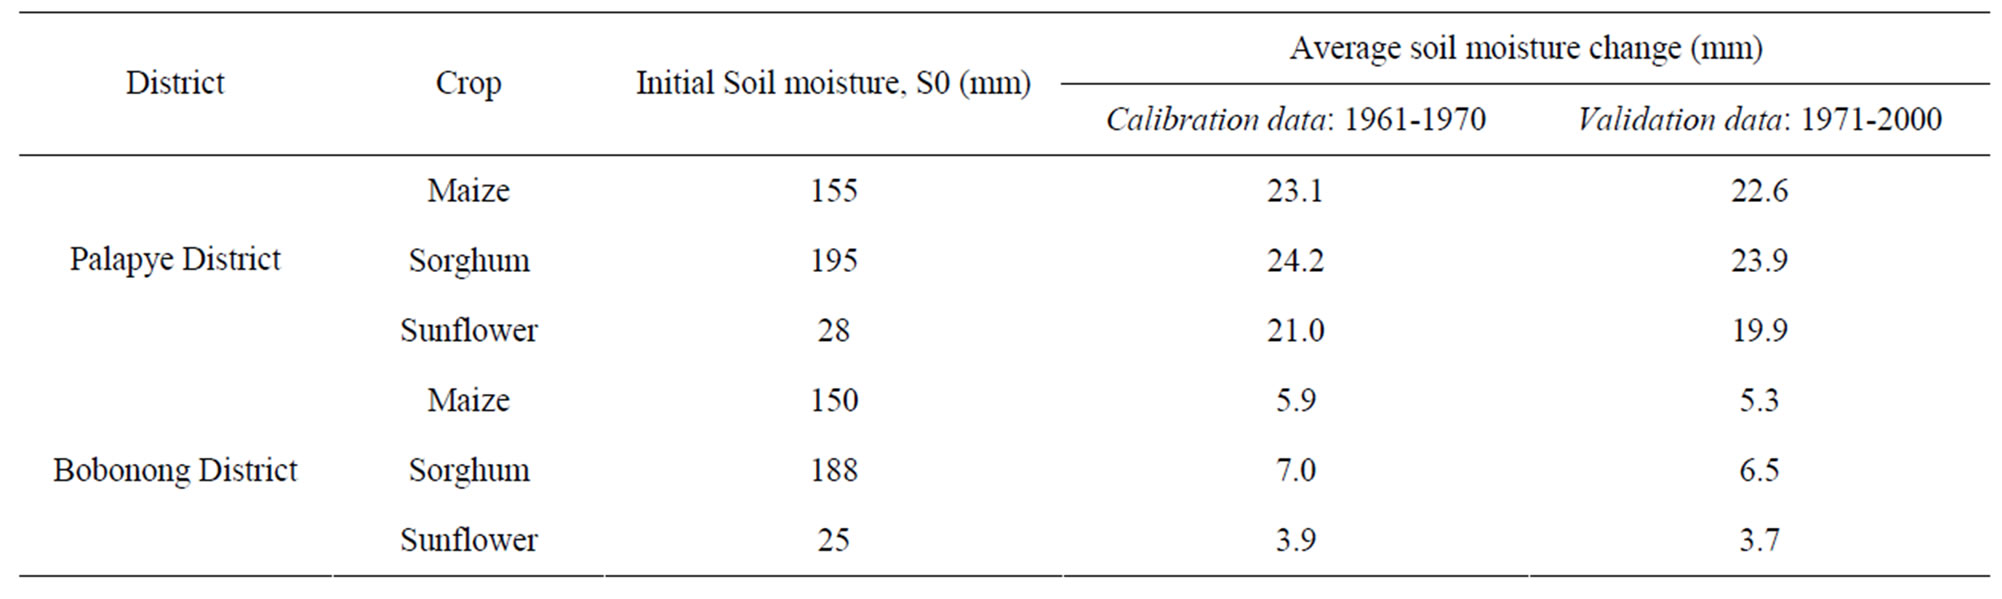
Table 2. Initial soil moisture (mm) and average annual soil moisture change (mm) between the beginning and end of the simulation years optimized by the SMACS model.
ure of soil moisture to sustain crop growth and yield in this catchment.
The simulated daily soil moisture distribution (exceedence probabilities) throughout the growing season of maize, sorghum and sunflower with respect to the 20% of readily available soil moisture regime (p = 20%) is shown in Figure 1. Simulation cases for the sustainability analysis of rain-fed systems in terms of the three indices that attribute to probability of failure of the actual daily moisture, in proportion p to the readily available soil moisture content during the cropping period of each crop that is used as a criterion is summarized in Tables 3-4. Table 3 is the ideal condition where the plants are at critical stress limit where p is zero. In this case, the probability of failure is very low for both maize and sorghum.
The risk factor basically represents the proportion of days to the total number of days or the length of the growing period (LGP), within which the simulated soil moisture drops below the amount which is set at p times the readily available soil moisture content (SFC − SWP) as stated in Eq.4. In other words p is to set a soil moisture threshold. We evaluated the moisture stress limits against the simulated soil moisture values through counting of number of days whose soil moisture values drop below the soil moisture amount whose threshold value is set at p times the readily available soil moisture content as stated in Eq.4, also shown in Figure 2. Counted number of days whose soil moisture drop below the threshold soil moisture through out the period of analysis during the cropping cycle of each crop or days of LGP was used to calculate the number failure days and the various indices are summarized in Table 4.
From Table 4, it can be noted that without prejudice to the critical stress limit required for each crop, which depends also on nutrient and farming practice, it can be said that at modest moisture level say at 10%, the probability of failure of maize is higher than that of sorghum.

Figure 1. The relative distribution of simulated soil moisture (1961-2000) with p = 20% for maize, sorghum and sunflower in Palapye agricultural district.
The risk factor or the probability of failure on the average for maize, sorghum and sunflower in Palapye is respectively, 7.8%, 5.2% and 7.2% during the period 1961-1970, and 5.8%, 2.7% and 8.3% during the period 1971-2000. These relative soil moisture levels indicate a relative sensitivity to drought of maize than sorghum, which is in conformity with the Agromisa recommendations in which sorghum is having very high level of drought tolerance compared to maize and next to sunflower. For Bobonong district these figures are relatively lower than those of Palapye owing to the different agronomic and prevailing climatic variations.
For the same crop generally Bobonong displayed higher risk, lower reliability and resilience compared to Palapye. Risk, reliability and resilience of maize simu-

Table 3. Simulated risk, reliability and resilience levels (%) for maize, sorghum and Sunflower at soil moisture level, p = 0% in proportion to the readily available soil moisture.
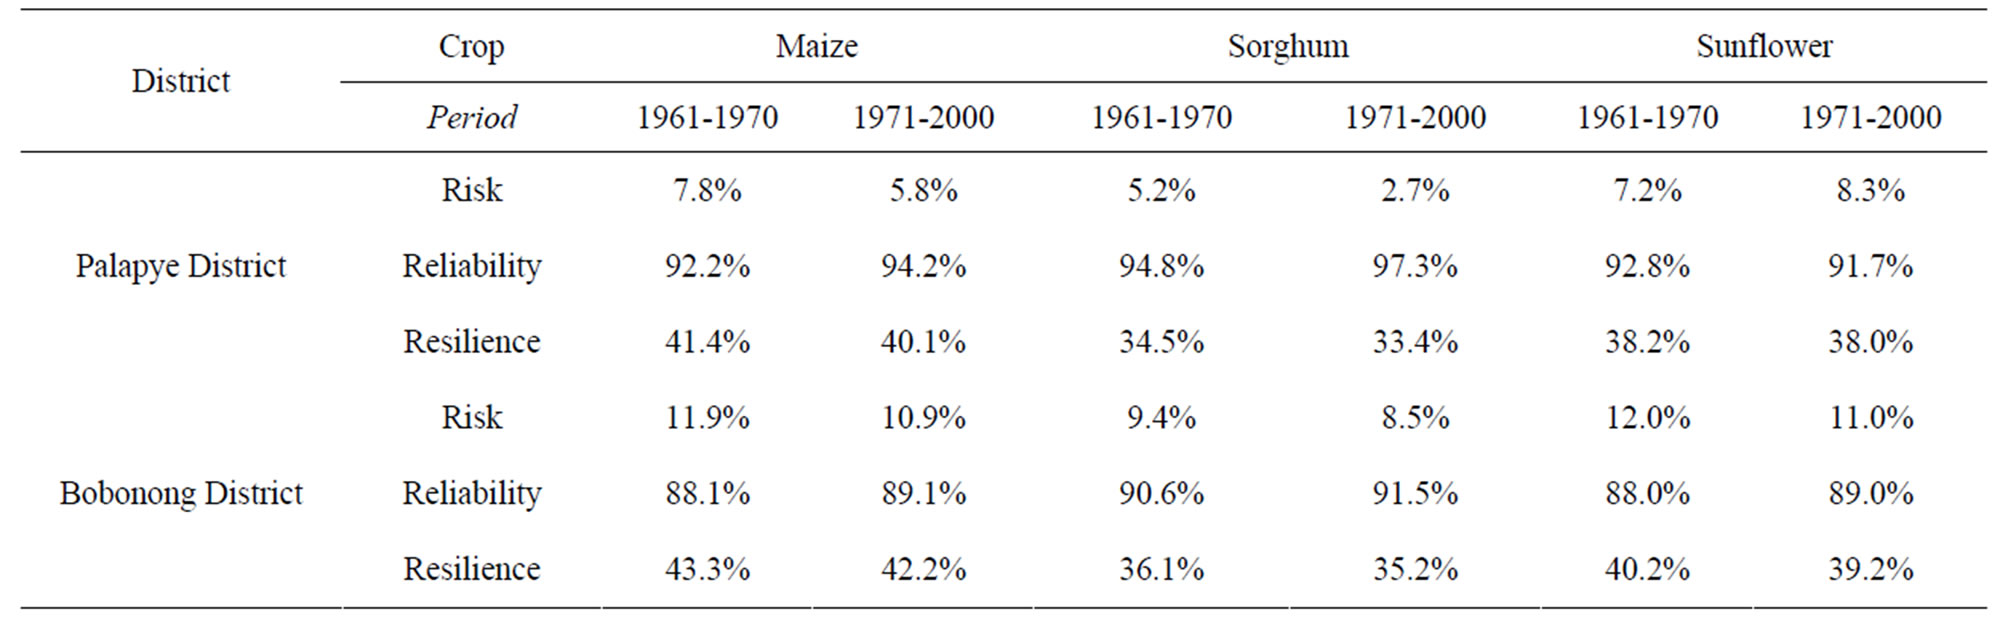
Table 4. Simulated risk, reliability and resilience (%) of maize, sorghum and Sunflower for available soil moisture factor, p = 10% in proportion to the readily available soil moisture.
 (a)
(a) (b)
(b)
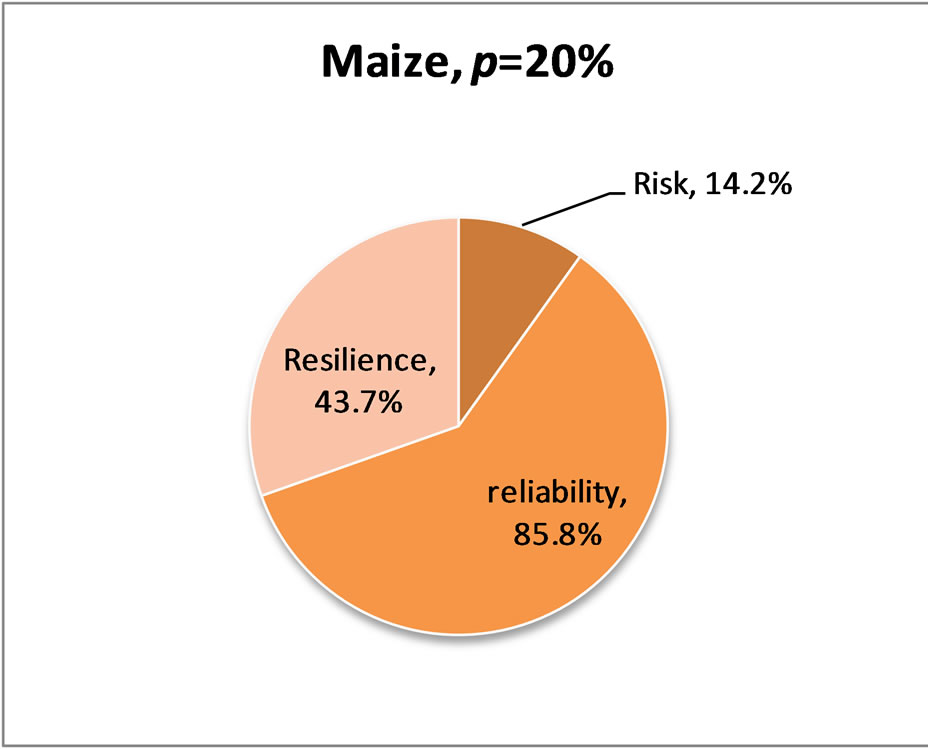
Figure 2. Simulated relative risk, reliability and resilience of maize with available soil moisture factor, p = 20% in the period 1961-2000 for (a) Palapye district and (b) Bobonong district.
lated from the entire 1961-2000 daily record and taking the actual cropping length, at available soil moisture factor, p = 20% for Palapye District and BoBonong Districts is shown in Figure 2.Similarly, Figure 3 shows the same for soil moisture factor, p = 30%.
On the other hand, risk, reliability and resilience of maize, sorghum and sunflower cropping under rain-fed conditions with available soil moisture factor, p = 10% in Palapye District is presented in Figure 4. It can be noted from these figures that the reliability and risk of failure of these crops in the study area portray a relative sensitivity to drought (their drought tolerance limit). Generally the risk of failure or probability of failure is low for sorghum and higher for maize and sunflower. The higher the reliability is for a crop, the lesser its resilience, and vice versa.
4. CONCLUSIONS
The application of the soil moisture accounting cropspecific (SMACS) model for simulation of daily soil moisture of agricultural areas proved appropriate in terms of closing of soil moisture from beginning to end of complete water cycle years of simulation that covered 1961-2000. Both the calibration and verification results in terms of the yearly average difference of the soil moisture at the beginning and end of each year for the calibration period (1961-1970) and verification period (1971-2000) which were reasonably closer to each other for the various crops in the study area. Two agricultural districts in SE Botswana located in watersheds of the Limpopo River Basin were considered as study sites.
By using a sustainability criterion of rain-fed agriculture based on availability of soil moisture adequate to sustain crop growth, SMACS was employed to explore the various degrees of soil moisture availability and reliability of growing of maize, sorghum and sunflower under rain-fed conditions as sole supply of water for agriculture. The SMACS model was applied with reasonable
 (a)
(a)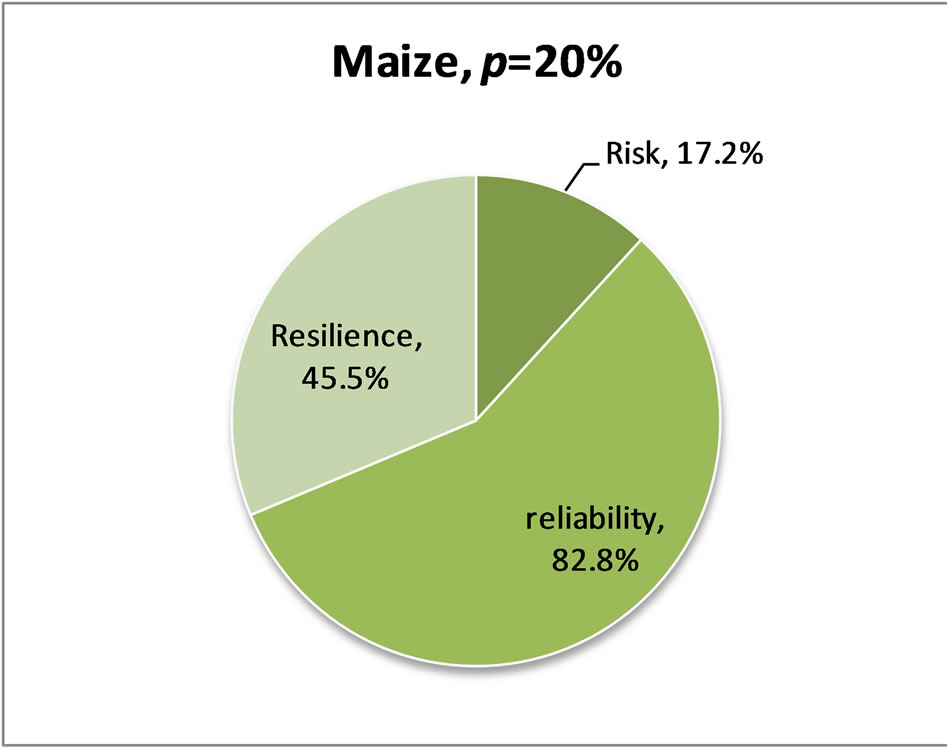 (b)
(b)
Figure 3. Simulated relative risk, reliability and resilience of maize with available soil moisture factor, p = 30% in the period 1961-2000 for (a) Palapye district and (b) Bobonong district.

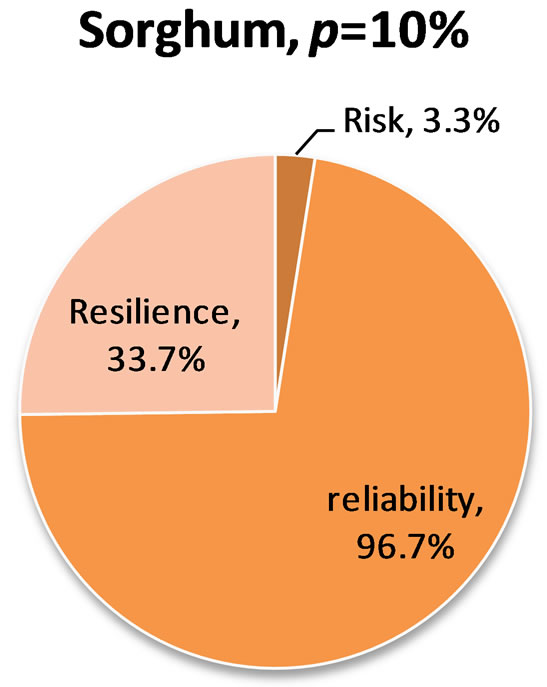

Figure 4. Simulated relative risk, reliability and resilience of maize, sorghum and sunflower cropping under rain-fed conditions for 1961-2000 with available soil moisture factor, p = 10% in Palapye District.
degree of success in the Palapye and Bobonong agricultural districts farming plains of Botswana. The relative reliability and risk of failure of these crops in the study area portray the general relative sensitivity to drought (the drought tolerance limit) of these crops. The risk of failure is low for sorghum and higher for maize and sunflower. The higher the reliability is for a crop, the lesser its resilience, and vice versa.
An added advantage of SMACS model, though not reported here at a district level is its ability determine excess rainfall and to explore rainfall harvesting opportunities at plot levels for improving improved rainwater management [20,31]. Local or scientific technologies depending on physical and technical conditions at the site can be explored to maximize in-situ excess water harvesting or soil moisture enhancement to improve rainwater productivity.
5. ACKNOWLEDGEMENTS
The authors appreciate part of the support of the University of Botswana for the research grant of the project ‘Development of Daily Precipitation Model for Botswana—A GIS Approach’ (Research Project Vote No. R025). The Department of Meteorological Services of the Botswana Government is also thanked for providing daily rainfall data. The Challenge Programme on Water and Food financial support for the research is greatly acknowledged. Minor technical support of the Water Research Centre for Africa is also appreciated.
REFERENCES
- UNDP/UNSO (1997) Aridity zones and dryland populations: An assessment of population levels in the world’s drylands with particular reference to Africa. UNDP Office to Combat Desertification and Drought (UNSO), New York.
- Siegert, K. (1994) Introduction to water harvesting: Some basic principles for planning, design, and monitoring. Water Harvesting for Improved Agricultural Production. Proceedings of the FAO Expert Consultation, Cairo, Egypt, 21-25 November1993, FAO, Rome, 9-23.
- Agromisa, (1997) Water harvesting and soil moisture retention. Technical Centre for Agricultural and Rural Cooperation (ACP-EU), Agrodok-series No. 13, Wageningen, The Netherlands, 91.
- Boone, A. and Wetzel, P.J. (1996) Issues related to low resolution modeling of soil moisture: Experience with the PLACE model. Global and Planetary Change, 13, 161- 181. doi:10.1016/0921-8181(95)00044-5
- Alemaw, B.F. and Chaoka, T.R. (2003) A continental scale water balance model: A GIS-approach for Southern Africa. Physics and Chemistry of the Earth, 28, 957-966. doi:10.1016/j.pce.2003.08.040
- Wagner, W., Lemoine, G. and Rott, H. (1999) A method for estimating soil moisture from ers scatterometer and soil data. Remote Sensing of the Environment, 70, 191- 207. doi:10.1016/S0034-4257(99)00036-X
- Arnold, J.G., Srinivasan, R., Muttiah, R.S. and Williams, J.R. (1998) Large area hydrologic modeling and assessment. Part I: Model development. Journal of American Water Resources Association, 34, 73-89. doi:10.1111/j.1752-1688.1998.tb05961.x
- Arnold, J.G., Srinivasan, R., Muttiah, R.S., Allen, P.M. and Walker, C. (1999) Continental scale simulation of the hydrologic balance. Journal of American Water Resources Association, 35, 1037-1052. doi:10.1111/j.1752-1688.1999.tb04192.x
- Harmel, R.D., Richardson, C.W. and King, K.W. (2000) Hydrologic response of a small watershed model to generated precipitation. Transactions of American Society of Agricultural Engineering, 43, 1483-1488.
- Neitsch, S.L., Arnold, J.G, Kiniry, J.R., Srinivasan, R. and Williams, J.R. (2002) Soil and water assessment tool, user’s manual, version 2000. TWRI Report TR-192, Texas Water Resources Institute, College Station, Texas.
- Doorenbos, J. and Kassam, A.H. (1979) Yield Response to Water. FAO Irrigation and Drainage Paper No. 33. Rome, Italy.
- Hsiao, T.C. (1973) Plant responses to water stress. Annual Review of Plant Physiology, 24, 519-570. doi:10.1146/annurev.pp.24.060173.002511
- Gardner, B.R., Blad, B.L., Gassity, D.P. and Watts, D.G. (1981) Relationship between crop temperature, grain yield, evapotranspiration and phenological development in two hybrids of moisture stressed sorghum. Irrigation Science, 2, 213-224. doi:10.1007/BF00258375
- Doorenbos, J. and Pruitt, W.O. (1979) Guidelines for predicting crop water requirements. FAO Irrigation and Drainage Paper No. 24, Rome, Italy.
- FAO (1998) Crop evapotranspiration: Guidelines for computing crop water requirements. FAO Irrigation and Drainage Publications No 56, Rome.
- FAO (1992) CROPWAT—A computer program for irrigation planning and management. FAO Irrigation and Drainage Publications No 46, Rome.
- Jones, J.W., Hoogenboom, G., Porter, C.H., Boote, K.J., Batchelor, W.D., Hunt, L.A., Wilkens, P.W., Singh, U., Gijsman, A.J. and Ritchie, J.T. (2003) The DSSAT cropping system model. European Journal of Agronomy, 18, 235-265. doi:10.1016/S1161-0301(02)00107-7
- Hlavinka, P., Trnka, M., Balek, J., Semerádová, D., Hayes, M., Svoboda, M., Eitzinger, J., Možný, M., Fischer, M., Hunt, E. and Zǎlud, Z. (2011) Development and evaluation of the SoilClim model for water balance and soil climate estimates. Agricultural Water Management, 98, 1249-1261. doi:10.1016/j.agwat.2011.03.011
- Nishat, S., Guo, Y. and Baetz, B.W. (2007) Development of a simplified continuous simulation model for investigating long-term soil moisture fluctuations. Agricultural Water Management, 92, 53-63. doi:10.1016/j.agwat.2007.04.012
- Alemaw, B.F., Chaoka, T.R. and Totolo, O. (2006) Investigation of sustainability of rain-fed agriculture through soil moisture modeling in the Pandamatenga Plains of Botswana. Physics and Chemistry of the Earth, 31, 960- 966. doi:10.1016/j.pce.2006.08.009
- Williams, J.R., Nicks, A.D. and Arnold, J.G. (1985) Simulator for Water Resources in Rural Basins. Journal of Hydraulic Engineering, 111, 970-986. doi:10.1061/(ASCE)0733-9429(1985)111:6(970)
- US Soil Conservation Service (1985) National engineering handbook, section 4: Hydrology. Soil Conservation Service, USDA, Washington DC.
- Klaij, M.C. and Vachaud, G. (1992) Seasonal water balance of a sandy soil in Niger cropped with pearl millet, based on profile moisture measurements. Agricultural Water Management, 21, 313-330. doi:10.1016/0378-3774(92)90053-Y
- Hashimoto, T., Stedinger, J.R. and Loucks, D.P. (1982) Reliability, resiliency, and vulnerability criteria for water resource system performance evaluation. Water Resources Research, 18, 14-20. doi:10.1029/WR018i001p00014
- Maier, H.R., Lence, B.J., Tolson, B.A. and Foschi, R.O. (2001) First-order reliability method for estimating reliability, vulnerability, and resilience. Water Resources Research, 37, 779-790. doi:10.1029/2000WR900329
- Fowler, H.J., Kilsby C.G., and O’Connell, P.E. (2003) Modeling the impacts of climatic change and variability on the reliability, resilience, and vulnerability of a water resource system. Water Resources Research, 39, 1222. doi:10.1029/2002WR001778
- Moy, W.S., Cohon, J.L., and ReVelle, C.S. (1986) A programming model for analysis of the reliability, resilience, and vulnerability of a water supply reservoir. Water Resources Research, 22, 489-498. doi:10.1029/WR022i004p00489
- Zongxue, X., Jinno, K., Kawamura, A., Takesaki, S. and Ito, K. (1998) Performance risk analysis for Fukuoka water supply system. Water Resources Research, 12, 13-30.
- Saxton, K.E., Rawls, W.J., Romberger, J.S. and Papendick, (R.I. 1986) Estimating generalized soil-water characteristics from texture. Soil Science Society of America Journal, 50, 1031-1036. doi:10.2136/sssaj1986.03615995005000040039x
- Ministry of Agriculture (2000) National master plan for agricultural development (NAMPAD). Government of Botswana, Tahal Consulting Engineers, 1, Main Report.
- Alemaw, B.F., Chaoka, T.R. and Totolo, O. (2006) Soil moisture modeling and application in agricultural water management in a semi-arid environment. In: Totolo, O. Ed., Environmentally Sound Technology in Water Resources Management, IASTED 2006 Proceedings, Gaborone, Botswana, 120-125.