Food and Nutrition Sciences
Vol. 4 No. 4 (2013) , Article ID: 30031 , 11 pages DOI:10.4236/fns.2013.44060
Testing the Efficacy of eGFP-Transformed Aspergillus flavus as Biocontrol Strains
![]()
Southern Regional Research Center, Agricultural Research Service, United States Department of Agriculture, New Orleans, USA.
Email: *geromy.moore@ars.usda.gov
Copyright © 2013 Geromy G. Moore et al. This is an open access article distributed under the Creative Commons Attribution License, which permits unrestricted use, distribution, and reproduction in any medium, provided the original work is properly cited.
Received February 5th, 2013; revised March 15th, 2013; accepted March 22nd, 2013
Keywords: Aspergillus; Biocontrol; Green Fluorescent Protein (GFP); Aflatoxin; Fungal Competition; Afla-Guard®; AF36
ABSTRACT
Current biological control methods to prevent pre-harvest aflatoxin contamination of corn, cottonseed, and ground and tree nuts involve field inoculation of non-aflatoxigenic Aspergillus flavus. To date, the efficacy of this approach requires annual reapplication of the biocontrol agent. The reason for this requirement is uncertain. To track the dispersal and test the longevity of these strains, we prepared fluorescent biocontrol strains by incorporating into them the gene expressing the enhanced green fluorescent protein (eGFP). We first investigated the effects of eGFP transformation on the ability of the fluorescent fungus to compete with its non-fluorescent homolog, and then with other heterologous non-aflatoxigenic strains as well as with aflatoxigenic isolates. Our findings indicate that, in these studies, detection of fluorescence was variable, with some fluorescent strains exhibiting enhanced growth and sporulation post-transformation. In our tests, not all transformed strains proved to be good candidates for tracking because their fluorescence was reduced over the course of our study. Most of the transformed strains retained fluorescence and showed robust colony growth in an artificial competitor environment; therefore, they should be suited for further trial under more natural settings. Our ultimate objective is to determine if out-crossing between biocontrol strains and native field populations is occurring in a natural setting.
1. Introduction
Species from Aspergillus section Flavi have the potential to contaminate agricultural commodities with carcinogenic mycotoxins such as aflatoxins. Research is ongoing to understand and prevent aflatoxin contamination, and thereby ensure the safety of our food and feed supply. Nearly a decade has passed since two pre-harvest biopesticides (AF36 and Afla-Guard®) were licensed by the Environmental Protection Agency (EPA) for use as biocontrol agents to prevent pre-harvest aflatoxin contamination. AF36 and the component strain in Afla-Guard® are A. flavus isolates that are unable to produce aflatoxins (AF−) because of either mutations in, or lack of, critical genes required for aflatoxin biosynthesis. For AF36, a point mutation in the aflatoxin biosynthesis gene pksA (aflC) is responsible for the AF− phenotype [1], while the Afla-Guard® strain (NRRL21882) is missing most of the genes in the 80 kb aflatoxin biosynthesis gene cluster up to the proximal telomere on chromosome 3 [2,3]. Field trials have shown that proper application of spores from these fungi greatly reduces the incidence of aflatoxin contamination in corn [4], cottonseed [5], and peanuts [6], and is being considered for use against contamination of tree nuts. The ability of these strains to reduce aflatoxin contamination has been postulated to be due to displacement of the aflatoxin-producing populations in the soil [5]. An alternate explanation is that contact (thigmotropism) between the AF− isolate and an aflatoxigenic (AF+) isolate causes the inhibition [7]. Other candidate strains for biocontrol are being developed for use on corn (K49 in Mississippi and KD17, KD19, and KD22 in Louisiana and Texas). All of these A. flavus strains produce large sclerotia (L-strain), and contain the Mat1-2 mating type idiomorph.
AF36 and K49 share identical sequence with regard to the pksA polymorphism, but K49 possesses a truncated hybrid polyketide synthase-nonribosomal peptide synthase gene in its cyclopiazonic acid (CPA) gene cluster, resulting from a chance mutation that introduces a stop codon [8], that renders it unable to synthesize CPA. Although AF36 retains the ability to produce CPA it is used for prevention of AF contamination in cotton, figs, and pistachios in Arizona and California [9,10]. The application substrate during treatment involves sterilized wheat seeds that have been colonized by the AF36 strain, and 10 pounds per acre is applied annually with an estimated cost of between $6 and $15 per acre [9]. The component strain in Afla-Guard®, NRRL21882, was first isolated from a peanut field in Georgia [11] and was initially used to protect peanut crops in Georgia. Since 2010, it has been marketed by Syngenta as a biocontrol strain for corn [12]. The application substrate involves hulled barley, rather than wheat, that has been colonized by NRRL21882. The annual application rate is 20 pounds, with an estimated cost of between $16 - $30, per acre [9]. Though not yet commercially available, K49 shows promise as a candidate strain for biocontrol of aflatoxin contamination of corn [12]. Biodegradable plastic has been used as an inexpensive substrate for production of the inoculum [13], but the application rate and the estimated cost for a grower to apply K49 each year has not yet been determined. KD17, KD19, and KD22 were isolated from a corn kernels harvested in Louisiana and Texas. The genetic basis for the AF− phenotype of these strains is uncertain. At this time, laboratory and greenhouse tests found that combined application of either KD17 or KD19 with NRRL21882 offered a more robust prevention of aflatoxin contamination compared to that achieved by application of each strain individually (Kenneth Damann, personal communication).
The long-term impact of introducing large amounts of these strains into fields to compete with native field populations of fungi has not been carefully studied. If the strains displace the native aflatoxin-producing population then there should not be a need to treat the fields annually, which is not the current practice. This consideration is of particular concern for control of aflatoxin contamination of corn where contamination usually does not occur every year. Another important consideration is that recombination may occur in natural populations of A. flavus [3]. There is in vitro evidence that mating can occur between individuals from natural field populations of Aspergillus, both within [14-16] and between [17] aflatoxin-producing species; furthermore, aflatoxigenicity can be re-introduced into the biocontrol strain by recombination [18]. This consideration is important because there is a risk that a recombinant AF+ strain may have an even greater potential for contamination as a result of its unique ability to out-compete native populations of fungi. Annual applications of the biocontrol strain may partly offset such a possible scenario, but this approach may become ineffective after multiple years of reapplication.
To determine the longevity of biocontrol populations introduced into the field and their ability to out-cross after application, we have developed fluorescent-tagged biocontrol strains of the most commonly used isolates. Our current study explores the ability of such biocontrol strains to be recovered after exposure to non-fluorescent biocontrol strains or wild-type aflatoxin-producing strains when the competition is performed under controlled laboratory conditions. This study is meant to be preliminary to assessing recovery of similar strains introduced into agricultural fields, and to tracking the ability and frequency of out-crossing of these strains with natural populations. Based on this study we find that introduction of a fluorescent marker into most of these biocontrol strains does not impair their abilities to self-compete or to compete with aflatoxin-producing strains.
2. Materials & Methods
2.1. Biocontrol and Competitor Strains
Strain NRRL21882 was obtained from the SRRC fungal collection. The AF36 strain was purchased from the ARS Culture Collection at the National Center for Agricultural Utilization Research (NCAUR) in Peoria, IL. The K49 and three KD strains were acquired from Dr. Kenneth Damann at Louisiana State University. For all strains, the species designation as A. flavus species that are considered large-sclerotium producers, as well as their mating-type idiomorph, had been previously reported or examined. The toxigenic strains used for the competition experiment included two A. flavus strains (SRRC1000-F, SRRC41) and three A. parasiticus strains (SRRC143-A, SRRC1032, SRRC2043). Information for the toxin profiles of all strains is shown in Table 1.
2.2. Molecular Investigation
For each wild type isolate, a flask containing 75 mL of potato dextrose broth was inoculated with 500 µl of fungal spore suspension. Flasks were agitated in an orbital shaker at 30˚C (130 rpm) for approximately 24 hours to accelerate the growth of mycelia. DNA was then extracted from harvested mycelia using the MasterPureTM Yeast Purification Kit (Epicentre Biotechnologies). The main genomic region of interest for this study is an upstream portion of the aflatoxin cluster between the aflF (norB) and aflU (cypA) genes. It has been reported that not only can the aflF/aflU region be used to segregate B and G aflatoxin producers [19] it can also offer information relating to sclerotial genotype for A. flavus [20]. To confirm the genetic basis for the sclerotial genotype of each strain, the intergenic region between the aflatoxin cluster genes aflF and aflU was amplified using the protocol of Ehrlich and co-workers [19]. An A. flavus L-strain genotype will result in an amplicon size of ap-
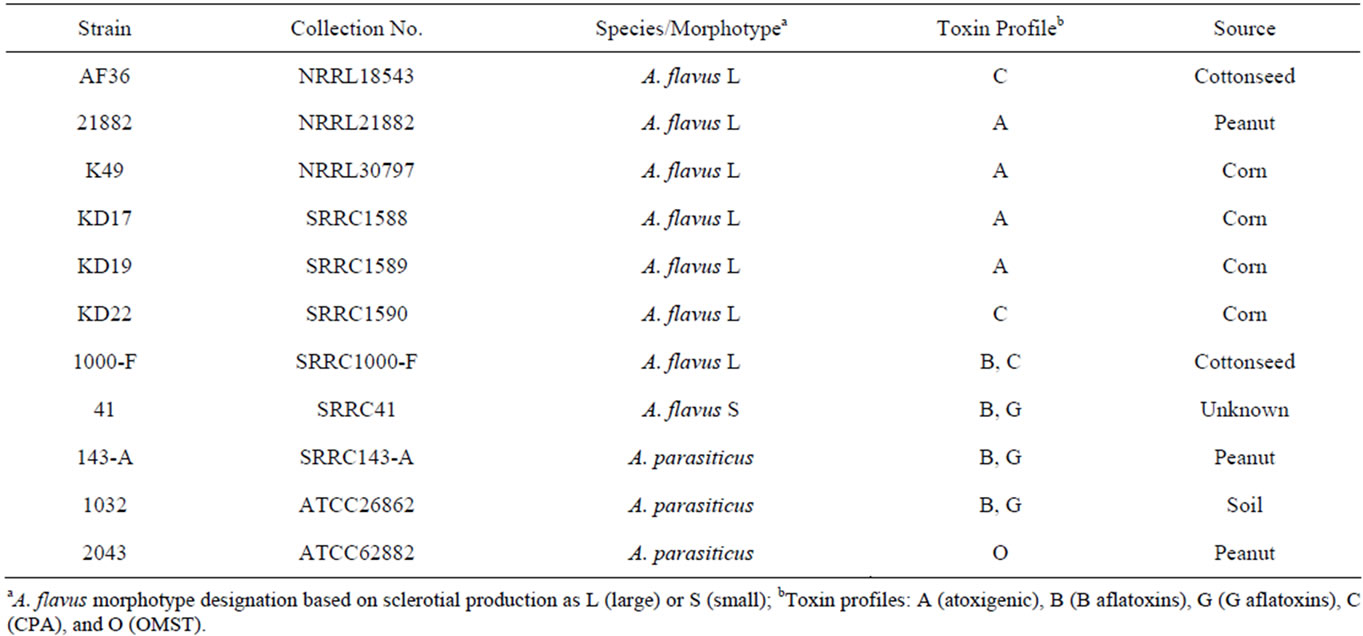
Table 1. Species and toxin information for competitor strains.
proximately 1 Kb, whereas an SB-strain (producer of only B aflatoxins) genotype will amplify a product of approximately 300 bp. Any isolate that produces B and G aflatoxins (A. parasiticus or A. flavus SBG) will result in an amplicon size of approximately 1.8 Kb. The mating type idiomorph for each strain in this study was also investigated following the diagnostic protocol as in Ramirez-Prado et al. [21].
2.3. Fungal Transformation with eGFP
The six AF− strains were co-transformed with pPTRI (Takara) and puc18-A.n.-GPD promoter-eGFP-nmt1 terminator [22] and selected for on pyrithiamine media. Transformations were done as previously described [23]. Fluorescent transformants were single-spored twice.
2.4. Experimental Design
A preliminary comparison for stability of the wild type (W) and transformed (T) isolates was performed for the biocontrol strains AF36 and NRRL21882 involving the following pairs: AF36 T/AF36 W, NRRL21882 T/NRRL21882 W, AF36 T/NRRL21882 W, and NRRL21882 T/AF36 W. A total of 104 spores per mL, from each pair of fungi, were co-inoculated on a potato dextrose agar plate and incubated in darkness at 30˚C. Resulting conidia were sampled from the colonies at 2, 6, 13, and 20 days after inoculation, and aliquots were diluted in 0.01% Triton X-100 for re-inoculation of colonies, developing from single spores, on Czapek’s (CZ) agar. After two days of incubation at 30˚C, the resulting colonies were examined for fluorescence and then counted. The next experimental component was to determine whether or not the eGFP transformation would 1) be successful and fluoresce, and 2) affect the individual growth of the six AF− strains. CZ plates were singlepoint inoculated for each W individual as well as each T individual. The plates were incubated in darkness at 25˚C for approximately eight days. Starting at day 4, each of the colonies was measured, to compare the W and T growth rates, and photographed in both white light and long-wave UV light (365 nm) to compare fluorescence. The final component of this study sought to test the aggressiveness of each T strain in the presence of host tissue and a competing microbe such as a its W parent, a different T strain or a toxigenic strain. This involved a single, surface sterilized (40% bleach with 0.001% Triton), and delinted cottonseed (Stoneville 7A) embedded in the center of a CZ plate. The competitor strains were then equidistantly single-point inoculated on opposite sides of the cottonseed with standard spore concentrations ranging between 1.35 and 2.6 × 10⁶ spores per mL. Homologous comparisons involved each T strain competing against its W parent (e.g. AF36 T vs AF36 W), and heterologous comparisons involved each T strain competing against all other strains (e.g. AF36 T vs 1000-F). Assuming the growth rate for each AF− strain (T and W) would be similar, only the T AF− strains were included in the heterologous comparisons. Five replicate plates (labeled d4 - d8) for each competition experiment were incubated in darkness at 25˚C. Starting at day 4, all d4 plates were measured and photographed as mentioned above. Each subsequent day an additional replicate plate was examined (day 5 = d4 + d5 plates, etc.) until day 8 when all five replicate plates were measured and photographed. When either strain was the first to reach the cottonseed, the measurements for that plate would cease. If after day 8 neither strain reached the cottonseed, the measurements and photographs continued to a maximum of 11 days. If at any point a contaminant interfered with either competing colony or colonized the cottonseed before either competitor, that plate was removed and fewer replicate plates were used for further analyses. Once measurements for all non-contaminated plates were complete, the areas for each competitor colony (all replicates) were averaged and an average percent difference (APD) was calculated to ascertain which strain exhibited more robust growth in the presence of host tissue. To calculate APD, the averaged colony areas are subtracted from one another; the difference is then divided by the sum of the two averaged colony areas and multiplied by 100. A statistical two-tail T-test was then used to determine the significance of the difference in colony areas for each of the two competing strains.
3. Results
3.1. Molecular Investigation
Six atoxigenic A. flavus strains, currently in use for biocontrol in several laboratories, were compared in this study (AF36, NRRL21882, K49, KD17, KD19 and KD22). Previous examination of the aflF/aflU region in AF36 showed it to have a 1.5 kb deletion typical of A. flavus SB strains (the SB sequence motif) [20] rather than the smaller sequence deletion (1 kb) typical of isolates with L-strain sclerotia. This was confirmed in our investtigation. Two other AF− strains (K49 and KD19) exhibit the SB sequence deletion while KD22 exhibits the Lstrain deletion. KD17 exhibited no amplicon band upon PCR with primers to the aflF/aflU region and like strain NRRL21882 may lack this portion of the AF biosynthesis gene cluster. The toxigenic A. flavus, isolate SRRC1000-F, used in this study exhibits an L-strain genotype, and isolate SRRC41 exhibits an SBG phenotype with an intact aflF/aflU region (1.8 kb) like that of A. parasiticus. All but two strains in this study (SRRC41 and A. parasiticus SRRC143-A) were determined to have the Mat1-2 mating type idiomorph. These results, as well as the results for the mating type diagnostics of these strains, are shown in Table 2.
3.2. Preliminary Comparisons for Transformed AF36 and NRRL 21882
The method used for preliminary comparison of the fluorescent transformants and the wild-type parents involved mixing spores of W and T fungi (AF36 and NRRL21882) on a CZ plate and examining them for recovery after outgrowth for up to three weeks. Neither co-inoculated AF36 strain (W or T) showed a significant
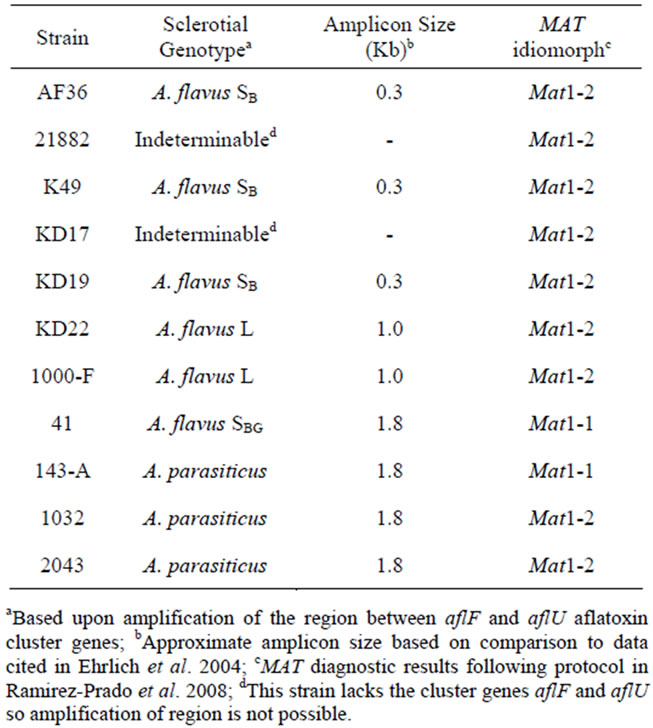
Table 2. Sclerotial genotype and MAT idiomorph for competitor strains.
difference (Figure 1) in recovery over time, whereas NRRL21882 T was recovered in significantly reduced yield over time when co-inoculated with NRRL21882 W and with AF36 W. Similar comparison of AF36 T and NRRL21882 W showed that by day 10 recovery from AF36 colonies was almost three-fold greater than that of NRRL21882.
3.3. Individual Growth for Transformed AF− Strains
Figure 2 shows the colony morphology for each W and T AF− strain at day 4 (A group), and again at day 8 (B group), on CZ medium. At day 4, both AF36 and K49 appear to have similar morphology and growth rate (A1 and A3, respectively). The W colonies appear round, mostly vegetative (white), with little conidiation. The T colonies, though round, are somewhat smaller in diameter (indicating a slight reduction in growth rate) than the W colonies, but the colonies appear to exhibit slightly enhanced conidiation. The fluorescence for both T strains was easily observed and strong. At day 8 the W colonies were still round, and slightly larger than the T colonies, but subtle differences began to appear in the degree of conidial pigmentation (B1 and B3). There is a ring of conidia that appears darker and more defined for the A36 colonies (B1a, b). Though still highly fluorescent, AF36 T shows a lower observable fluorescence in the colonies with darker conidia both at the point of inoculation as well as in a ring around the point of inoculation (B1c)
 (a)
(a)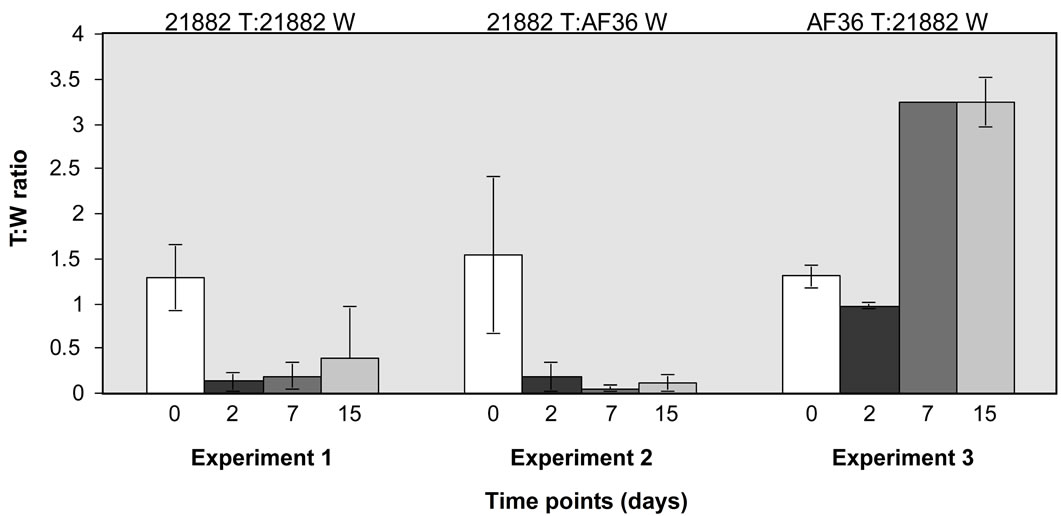 (b)
(b)
Figure 1. Comparison of spore recovery between mixed wild type and fluorescent colonies grown on PDA at different time points. Y-axis shows ratios of T:W colonies and x-axis shows time points (in days) for (a) three homologous comparisons of AF36 T vs. AF36 W; and (b) one homologous comparison of NRRL21882 T vs. NRRL21882 W, one heterologous comparison of NRRL21882 T vs. AF36 W, and AF36 T vs. NRRL21882 W. Error bars represent averages of 5 replicates ± the standard deviation.
while K49 T shows little or no difference in fluorescence with increased time in culture; in fact, the ring around the point of inoculation for K49 T appears to be even brighter than the rest of the colony (B3c).
At day 4, NRRL21882 and KD17 appear to have similar colony morphology and growth rate (A2 and A4, respectively). The margins of their colonies appear normal, but compared to the AF36 and K49 wild type, NRRL- 21882 W and KD17 W develop smaller colonies with less hyphal growth, but more sporulation. Fluorescence is greatly reduced in the NRRL21882 T and KD17 T colonies compared to the other transformed strains. It is difficult to observe eGFP fluorescence for strain NRRL- 21882 T (A2c) after 4 days, though at day 8, fluorescence only appears for a portion of the colony. KD17 T (A4c) has a muted but readily apparent fluorescence at both times compared to that of other strains. By day 8 both W and T colonies for NRRL21882 and KD17 appear to have irregular margins (B2 and B4, respectively). Strain NRRL21882 W (B2a) has more darkly melanized conidia than NRRL21882 T (B2b) and both KD17 colonies (B4a, b). Interestingly there is no ring of darkened conidia for the NRRL21882 colonies, but a large mass at the center of each colony (B2a, b). The KD17 colonies exhibit neither a ring nor a large central mass of darkened conidia. Once again fluorescence is reduced for both T strains (B2c; B4c), but a sector of bright fluorescence is observed in the NRRL21882 T colony (B2c).
Two additional AF− strains, KD19 and KD22, at day 4 exhibit similar colony characteristics to each other for both W and T plates (A5 and A6, respectively). Both have normal colony margins, and their W appearance is
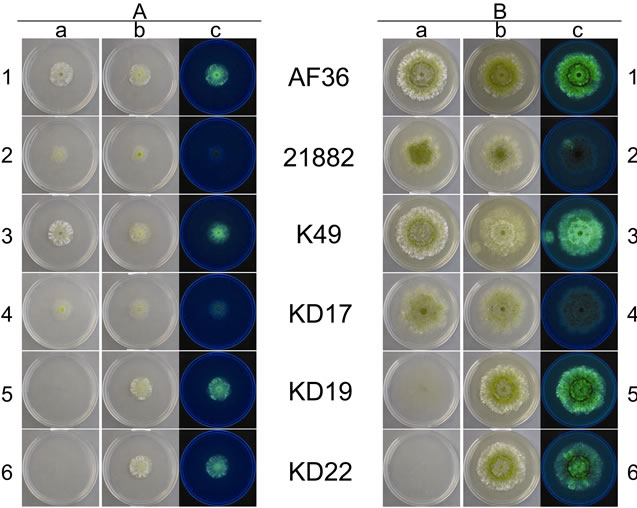
Figure 2. Images of individual colonies for each AF− strain taken at day 4 (A) and day 8 (B) of growth. Column (a) shows photos of the wild type strains taken in white light, and columns (b) and (c) are the transformed strains in both white light and using long-wave UV light (365 nm), respecttively. Numbered rows (1 - 6) relate to specific nonaflatoxigenic strains.
the most distinct of the other aforementioned W colonies (A5a; A6a) because the vegetative growth at day 4 is so sparse that the colonies are difficult to observe. The transformant colonies for KD19 and KD22; however, are similar to the AF36 and K49 T colonies. They exhibit abundant vegetative growth with normal margins, similar growth rate, and fluoresce well (A5b, c; A6b, c). More darkly melanized conidia are seen in the KD19 T colony (A5b) than in the KD22 T colony (A6b). Day 8 W and T colonies for KD19 and KD22 (B5 and B6, respectively), though larger, are similar in appearance to the day 4 colonies and both have normal margins even though the W colonies are difficult to see because of sparse vegetative growth, while the T colonies exhibit robust hyphal growth. A darker ring of melanized conidia can be seen in both T colonies (B5b; B6b), similar to those observed for the AF36 T colony mentioned above. This ring is more pronounced when observed under UV light (B5c; B6c). The fluorescence of KD19 T also appears slightly brighter than that of KD22 T.
3.4. Homologous Comparisons Involving Transformed AF− Strains
The growth rates for the individual W and T AF− strain colonies were not statistically different on nutrient-limited agar medium. We next determined if the presence of a live cottonseed cotyledon would affect growth of the W and T strains differently when inoculated on the same plate. We sought to measure fungal response to hormones or metabolites released during cottonseed germination and cotyledon growth that could either negatively or positively influence fungal growth toward the cottonseed. Two parameters were measured: 1) colony growth and 2) the ability of the colony to reach the germinated seed. Two typical competition plates are shown in Figure 3. The calculated average percent difference (APD) in colony size, based upon daily measurements of colony diameter for each colony grown under these conditions, is given in Table 3 (grey shading) as well as the relative success of each colony to reach the cotyledon. For AF36, K49, and KD17 the growth of the W strain proved to be greater than that of the T strain under these conditions. AF36 W exhibited 12.1% greater APD in colony size than AF36 T even though there was no difference in the abilities of the hyphae to reach the cottonseed (4 reps). The APDs for both K49 W vs. K49 T and KD17 W vs. KD17 T were much less (2.4% and 3.1%, respectively). In these cases, K49 W outcompeted K49 T 3 out of 5 times while KD17 W never successfully outcompeted KD17 T (0/5 reps). For similar comparisons of NRRL- 21882 T, KD19 T and KD22 T versus the wild type strains, the T strain showed greater growth than the W strain. There was small difference in the APDs of KD22 T and NRRL21882 T (4.5% and 5.4%, respectively), where in both experiments the T strains outcompeted the W strains (3/5 reps and 4/5 reps, respectively). Of all homologous competitor tests, KD19 T significantly outcompeted KD19 W (APD 29.1%, 5/5 reps). T-test results, however, showed no significance in the difference between the colony areas for the competing homologous strains (Table S1, grey shading).
3.5. Heterologous Comparisons Involving Transformed AF− Strains
The same comparisons were made between eGFP AF− strains and different AF− W strains as well as AF+ isolates. None of the T AF− strains consistently grew better or worse than the other W AF− strains or the toxigenic strains. AF36 T showed the greatest APD (26.7%) when compared to KD19 W, and reached the cotyledon 3 out of 4 times (Table 3). In competition against toxigenic strains, AF36 T exhibited 17.3% greater APD compared to the A. parasiticus isolate SRRC2043 (Figure 4A-1), although it showed no difference in its ability to reach the cottonseed. In similar competition of AF36 T vs. A. flavus SBG strain SRRC41, the latter showed an APD 14.2% greater than AF36 T, despite the AF36 T strain being first to the cotyledon more than 50% of the time (Figure 4A-2). Comparison of colony areas (Table S1) showed little difference (p = 0.0732) between A. parasiticus SRRC143-A and AF36 T, and no difference for any other AF36 T comparisons. Strain NRRL21882 T also showed the greatest APD (17.5%) against KD19 W, being the first to reach the cotyledon 4 out of 5 times.
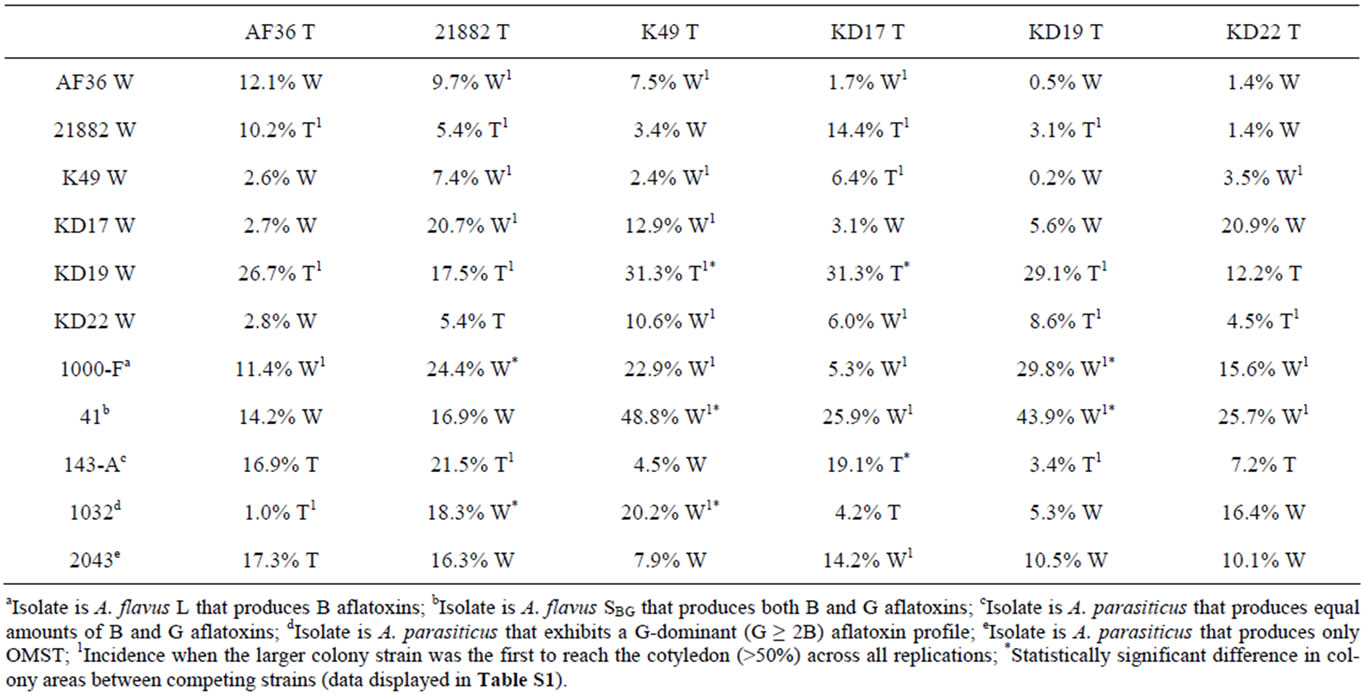
Table 3. Average percentage difference in colony sizes across five replicate plates, for both homologous and heterologous competition experiments, with the strain having the larger colony area noted as either W (wild type) or T (transformant).
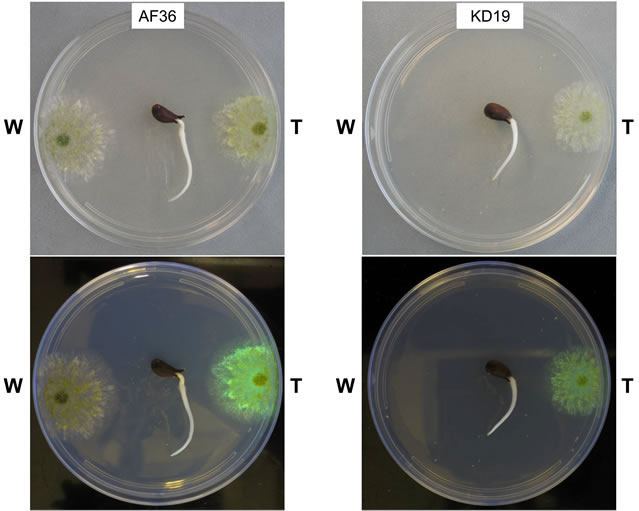
Figure 3. Images of homologous competition plates for AF36 (left panel) and KD19 (right panel) taken at day 4 of growth. The top section of each panel shows plates in white light with the wild type homolog (W) on the left side of the plate and the transformant homolog (T) on the right side of the plate. The bottom section shows each plate under longwave UV light (365 nm).
Against A. parasiticus SRRC143-A, NRRL21882 T exhibited 21.5% greater APD and reached the cotyledon first in every replicate experiment (Figure 4B-2). However, A. flavus SRRC1000-F exhibited 24.4% greater APD than NRRL21882 T (Figure 4B-1). T-test analyses indicated significant differences between colonies of NRRL21882 T and A. parasiticus SRRC1032 (p = 0.0055) and between NRRL21882 T and A. flavus SRRC1000-F (p = 0.0454). Between colonies of NRRL21882 T and those of the two other A. parasiticus competitors, the levels of significance were p = 0.0868 (SRRC143-A) and p = 0.0911 (SRRC2043). K49 T, when compared to KD19W, exhibited an APD of 31.3% (Figure 4C-1), and was the first to reach the cotyledon 4 out of 5 times; however, K49 T did not grow as well in the presence of the toxigenic strains. In fact, A. flavus SBG SRRC41 showed almost 50% greater APD than K49 T as well as successfully outcompeting K49 T in all replicate plates (Figure 4C-2). Among the 11 possible K49 T comparisons, four showed significant values for colony area difference: KD19 W, p = 0.0062; A. flavus SRRC1000-F, p = 0.046; A. flavus SBG SRRC41, p = 0.00001, and A. parasiticus SRRC1032, p = 0.0344. The colony area difference between K49 T and A. parasiticus SRRC143-A showed a marginal significance of p = 0.0732. KD17 T, despite being the first to reach the cotyledon only 2 out of 5 times, grew better than KD19 W with an APD of 31.3% (Table 3). In competition with toxigenic A. parasiticus isolate SRRC143-A, KD17 T grew better (APD 19.1%) although it failed to be the first to reach the cotyledon in 3 out of 4 trials (Figure 4D-1). Against A. flavus SBG SRRC41, KD17 T showed 25.9% less growth and failed to be the first to reach the cotyledon in every test (Figure 4D-2). Only two competition experiments involving KD17 T offered significant differences in colony area: against KD19 W, p = 0.04; and A. parasiticus SRRC143-A, p = 0.038. The remaining comparisons offered no significant differences. For KD19 T compared to KD22T gave an APD of 8.6% and rea-
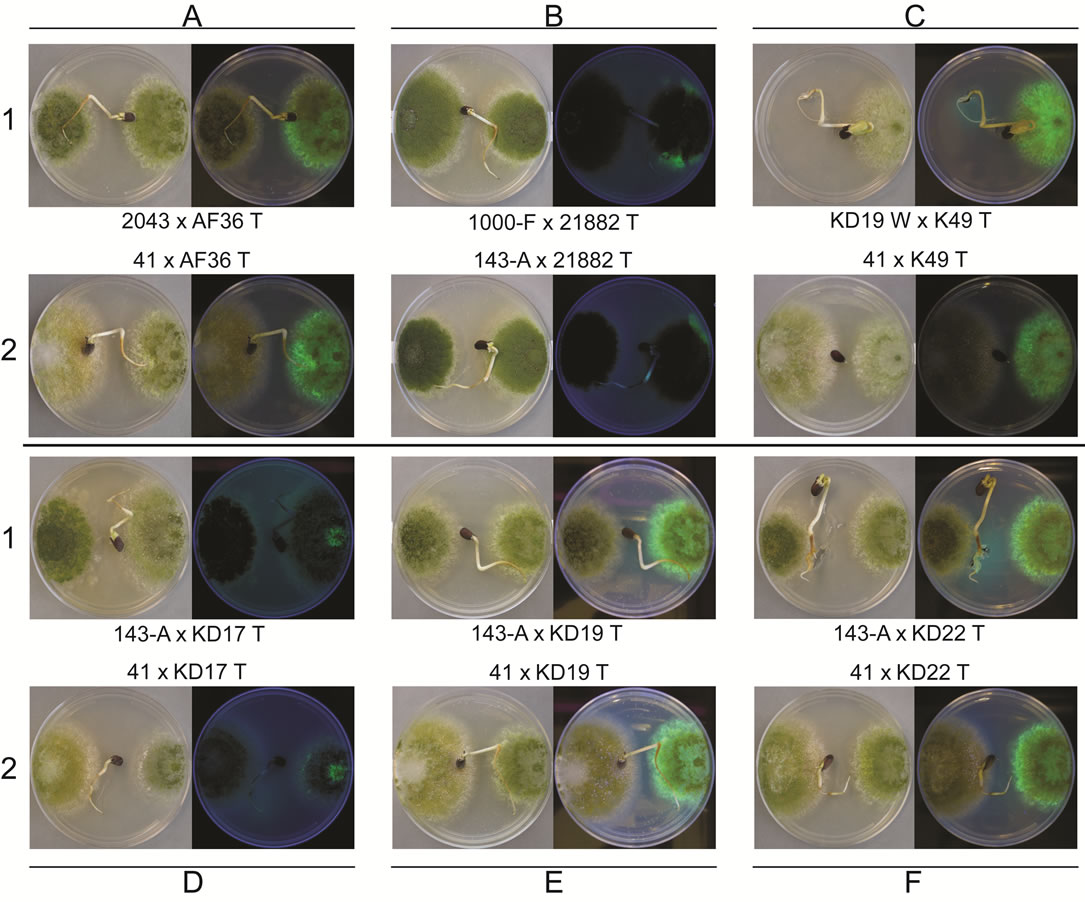
Figure 4. Images of heterologous competition plates for AF36 T (A), NRRL21882 T (B), K49 T (C), KD17 T (D), KD19 T (E), and KD22 T (F), each with two competitor strains (1 and 2, respectively). Within each plate the wild type competitor is on the left side of the plate and the transformed AF− strain is on the right side of plate. Each panel shows plate images taken in white light (left) and using long-wave UV light (right). Rows 1 and 2 will show examples of either the wild type strain, or the transformed strain, exhibiting greater colony area in the competition at day 8 of growth.
ched the cotyledon first 3 out of 5 times. KD19 T, when compared against one of the toxigenic strains (A. parasiticus SRRC143-A) showed no growth difference (3.4% APD) though it reached the cotyledon first in 3 out of 4 trials (Figure 4E-1), whereas against toxigenic A. flavus SBG SRRC41, KD19 T grew almost two-fold slower (APD = 43.9%) and never outcompeted SRRC41 in reaching the cotyledon (Figure 4E-2). KD19 T comparisons only yielded two significant values for colony area difference. These were for KD19 T comparisons with toxigenic A. flavus isolates SRRC1000-F (p = 0.0283) and SRRC41 (p = 0.0024). Transformant KD22 T exhibited its most robust growth when competing against KD19 W as well (12.2% APD) though it was the first to reach the cotyledon only 2 out of 5 times. In competition with toxigenic strains, KD22 T showed greater growth area (7.2% APD) when competing with A. parasiticus SRRC143-A, but only 2 out of 5 times was it able to first reach the cotyledon (Figure 4F-1). Once again, A. flavus SBG SRRC41 proved the stronger toxigenic competitor by exhibiting 25.7% APD over KD22 T and by successfully outcompeting KD22 T for the cotyledon 3 out of 5 times (Figure 4F-2). There were no significant growth differences (p > 0.5) for any of the KD22 T growth comparisons.
4. Discussion
The AF− isolates used in this study were chosen because they demonstrated enhanced abilities to compete against most wild-type AF+ A. flavus. One of these, AF36, while producing large sclerotia and usually considered part of the L-strain clade [24], has a gap between the aflF (norB) and aflU (cypA) genes that is typical of S-strain A. flavus and A. oryzae isolates [20]. A. flavus SB (small sclerotia) morphotype fungi are light-responsive and typically produce high concentrations of B aflatoxins whereas L-strain isolates are not light responsive and comparatively produce five-fold less aflatoxin [25]. The differences that exist between cladal associations and sclerotial production versus genotypic observations for AF36 indicate that it may have resulted from recombination between Land S-strain parents. Since there are no known wild type S strains that are also AF−, the aflatoxin-negative phenotype and the production of fewer and larger sclerotia would likely have been inherited from the L strain parent, but the loss of the ability to produce G aflatoxins may have been inherited from an S-strain parent [20]. The fact that all the AF− strains investigated have the MAT1-2 idiomorph may be of importance to the ability of these fungi to serve as effective biocontrol agents. The MAT1-2 locus may affect fungal-fungal contact and be responsible for a type of thigmotropic inhibition mentioned above [7]. Perhaps the MAT1-2 locus also affects the ability of the fungus to make contact with susceptible plants. Research into the role of the mating type locus (male/donor vs. female/recipient) on production of cellular signals for species in section Flavi might offer insight into choosing optimal strains for biocontrol efforts. Female sterility in fungal populations may explain limitations in fecundity and less diverse toxin profiles in A. flavus populations (Moore et al. unpublished).
Our results show that GFP-transformation of AF36 did not significantly affect recovery from mixed cultures whereas NRRL21882 was not able to be recovered because the fluorescence appeared to be lost after attempted recovery from mixed cultures. This could be due to fluorescence quenching in the NRRL21882 colonies or to abnormal loss of the loss of the fluorescent marker due to genetic instability at its point of insertion into the genome. These results show that tagging of the NRRL21882 strain with GFP might not be useful for further tracking of isolates released into agricultural fields.
Because it was possible that introduction of the eGFP marker could affect the ability of the transformed fungi to grow, due to the additional energy requirements for protein production, we monitored individual growth of wild type biocontrol strains and their GFP transformants. The results show that colony growth rates and morphology were not affected by the addition of eGFP. Surprisingly, KD19 T and KD22 T exhibited a more robust growth than the wild type and fluoresced well throughout the growth period (Figure 2). Therefore, at least for these isolates, we expect that they will serve as biocontrol competitors at least as well as the wild type in field trials of efficacy. While introduction of the pyrithiamine resistance marker gene, or eGFP, was not expected to provide a nutritional advantage, it is possible that an ectopic insertion of this marker inactivated a potential growth inhibitor or stimulated a growth-enhancing gene.
The ability of transformed strains to retain the ability to fluoresce is important for further investigations in less artificial environments. Based on the results suggesting that fluorescence is either quenched or lost in AF− strains NRRL21882 and KD17, they may not be good candidates for fluorescent tagging with eGFP. Because both grew similarly, it is possible that these strains share similar genotypes. These isolates possess darkly melanized conidia and the robust pigment formation may act to inhibit eGFP fluorescence. KD22 T exhibits inconsistent fluorescence across the colony suggesting that fluorescence may be quenched during growth or that the colony is not clonal, but KD22 T may still be a better candidate for future studies using fluorescent-tagged strains as biocontrol agents than either NRRL21882 or KD17. Based on colony growth and fluorescence, AF36 T is a good candidate for further eGFP studies. Fluorescenttagged KD19 T and K49 T exhibited reliable growth, sporulation, and easily observable fluorescence under the in vitro test conditions. We consider from our studies that K49 might be a better choice for a generally applicable biocontrol strain than AF36 because it lacks the ability to produce CPA. Fluorescence in the K49T colony is particularly bright, possibly because the colony margin lacked the dark ring of conidia seen for colonies of other isolates.
Self-competition studies showed no significant difference from the wild-type, and if anything, transformed colonies showed even more robust growth. To test if aggressiveness of the colonies was altered by the presence of a germinating cotyledon we measured colony outgrowth from spores of transformed and untransformed fungi. These competition experiments measured the relative abilities of different isolates to form colonies whose margins were able to reach a germinated cottonseed that was placed between two equidistant points of inoculation. During some experiments contact with the seed occurred only after a few days, while for others, growth required up to 11 days. Only in a few experiments did both colonies reach the cotyledon at the same time. As measured by the percent difference in colony size between the larger and smaller colonies (Table 3), in most cases there was no statistically significant difference, between W and T, in which colony was first to reach the cotyledon. This further demonstrates that, even in the presence of viable plant tissue, the introduction of GFP into the biocontrol strain it is not an impediment to growth. Therefore, the results indicate that these artificially fluorescent-tagged isolates would perform as well as the non-transformed strains in biocontrol studies. Since agricultural fields already contain an indigenous population of AF− strains [26], the use of fluorescent strains will make tracking the introduced strains easier as well as the ability to determine strain out-crossing.
5. Conclusion
The goal of this study was to determine if introducing eGFP into a biocontrol strain of A. flavus would affect its competitive ability. Our results show that the fluorescence is stable in all of the transformed strains, with the possible exception of NRRL21882 and KD17 in which the fluorescence was difficult to see after colony recovery. Therefore, except for these isolates, the biocontrol isolates should both retain the ability to: 1) act as effective biocontrol agents; and 2) be readily tracked after introduction into agricultural environments. Furthermore, our results show that the colony outgrowth of the fluorescent strains was generally similar to that of their wild type parents and to other types of aflatoxin-producing and AF− strains in the field. At present there is no rapid method to determine the ability of the introduced isolates to outcross under natural growth conditions, an important consideration for determining the long-term success of, and potential problems with, the introduction of biocontrol strains into the environment. The possibility that a super-competitor strain, capable of AF production, could result from an out-crossing between the highly competitive non-aflatoxigenic strain chosen for biocontrol and a wild type aflatoxigenic strain must be considered.
REFERENCES
- K. C. Ehrlich and P. J. Cotty, “An Isolate of Aspergillus flavus Used to Reduce Aflatoxin Contamination in Cottonseed Has a Defective Polyketide Synthase Gene,” Applied Microbiology and Biotechnology, Vol. 65, No. 4, 2004, pp. 473-478. doi:10.1007/s00253-004-1670-y
- P.-K. Chang, B. W. Horn and J. W. Dorner, “Sequence Breakpoints in the Aflatoxin Biosynthesis Gene Cluster and Flanking Regions in Nonaflatoxigenic Aspergillus flavus Isolates,” Fungal Genetics and Biology, Vol. 42, No. 11, 2005, pp. 914-923. doi:10.1016/j.fgb.2005.07.004
- G. G. Moore, R. Singh, B. W. Horn and I. Carbone, “Recombination and Lineage-Specific Gene Loss in the Aflatoxin Gene Cluster of Aspergillus flavus,” Molecular Ecology, Vol. 18, No. 23, 2009, pp. 4870-4887. doi:10.1111/j.1365-294X.2009.04414.x
- J. W. Dorner, “Biological Control of Aflatoxin Contamination in Corn Using a Nontoxigenic Strain of Aspergillus flavus,” Journal of Food Protection, Vol. 72, No. 4, 2009, pp. 801-804.
- P. J. Cotty, “Influence of Field Application of an Atoxigenic Strain of Aspergillus flavus on the Populations of A. flavus Infecting Cotton Bolls and on the Aflatoxin Content of Cottonseed,” Phytopathology, Vol. 84, No. 11, 1994, pp. 1270-1277. doi:10.1094/Phyto-84-1270
- J. W. Dorner, “Development of Biocontrol Technology to Manage Aflatoxin Contamination in Peanuts,” Peanut Science, Vol. 36, No. 1, 2009, pp. 60-67. doi:10.3146/AT07-002.1
- C. Huang, A. Jha, R. Sweany, C. DeRobertis, K. E. Damann Jr., “Intraspecific Aflatoxin Inhibition in Aspergillus flavus Is Thigmoregulated, Independent of Vegetative Compatibility Group and Is Strain Dependent,” PLoS One, Vol. 6, No. 8, 2011, Article ID: e23470. doi:10.1371/journal.pone.0023470
- P.-K. Chang, H. K. Abbas, M. A. Weaver, et al., “Identification of Genetic Defects in the Atoxigenic Biocontrol Strain Aspergillus flavus K49 Reveals the Presence of a Competitive Recombinant Group in Field Populations,” International Journal of Food Microbiology, Vol. 154, No. 3, 2012, pp. 192-196.
- F. Wu, Y. Liu and D. Bhatnagar, “Cost-Effectiveness of Aflatoxin Control Methods: Economic Incentives,” Toxin Reviews, Vol. 27, No. 3-4, 2008, pp. 203-225. doi:10.1080/15569540802393690
- P. J. Cotty, “Aflatoxin Control in Pistachios, Almonds and Figs: Biocontrol Using Atoxigenic Strains,” 2011. http://www.ars.usda.gov/research/projects/projects.htm?accn_no = 412279
- J. W. Dorner and B. W. Horn, “Separate and Combined Applications of Nontoxigenic Aspergillus flavus and A. parasiticus for Biocontrol of Aflatoxin in Peanuts,” Mycopathologia, Vol. 163, No. 4, 2007, pp. 215-223. doi:10.1007/s11046-007-9004-0
- H. K. Abbas, R. M. Zablotowicz, B. W. Horn, et al., “Comparison of Major Biocontrol Strains of Non-Aflatoxigenic Aspergillus flavus for the Reduction of Aflatoxins and Cyclopiazonic Acid in Maize,” Food Additives and Contaminants, Vol. 28, No. 2, 2011, pp. 198-208. doi:10.1080/19440049.2010.544680
- C. Accinelli, M. L. Saccà, H. K. Abbas, et al., “Use of a Bioplastic Formulation for Carrying Conidia of a NonAflatoxigenic Strain of Aspergillus flavus,” Bioresource Technologies, Vol. 100, No. 17, 2009, pp. 3997-4004. doi:10.1016/j.biortech.2009.03.010
- B. W. Horn, J. H. Ramirez-Prado and I. Carbone, “The Sexual State of Aspergillus parasiticus,” Mycologia, Vol. 101, No. 2, 2009, pp. 275-280. doi:10.3852/08-205
- B. W. Horn, G. G. Moore and I. Carbone, “Sexual Production in Aspergillus flavus,” Mycologia, Vol. 101, No. 3, 2009, pp. 423-429. doi:10.3852/09-011
- B. W. Horn, G. G. Moore and I. Carbone, “Sexual Reproduction in Aflatoxin-Producing Aspergillus nomius,” Mycologia, Vol. 103, No. 1, 2011, pp. 174-183. doi:10.3852/10-115
- C. J. Worthington, B. W. Horn, G. G. Moore, et al., “Hybridization between Aspergillus flavus and Aspergillus parasiticus,” The 26th Fungal Genetics Conference, Pacific Grove, 15-20 March 2011.
- R. A. Olarte, B. W. Horn, J. W. Dorner, et al., “Effect of Sexual Recombination on Population Diversity in Aflatoxin Production by Aspergillus flavus and Evidence for Cryptic Heterokaryosis,” Molecular Ecology, Vol. 21, No. 6, 2012, pp. 1453-1476. doi:10.1111/j.1365-294X.2011.05398.x
- K. C. Ehrlich, P.-K. Chang, J. Yu and P. J. Cotty, “Aflatoxin Biosynthesis Cluster Gene cypA Is Required for G Aflatoxin Formation,” Applied and Environmental Microbiology, Vol. 70, No. 11, 2004, pp. 6518-6524. doi:10.1128/AEM.70.11.6518-6524.2004
- P.-K. Chang, K. C. Ehrlich and S.-S. T. Hua, “Cladal Relatedness among Aspergillus oryzae Isolates and Aspergillus flavus S and L Morphotype Isolates,” International Journal of Food Microbiology, Vol. 108, No. 2, 2006, pp. 172-177. doi:10.1016/j.ijfoodmicro.2005.11.008
- J. H. Ramirez-Prado, G. G. Moore, B. W. Horn and I. Carbone, “Characterization and Population Analysis of the Mating-Type Genes in Aspergillus flavus and Aspergillus parasiticus,” Fungal Genetics and Biology, Vol. 45, No. 9, 2008, pp. 1292-1299. doi:10.1016/j.fgb.2008.06.007
- K. Rajasekaran, J. W. Cary, P. J. Cotty and T. E. Cleveland, “Development of a GFP-Expressing Aspergillus flavus Strain to Study Fungal Invasion, Colonization, and Resistance in Cottonseed,” Mycopathologia, Vol. 165, No. 2, 2008, pp. 89-97. doi:10.1007/s11046-007-9085-9
- J. W. Cary, P. Y. Harris-Coward, K. C. Ehrlich, et al., “NsdC and NsdD Affect Aspergillus flavus Morphogenesis and Aflatoxin Production,” Eukaryotic Cell, Vol. 11, No. 9, 2012, pp. 1104-1111. doi:10.1128/EC.00069-12
- R. K. Garber and P. J. Cotty, “Formation of Sclerotia and Aflatoxins in Developing Cotton Bolls Infected by the S Strain of Aspergillus flavus and Potential for Biocontrol with an Atoxigenic Strain,” Phytopathology, Vol. 87, No. 9, 1997, pp. 940-945. doi:10.1094/PHYTO.1997.87.9.940
- R. Jamie-Garcia and P. J. Cotty, “Aspergillus flavus in Soils and Corncobs in South Texas: Implications for Management of Aflatoxins in Corn-Cotton Rotations,” Plant Disease, Vol. 88, No. 12, 2004, pp. 1366-1371. doi:10.1094/PDIS.2004.88.12.1366
- B. W. Horn and J. W. Dorner, “Regional Differences in Production of Aflatoxin B1 and Cyclopiazonic Acid by Soil Isolates of Aspergillus flavus along a Transect within the United States,” Applied and Environmental Microbiology, Vol. 65, No. 4, 1999, pp. 1444-1449.
Supplement
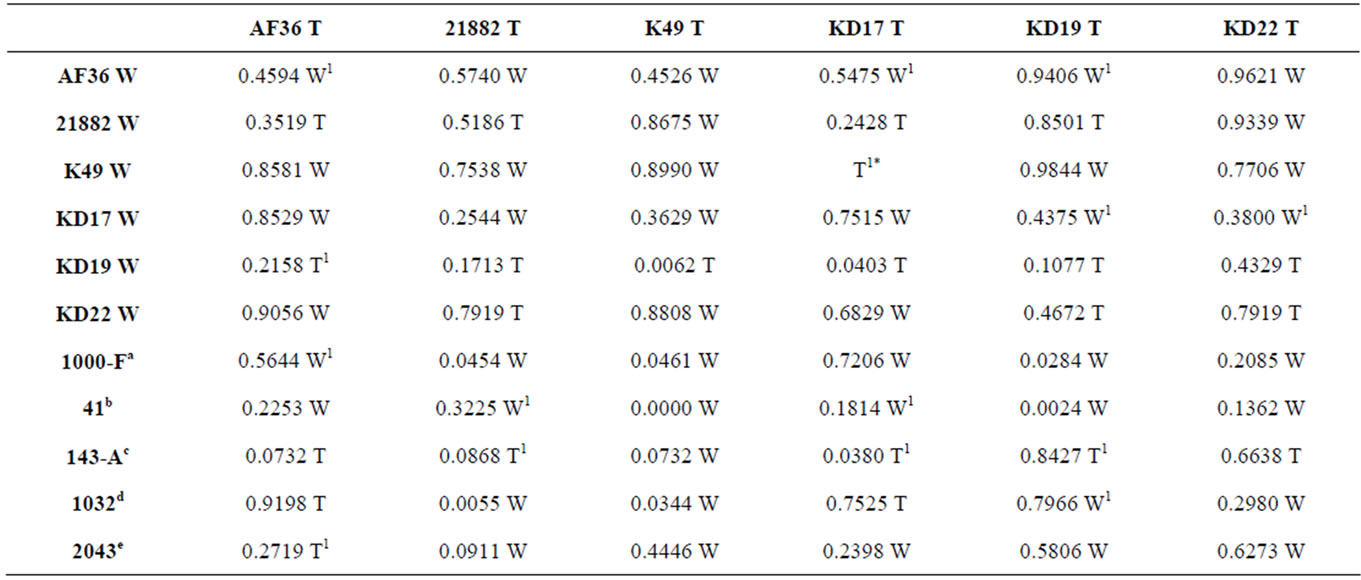
Table S1. Two-tail T-test p-values for colony sizes across five replicate plates, from homologous and heterologous competition experiments, with the strain having the larger colony area noted as either W (wild type) or T (transformant).aIsolate is A. flavus L that produces B aflatoxins; bIsolate is A. flavus SBG that produces both B and G aflatoxins; cIsolate is A. parasiticus that produces equal amounts of B and G aflatoxins; dIsolate is A. parasiticus that exhibits a G-dominant (G ≥ 2B) aflatoxin profile; eIsolate is A. parasiticus that produces only OMST; 1Fewer than five replicates were included due to plate contamination; *Indeterminable p-value since only one plate was free of contamination.
NOTES
*Corresponding author.