Food and Nutrition Sciences
Vol. 4 No. 1 (2013) , Article ID: 27354 , 11 pages DOI:10.4236/fns.2013.41015
Tyrosinase Biosensor Used for the Determination of Catechin Derivatives in Tea: Correlation with HPLC/DAD Method
![]()
1Institut de Modélisation et d’Analyse en Géo-Environnement et Santé, Univ. Perpignan Via Domitia, Perpignan, France; 2Laboratoire d’Analyses Chimiques et Biocapteurs, Faculté des Sciences et Techniques, Université Hassan II, Mohammedia, Morocco.
Email: *calas@univ-perp.fr
Received October 24th, 2012; revised November 24th, 2012; accepted December 3rd, 2012
Keywords: Tea; Polyphenol; Catechin; Tyrosinase Amperometric Biosensor; HPLC
ABSTRACT
Tea, one of the most popular consumed worldwide beverages, is known to be rich in polyphenols, more particularly in catechins. An amperometric biosensor based on tyrosinase was developed in order to monitor the phenolic content in black and green teas. The enzyme was immobilised by coreticulation with glutaraldehyde on carbon screen-printed electrodes (CSPE). Initially, the performances of the biosensor were evaluated referring to catechol as a model substrate. This analytical tool exhibits a high sensitivity (217 nA/µM), low limit of detection (LOD) = 0.03 µM, good intra-electrode and inter-electrode reproducibilities with RSD lower than 3% (n = 5 injections) and RSD = 8.14% (n = 12 sensors) respectively. The storage stability was also studied; the biosensor retained successively 85% and 70% of its initial response after 34 and 53 days. Subsequently, several catechin derivatives frequently found in teas were tested and classified relatively to their sensitivities. For tea samples, the results obtained with the biosensors were compared to high performance liquid chromatography (HPLC) analysis. A good correlation between the two methods was obtained. The calculated recovery was between 90% and 96%, proving that the proposed tyrosinase biosensor can be an alternative analytical tool for global determination of catechin derivatives in tea.
1. Introduction
In the last 15 years, research studies have been increasingly focused on plant polyphenols and their positive health effects. Thus, it has been proven that a diet rich in fruits and vegetables containing various classes of polyphenols (phenolic acids, flavonols, catechin monomers, proanthocyanidins, flavones, flavanones, anthocyanins) decreases the risk of premature mortality from major clinical conditions [1,2]. Moreover, many epidemiological studies have concluded that tea polyphenols have important beneficial effects on human health because of high antioxidant activities which can protect cells against the adverse effects of reactive oxygen species, and contribute in lowering risk of certain types of cancer and disease [3-9]. Tea is the most widely consumed beverage in the world and is known to contain significant level of catechins. Recently, more than 96 phenolic components have been identified from 41 green teas and 25 fermented teas [10,11]. Among them, the major functional components are gallic acid (GA) and tea catechins, mainly (−)-epicatechin (EC), (−)-epicatechin gallate (ECG), (−)-epigallocatechin (EGC), and (−)-epigallocatechin gallate (EGCG). On one hand, chromatographic methods including HPLC combined with UV-Vis detection [12- 15], chemiluminescence detection, fluorescence detection [16] and electrochemical detection [17] are widely used for the specific determination of tea polyphenols content. On another hand, the spectrophotometric Folin-Ciocalteu method, allowing the global determination of phenol content, is still the most employed approach. Although these methods are well established, more simple and faster techniques are still required for quantification purposes. Therefore, many efforts have been made to develop simple and effective tools for the determination of total phenols content. Because of their selectivity, low cost, potential for miniaturization and automation, a lot of electrochemical sensors and biosensors have been developed. Sensors were based on cyclic voltammetry [18,19], differential pulse voltammetry or square wave voltammetry [20,21] while an amperometric detection was required for the described biosensors [22-29]. Among these tools, amperometric biosensors based on tyrosinase were promising for this purpose. Tyrosinase catalyses the oxidation of o-diphenols (including catechins) to o-quinones by consumption of molecular oxygen. These quinones are electrochemically reduced at a low potential and the measured current is proportional to the phenolic compound concentration [30-35]. Different aims of this work were the development of a tyrosinase biosensor for the detection of polyphenolic compounds, the optimization of its analytical performances, the analysis of its reaction with different catechin standards and the use of this tool for assessing the phenolic content in tea. Finally, the results obtained with the developed tyrosinase biosensor were compared with those deduced from HPLC technique.
2. Materials and Methods
2.1. Reagents, Black and Green Teas
Tyrosinase (EC 1.14.18.1/3933 U/mg) from mushroom, bovine serum albumin (BSA), aqueous solutions (25% w/v) of glutaraldehyde (GA), KH2PO4, Na2HPO4, KCl, catechol, caffeic acid (CA), (+)-catechin (C), (−)-epicatechin (EC), (−)-epigallocatechin (EGC), (−)-gallocatechin (GC), (−)-gallocatechingallate (GCG), (−)-epigallocatechin gallate (EGCG), (−)-epicatechingallate (ECG), trifluoroacetic acid (TFA) and acetonitrile (HPLC grade) were purchased from Sigma-Aldrich. All other chemicals were of analytical grade. Deionised water was produced using a three cartridges kit from Fisher. Black and green teas were obtained from local supermarket: Black Lipton 2 g/bag, Black Lord Nelson 1.75 g/bag, Green Lord Nelson 1.75 g/bag and Green China 2 g/bag.
2.2. Buffers, Standards and Tea Samples Preparation
In accordance to the literature [30-31,36-37], phosphate buffer (PBS) pH 7 (0.1 M) was selected for this work. It was prepared with 0.1 M KH2PO4, 0.1 M Na2HPO4 and 0.1 M KCL. Due to their low solubility, each stock catechin standard solution was prepared in an appropriate percentage of methanol in water and was stocked at −20˚C. Concerning the extraction of polyphenols from teas, each tea bag was infused in 100 mL of water at 90˚C for 5 min and was kept at −20˚C. Then, before each measurement, suitable dilutions were prepared in water. For the biosensor analysis, in order to avoid the fouling of the working electrode surface caused by an insulating polyphenolic film formation (during its electro-oxidation), tea samples were first diluted 16 times. When responses were lower than the limit of quantification, less important dilutions (8 or 4 times) were tested. For HPLC analysis, infusions were filtered using Minisart syringe filter (pore size 5 µm; Sartorius, France) and diluted 20 times.
2.3. Electrodes and Biosensors Manufacture
All electrochemical experiments were carried out using a three-electrode configuration of screen-printed electrodes (SPE). The working electrode was a 4 mm-diameter carbon disk, the auxiliary electrode was a carbon curvedline and the reference electrode was an Ag/AgCl pseudoreference. These CSPE were manufactured in IMAGES laboratory using a DEK 248 printing machine. For the conception of the biosensor, the catalytic bioreceptor is immobilized by coreticulation in an albumin-glutaraldehyde cross-linked matrix. 4 µL of a solution containing 82 mIU of tyrosinase with 0.1% BSA were deposited on the working electrode surface and kept at 4˚C during 4 hours. After drying, the surface was covered with 7 µL of 2.5% glutaraldehyde solution during 5 min, then, washed with phosphate buffer solution. The designed biosensors, noted (CSPE/Tyr/GA), can be immediately tested or stored dry under vacuum at 4˚C before use.
2.4. Apparatus and Measurement
Cyclic voltammograms of phenolic compounds were realized using AUTOLAB PGSTAT12 (serial number AUT71188 Metrohm, France) in order to determine the optimum potential required for their amperometric quantification. Amperometric experiments were carried out using a 641-VA potentiostat (Metrohm, France) in an electrochemical cell containing 5 mL of PBS under constant stirring providing the convective transport. At −150 mV vs. pseudo-reference Ag/AgCl electrode, the current signal was measured and transferred to a recorder (BD40 single channel, Kipp & Zonen) (Figure 1). For all standard compounds, calibrations were performed by successive additions, calibration plots representing the overall current as a function of the substrate concentration. The liquid chromatography (HPLC) was a L-2000 series LaChrom Elite® system from Merck-Hitachi (VWR, France) consisting of a quaternary pumping system equipped with a L-2200 autosampler and a L-2455 diode array detector. The column used was a C18 column (Kinetex® 2.6 µm, 100 Å - 100 mm × 4.6 mm, Phenomenex, France). The two mobile phases used for gradient HPLC elution were prepared in accordance with the protocol described by Lee and Ong [38], (A) water containing 5% (v/v) acetonitrile and 0.035% (v/v) trifluoroacetic acid; and (B) water containing 50% (v/v) acetonitrile and 0.025% (v/v) trifluoroacetic acid. The flow-rate was set at 1.0 ml/min. The gradient of the elution was slightly modified as
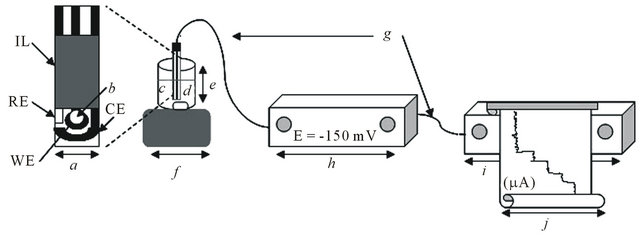
Figure 1. Experimental instrument of amperometric tyrosinase biosensor for catechins detection; a: CSPE (1 × 3.5 cm) WE: working electrode; RE: reference electrode; CE: counter electrode; IL: insulating layer; b: immobilised enzyme; c: PBS pH 7 (0.1 M); d: magnetic bar; e: measurement cell; f: magnetic stirrer; g: connectors; h: potentiostat; i: recorder; j: amperometric responses (current measurement).
followed: 0 - 10 min 90% A, 10 - 16 min 80 % A, 16 - 20 min, 60% A, 20 - 27 min 50% A, 27 - 29 min 60% A, 29 - 33 min 90% A. The injection volume was 20 µL. Catechin derivatives were detected at 205 nm and data acquisition was performed using EZchrom Elite software. Caffeic acid was added to each sample as an internal standard before injection. After extraction of catechin derivatives from tea (§2.2), the samples were analysed with HPLC using the experimental conditions previously described. The catechin concentrations in tea samples were determined using the calibration curves realised for the 7 catechin standards derivatives.
2.5. Statistical Analysis
The standard deviation S of a set of N repeat measurements was calculated by using the common and simple formula defined as:

X: single measurement.
M: mean (average) measurement.
The relative precision of two or more different kinds of measurement (example of two or more tested sensors) was compared by calculating their percent relative standard deviation (%RSD), which was calculated by using the equation given below:

3. Result and Discussion
3.1. Cyclic Voltammetry of Tyrosinase Substrates
Cyclic voltammograms (CV) were performed for catechol and for the seven selected catechin standards, in the presence and the absence of tyrosinase. Figure 2 shows the CV obtained for the natural substrate of tyrosinase used as representative compound. As expected, in buffer solution, only a small background current was observed. The CV of catechol performed at a bare electrode showed two waves. The enzymatic catalysis of catechol to o-quinone resulted in a significant enhancement of the cathodic peak with a well-defined sigmoid form. This peak corresponding to the electrochemical reduction of o-quinone appeared at around −0.2 V vs. pseudoAg/AgCl. For amperometric determinations, −0.150 V was selected since it provided both, a good intensity of the signal recorded and minimal potential interference from other redox processes.
3.2. Reproducibility, Operational and Storage Stabilities of the Developed Biosensor
The biosensor characteristics in terms of reproducibility and stabilities were performed with the natural enzyme substrate. The reproducibility of the tyrosinase-based biosensors was evaluated by mean of 5 repetitive measurements of 1 µM of catechol (RSD = 2.7% for intra-electrode reproducibility); a relative standard deviation of 8.14% was obtained for 12 different tested biosensors (inter-electrode reproducibility). This last result is better than the value obtained by nanofibrous membrane based tyrosinase biosensor with 13.81% of RSD (n = 10) [39]. Operational stability was investigated by consecutive measurements of 1 µM catechol within a 4 h period. After 80 consecutive injections, the biosensor retained 92% of its initial activity. The CSPE/Tyr/GA biosensor exhibited long-term operational stability.
One of the reasons to immobilize an enzyme is to improve the biosensor lifetime, allowing its use over a long period of time. Consequently, storage stability was estimated by measuring the biosensor response to 1 µM catechol each 7 or 10 days. The remained activity of the original response of CSPE/Tyr/GA was about 84 % after 34 days and 70% after 53 days stored at 4˚C. This stability
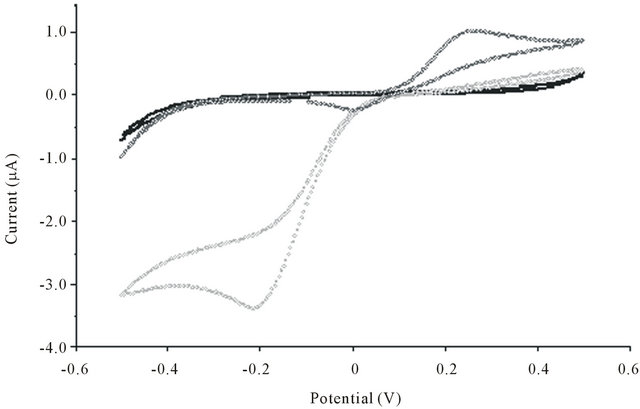
Figure 2. Cyclic voltammogram of the tyrosinase biosensor in a phosphate buffer solution (0.1 M, pH 7) in the absence (―――) and in the presence (•••••••••) of catechol (1 mM) at the scan rate of 25 mVs–1. (•••••••••) shows the response of the sensor (without tyrosinase enzyme) in the presence of catechol (1 mM).
is much longer than those obtained by Arecchi [39] and zejli [40] with successively 2 and 3 weeks.
3.3. Analytical Performances of the Biosensor
In addition to catechol, seven catechin derivatives (Figure 3) frequently found in teas were selected and tested with the developed biosensor. A calibration curve has been done for each of them. The analytical performances of the biosensor are summarized in Table 1. Using CSPE/tyr/GA, the detection limit of catechol (0.03 µM) was much lower than the values obtained with tyrosinase biosensors reported in literature [32-35,40-42]. As expected, the developed biosensor is more sensitive to catechol than catechin derivatives according to the following trend: Catechol >>>> EC > C > ECG > GC > EGC > GCG > EGCG. The natural tyrosinase substrate, catechol was from 4 to 128 times higher than EC and EGCG respectively. This classification of catechins can be explained by their different chemical structures (substituents and conformation), which can affect their affinity with tyrosinase. Obviously, it can be noted that all of the tested catechins have a common meta-diphenolic structure. However, these compounds can be classified in two main groups. The components of the first one are EC, C and ECG. They possess an ortho-diphenolic structure that allows them to have a good affinity with tyrosinase. The other compounds (EGC, GC, GCG and EGCG), which constitute the second group, do not have this ortho-diphenolic function, leading to an important decrease regarding their affinity with the enzyme and consequently regarding the biosensor sensitivity. Both in the first and the second group, the lowest sensitivities are reached by ECG, GCG and EGCG. These compounds possess a galloyl moiety at the 3-position which can cause steric hindrance [43].
3.4. Total Phenol Content in Tea Samples Using CSPE/Tyr/GA
The phenol content in natural samples was determined by the developed biosensor using a standard compound as reference. Both C and EGCG have been selected to express the phenol content in tea samples (Table 2). Due to the different enzyme affinities, for each tested sample, the C-EPC (Catechin Equivalent Phenol Content) was always lower than the EGCG-EPC (EpiGalloCatechinGallate Equivalent Phenol Content) using the tyrosinase sensor. Whatever the reference compound, the relative phenol content was always more important in green teas than black ones. These results can be explained by the fact that green teas are dried and unfermented products, in which catechins are more preserved than in fully fermented tea (black teas) [44]. Moreover, we noted that Lord Nelson brand presented the highest level of catechins both for the green and the black teas.
3.5. Standards and Tea Samples Analysis Using HPLC
Using a gradient elution, the 7 catechin standard derivatives were successfully separated within 15 minutes (Figure 4). Calibration curves were obtained at 205 nm for
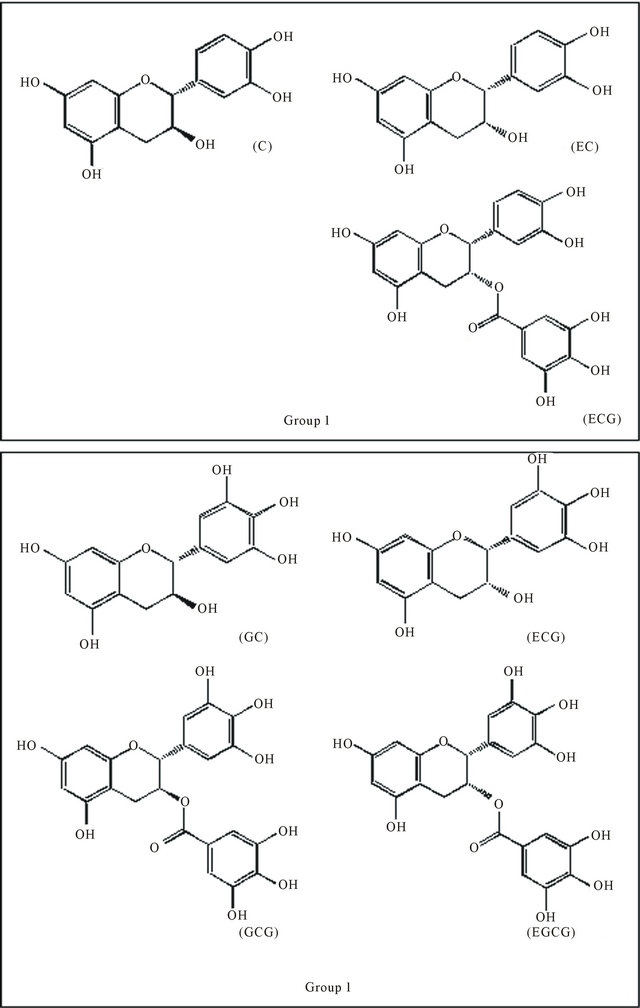
Figure 3. Major catechins present in green and black tea, (C): (+)-catechin; (EC): (−)-epicatechin; (ECG): (−)-epicatechingallate; (GC): (−)-gallocatechin; (EGC): (−)-epigallocatechin; (GCG): (−)-gallocatechingallate and (EGCG): (−)-epigallocateching.
Table 1. Analytical properties of the biosensor CSPE/Tyr/GA for eight substrates.

Table 2. Phenol content in tea samples expressed both in catechin equivalent phenolic content (C-EPC) and epigallocatechin gallate equivalent phenolic content (EGCG-EPC), estimated using the tyrosinase-based biosensor
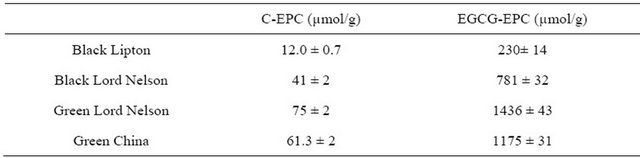
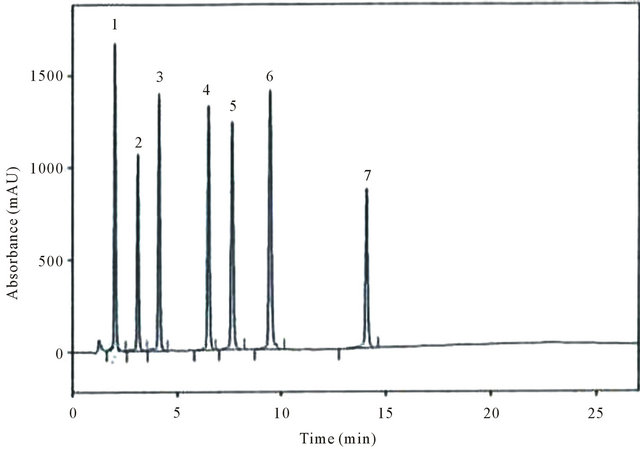
Figure 4. Chromatogram of catechin derivative standards mixture solution “100 µM”: (1): GC; (2): EGC; (3): C; (4): EC; (5): EGCG; (6): GCG and (7): ECG, monitored at UV absorbance detection at 205 nm.
each catechin derivative over the concentration range from 2.5 to 100 µM. After addition of caffeic acid as internal standard, all the tea samples were analysed by HPLC. The chromatogram obtained for green Lord Nelson tea is shown as an example (Figure 5).
In Table 3, the individual catechin content and the total catechin content (TCC) are summarised. The TCC, calculated by the addition of individual catechin amounts (µmol/g), gave an indication of the catechin richness for the 4 teas. The content was ranged from around 40 to 320
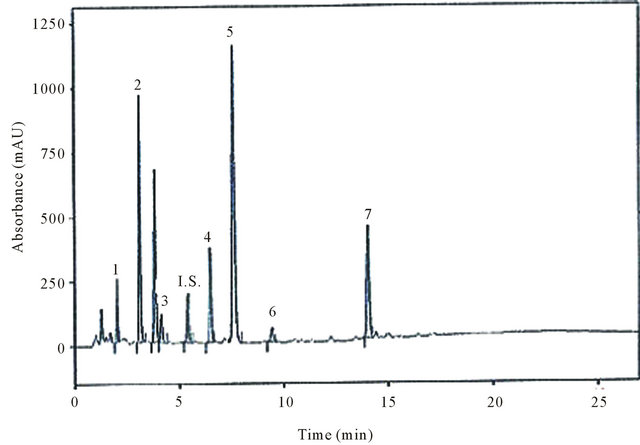
Figure 5. Chromatogram of Green Lord Nelson tea sample, (1): GC; (2): EGC; (3): C; (IS): Internal standard: CA; (4): EC; (5): EGCG; (6): GCG and (7): ECG obtained by HPLC and monitored at UV absorbance detection at 205 nm.
Table 3. Individual and total catechin derivatives content (µmol/g of dry tea) in green and black teas determined by HPLC/DAD.
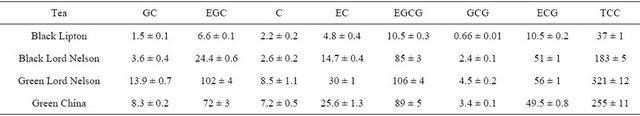
TCC: Total Catechins Content.
µmol/g dry weight. As expected, TCC determined for green teas were higher than that of black teas. The highest level was measured in Green Lord Nelson tea. Significant amounts were also obtained in Green China and Black Lord Nelson teas, while Lipton Black tea contained the lowest quantity. Anyway, the most representative catechins are EGCG, EGC and ECG, and, to a lesser extent, EC. These 4 compounds are known to be the main catechins in teas. Whatever the kind of tea, EGCG was the major component as already described [38,45-47]. However, the proportion of EGC was higher than ECG for green teas while ECG was more abundant in black teas. The differences of TCC for the tested black teas may be explained by the fact that the content of catechins can vary depending on the species, the climate, the cultural practices... In the case of green tea extracts, the conditions and technology used for the extraction and storage can also affect the TCC [43,44]. Anyway, catechins composition profiles allowing the discrimination between green and black teas seem to be conceivable considering these preliminary results.
3.6. Correlation between CSPE/Tyr/GA and HPLC Analysis
First, it can be highlighted that EC was the main component influencing the biosensor response for tea sample analysis. Indeed, this compound was relatively abundant in teas and its sensitivity with the developed biosensor was the most important. Furthermore, in order to justify the usefulness of the developed biosensor, two correlation methods have been established, between the results obtained for tea samples with both HPLC and biosensor methods. Firstly, the expected response of the biosensor for each catechin derivative present in tea was calculated according to its real content estimated by HPLC and its corresponding sensitivity established with biosensor. Then, these individual responses due to each compound contribution were added in order to estimate the global expected response. The following equation illustrates this correlation:
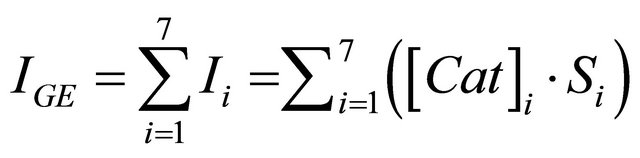
IGE: Global Expected Current (nA).
i: Number of catechin derivatives.
Ii: Individual catechin current response expected by biosensor (nA).
[Cat]: Individual catechin concentration determined by HPLC (µM).
S: Sensitivity of individual catechin obtained with biosensor analysis (presented in Table 1) (nA/µM).
The final results expressed in term of µmol equivalent catechin per g of tea were showed in Table 4 and compared with the real responses obtained with the biosensor. The calculated total phenol contents were always slightly higher than the real ones, probably due to the fouling on the electrode surface. For all the tested tea samples, the recovery percentage was higher than 90%. These observations prove both the applicability of the additivity law and the accuracy of the biosensor. Secondly, a good correlation was found (r = 0.992) when the results expressed in catechin equivalent phenol content obtained with the biosensor were plotted versus the total catechin content achieved with the HPLC method (Figure 6). These suc cessful correlations obtained with different types of tea, confirm the compatibility and the complementarity of these analytical methods and allow the use of CSPE/ tyr/GA for a rapid and in situ measurement of a bioelectrochemical polyphenol index able to give an estimation of phenol content in teas.
4. Conclusion
In the present study, we investigated the optimum analytical conditions for total polyphenol content determination by using tyrosinase biosensor, which was characterized by its ability to detect different polyphenols. CSPE/ tyr/GA was analytically performant. It provided high sensitivity, long lifetime, good operational stability and a rather good reproducibility if we take into account the
Table 4. Expected C-EPC deduced from both HPLC and biosensor analysis, real C-EPC obtained by tyrosinase biosensor.
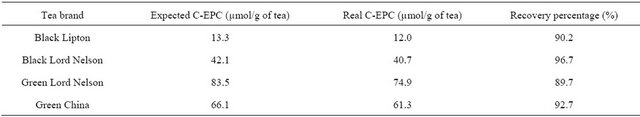
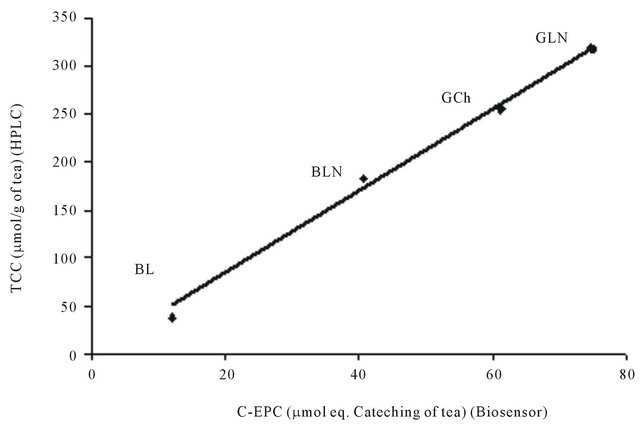
Figure 6. Correlation between the results obtained for tea samples: Black Lipton (BL), Black Lord Nelson (BLN), Green China (GCh) and Green Lord Nelson (GLN) by using the CSPE/tyr/GA biosensor (C-EPC) and the HPLC method (TCC).
cheapness and the easiness of biosensor preparation. Referring to the total phenolic content detected by both methods (biosensor and HPLC), a successful compatibility and complementarity were noted between them. This work revealed that the developed tyrosinase biosensor is useful for a global quantification of catechin content in teas. Even if the findings obtained with HPLC led to the quali-quantitative analysis of catechins, this technique required much more time than the biosensor one, which was performed in a few minutes. Finally, this study presented a simple, time effective, inexpensive biosensor and showed the powerfulness of this alternative tool for tea analysis.
5. Acknowledgements
The PhD student; Saloua NADIFIYINE would like to thank Averroes program (Erasmus Mundus) for the scholarship grant
REFERENCES
- G. G. Duthie, P. T. Gardner and J. A. M. Kyle, “Plant Polyphenols: Are They the New Magic Bullet?” Proceedings of the Nutrition Society, Vol. 62, No. 03, 2003, pp. 599-603. doi:10.1079/PNS2003275
- N. Khan and H. Mukhtar, “Tea Polyphenols for Health Promotion,” Life Sciences, Vol. 81, No. 7, 2007, pp. 519- 533. doi:10.1016/j.lfs.2007.06.011
- S. Gupta, B. Saha and A. K. Giri, “Comparative Antimutagenic and Anticlastogenic Effects of Green Tea and Black Tea: A Review,” Mutation Research/Reviews in Mutation Research, Vol. 512, No. 1, 2002, pp. 37-65. doi:10.1016/S1383-5742(02)00024-8
- P. C. H. Hollman and M. B. Katan, “Dietary Flavonoids: Intake, Health Effects and Bioavailability,” Food and Chemical Toxicology, Vol. 37, No. 9-10, 1999, pp. 937- 942. doi:10.1016/S0278-6915(99)00079-4
- J. Hong, T. J. Smith, C. Ho, D. A. August and C. S. Yang, “Effects of Purified Green and Black Tea Polyphenols on Cyclooxygenaseand Lipoxygenase-Dependent Metabolism of Arachidonic Acid in Human Colon Mucosa and Colon Tumor Tissues,” Biochemical Pharmacology, Vol. 62, No. 9, 2001, pp. 1175-1183. doi:10.1016/S0006-2952(01)00767-5
- Y. Kuroda and Y. Hara, “Antimutagenic and Anticarcinogenic Activity of Tea Polyphenols,” Mutation Research/Reviews in Mutation Research, Vol. 436, No. 1, 1999, pp. 69-97. doi:10.1016/S1383-5742(98)00019-2
- J. Sano, T. Ogawa, S. Inami, F. Ishibashi, K. Okamatsu, H. Kamon, K. Seimiya, G. Takagi, S. Sakai, A. Nomura and K. Mizuno, “Effect of Green Tea Intake on the Development of Coronary Artery Disease,” Journal of the American College of Cardiology, Vol. 41, No. 6, 2003, pp. 531-531. doi:10.1016/S0735-1097(03)82849-8
- S. Uesato, Y. Kitagawa, M. Kamishimoto, A. Kumagai, H. Hori and H. Nagasawa, “Inhibition of Green Tea Catechins against the Growth of Cancerous Human Colon and Hepatic Epithelial Cells,” Cancer Letters, Vol.170, No 1, 2001, pp. 41-44. doi:10.1016/S0304-3835(01)00571-7
- J. A. Vinson, K. Teufel and N. Wu, “Green and Black Teas Inhibit Atherosclerosis by Lipid, Antioxidant, and Fibrinolytic Mechanisms,” Journal of Agricultural and Food Chemistry, Vol. 52, No. 11, 2004, pp. 3661-3665. doi:10.1021/jf035255l
- J. M. Launer, L. J. Geleijnse, A. Hofman, H. A. P. Pols, J. C. M. Witteman, “Tea Flavonoids May Protect against Atherosclerosis: The Rotterdam Study,” Archives of Internal Medicine, Vol. 159, No. 18, 1999, pp. 2170-2174.
- L. Lin, P. Chen and J. M. Harnly, “New Phenolic Components and Chromatographic Profiles of Green and Fermented Teas,” Journal of Agricultural and Food Chemistry, Vol. 56, No. 17, 2008, pp. 8130-8140. doi:10.1021/jf800986s
- M. Friedman, C. E. Levin, S. H. Choi, E. Kozukue and N. Kozukue, “HPLC Analysis of Catechins, Theaflavins, and Alkaloids in Commercial Teas and Green Tea Dietary Supplements: Comparison of Water and 80% Ethanol/Water Extracts,” Journal of Food Science, Vol. 71, No. 6, 2006, pp. C328-C337. doi:10.1111/j.1750-3841.2006.00090.x
- A. P. Neilson, R. J. Green, K. V. Wood and M. G. Ferruzzi, “High-Throughput Analysis of Catechins and theaflavins by high performance liquid chromatography with Diode Array Detection,” Journal of Chromatography A, Vol. 1132, No. 1-2, 2006, pp. 132-140. doi:10.1016/j.chroma.2006.07.059
- S. T. Saito, A. Welzel, E. S. Suyenaga and F.Bueno, “A Method for Fast Determination of Epigallocatechin Gallate (EGCG), Epicatechin (EC), Catechin (C) and Caffeine (CAF) in Green Tea Using HPLC,” Ciência e Tecnologia de Alimentos, Vol. 26, No. 2, 2006, pp. 394- 400. doi:10.1590/S0101-20612006000200023
- X. R. Yang, C. X. Ye, J. K. Xu and Y. M. Jiang, “Simultaneous Analysis of Purine Alkaloids and Catechins in Camellia Sinensis, Camellia Ptilophylla and Camellia Assamica var. Kucha by HPLC,” Food Chemistry, Vol. 100, No. 3, 2007, pp. 1132-1136. doi:10.1016/j.foodchem.2005.11.021
- J. J. Dalluge and B. C. Nelson, “Determination of Tea Catechins,” Journal of Chromatography A, Vol. 881, No. 1-2, 2000, pp. 411-424. doi:10.1016/S0021-9673(00)00062-5
- A. Escarpa and M. C. Gonzalez, “An Overview of Analytical Chemistry of Phenolic Compounds in Foods,” Critical Reviews in Analytical Chemistry, Vol. 31, No. 2, 2001, pp. 57-139. doi:10.1080/20014091076695
- P. A. Kilmartin and C. F. Hsu, “Characterisation of Polyphenols in Green, Oolong, and Black Teas, and in Coffee, Using Cyclic Voltammetry,” Food Chemistry, Vol. 82, No. 4, pp. 501-512. doi:10.1016/S0308-8146(03)00066-9
- J. Piljac-Zegarac, L. Valek, S. Martinez and A. Belscak, “Fluctuations in the Phenolic Content and Antioxidant Capacity of Dark Fruit Juices in Refrigerated Storage,” Food Chemistry, Vol. 113, No. 2, 2009, pp. 394-400. doi:10.1016/j.foodchem.2008.07.048
- I. Novak, M. Seruga and S. Komorsky-Lovric, “Characterisation of Catechins in Green and Black Teas Using Square-Wave Voltammetry and RP-HPLC-ECD,” Food Chemistry, Vol. 122, No. 4, 2010, pp. 1283-1289. doi:10.1016/j.foodchem.2010.03.084
- A. Romani, M. Minunni, N. Mulinacci, P. Pinelli, F. F. Vincieri, M. Del Carlo and M. Mascini, “Comparison among Differential Pulse Voltammetry, Amperometric Biosensor, and HPLC/DAD Analysis for Polyphenol Determination,” Journal of Agricultural and Food Chemistry, Vol. 48, No. 4, 2000, pp. 1197-1203. doi:10.1021/jf990767e
- F. de Lima, B. G. Lucca, A. M. J. Barbosa, V. S. Ferreira, S. K. Moccelini, A. C. Franzoi and I. C. Vieira, “Biosensor Based on Pequi Polyphenol Oxidase Immobilized on Chitosan Crosslinked with Cyanuric Chloride for Thiodicarb Determination,” Enzyme and Microbial Technology, Vol. 47, No. 4, 2010, pp. 153-158. doi:10.1016/j.enzmictec.2010.05.006
- M. Diaconu, S. C. Litescu and G. L. Radu, “LaccaseMWCNT-Chitosan Biosensor: A New Tool for Total Polyphenolic Content Evaluation from in Vitro Cultivated Plants,” Sensors and Actuators B: Chemical, Vol. 145, No. 2, 2010, pp. 800-806. doi:10.1016/j.snb.2010.01.064
- S. C. Fernandes, S. K. Moccelini, C. W. Scheeren, P. Migowski, J. Dupont, M. Heller, G. A. Micke and I. C. Vieira, “Biosensor for Chlorogenic Acid Based on an Ionic Liquid Containing Iridium Nanoparticles and Polyphenol Oxidase,” Talanta, Vol. 79, No. 2, 2009, pp. 222- 228. doi:10.1016/j.talanta.2009.03.039
- P. Ibarra-Escutia, J. J. Gómez, C. Calas-Blanchard, J. L. Marty and M. T.Ramírez-Silva, “Amperometric Biosensor Based on a High Resolution Photopolymer Deposited onto a Screen-Printed Electrode for Phenolic Compounds Monitoring in Tea Infusions,” Talanta, Vol. 81, No. 4-5, 2010, pp. 1636-1642. doi:10.1016/j.talanta.2010.03.017
- J. Kulys and R. Vidziunaite, “Amperometric Biosensors Based on Recombinant Laccases for Phenols Determination,” Biosensors and Bioelectronics, Vol. 18, No. 2-3, 2003, pp. 319-325. doi:10.1016/S0956-5663(02)00172-0
- L. D. Mello, M. D. P. T. Sotomayor and L. T. Kubota, “HRP-Based Amperometric Biosensor for the Polyphenols Determination in Vegetables Extract,” Sensors and Actuators B: Chemical, Vol. 96, No. 3, 2003, pp. 636- 645. doi:10.1016/j.snb.2003.07.008
- L. D. Mello, A. A. Alves, D. V. Macedo and L. T. Kubota, “Peroxidase-Based Biosensor as a Tool for a Fast Evaluation of Antioxidant Capacity of Tea,” Food Chemistry, Vol. 92, No. 3, 2005, pp. 515-519. doi:10.1016/j.foodchem.2004.08.019
- B. Prieto-Simón, M. Cortina, M. Campàs and C. CalasBlanchard, “Electrochemical Biosensors as a Tool for Antioxidant Capacity Assessment,” Sensors and Actuators B: Chemical, Vol. 129, No. 1, 2008, pp. 459-466. doi:10.1016/j.snb.2007.08.004
- K. S. Abhijith, P. V. S. Kumar, M. A. Kumar and M. S. Thakur, “Immobilised Tyrosinase-Based Biosensor for the Detection of Tea Polyphenols,” Analytical and Bioanalytical Chemistry, Vol. 389, No. 7, 2007, pp. 2227- 2234. doi:10.1007/s00216-007-1604-5
- V. Carralero, M. L. Mena, A. Gonzalez-Cortés, P. YáñezSedeño and J. M. Pingarrón, “Development of a High Analytical Performance-Tyrosinase Biosensor Based on a Composite Graphite-Teflon Electrode Modified with Gold Nanoparticles,” Biosensors and Bioelectronics, Vol. 22, No. 5, 2006, pp. 730-736. doi:10.1016/j.bios.2006.02.012
- M. A. Kim and W. Lee, “Amperometric Phenol Biosensor Based on Sol-Gel Silicate/Nafion Composite Film,” Analytica Chimica Acta, Vol. 479, No. 2, 2003, pp. 143- 150. doi:10.1016/S0003-2670(02)01538-6
- Rajesh, W. Takashima and K. Kaneto, “Amperometric Phenol Biosensor Based on Covalent Immobilization of Tyrosinase onto an Electrochemically Prepared Novel Copolymer Poly (N-3-Aminopropyl Pyrrole-Co-Pyrrole) Film,” Sensors and Actuators B: Chemical, Vol. 102, No. 2, 2004, pp. 271-277. doi:10.1016/j.snb.2004.04.028
- P. Rijiravanich, K. Aoki, J. Chen, W. Surareungchai and M. Somasundrum, “Micro-Cylinder Biosensors for Phenol and Catechol Based on Layer-by-Layer Immobilization of Tyrosinase on Latex Particles: Theory and Experiment,” Journal of Electroanalytical Chemistry, Vol. 589, No. 2, 2006, pp. 249-258. doi:10.1016/j.jelechem.2006.02.019
- H. B. Yildiz, J. Castillo, D. A. Guschin, L. Toppare and W. Schuhmann, “Phenol Biosensor Based on Electrochemically Controlled Integration of Tyrosinase in a Redox Polymer,” Microchimica Acta, Vol. 159, No. 1, 2007, pp. 27-34. doi:10.1007/s00604-007-0768-1
- E. Akyilmaz, E. Yorganci and E. Asav, “Do Copper Ions Activate Tyrosinase Enzyme? A Biosensor Model for the Solution,” Bioelectrochemistry, Vol. 78, No. 2, 2010, pp. 155-160. doi:10.1016/j.bioelechem.2009.09.007
- C. Apetrei, M. L. Rodríguez-Méndez and J. A. De Saja, “Amperometric Tyrosinase Based Biosensor Using an Electropolymerized Phosphate-Doped Polypyrrole Film as an Immobilization Support. Application for Detection of Phenolic Compounds,” Electrochimica Acta, Vol. 56, No. 24, 2011, pp. 8919-8925. doi:10.1016/j.electacta.2011.07.127
- B. Lee and C. Ong, “Comparative Analysis of Tea Catechins and Theaflavins by High-Performance Liquid Chromatography and Capillary Electrophoresis,” Journal of Chromatography A, Vol. 881, No. 1-2, 2000, pp. 439-447. doi:10.1016/S0021-9673(00)00215-6
- A. Arecchi, M. Scampicchio, S. Drusch and S. Mannino, “Nanofibrous Membrane Based Tyrosinase-Biosensor for the Detection of Phenolic Compounds,” Analytica Chimica Acta, Vol. 659, No. 1-2, 2010, pp. 133-136. doi:10.1016/j.aca.2009.11.039
- H. Zejli, J. L. Hidalgo-Hidalgo de Cisneros, I. NaranjoRodriguez, B. Liu, K. R. Temsamani and J. L. Marty, “Phenol Biosensor Based on Sonogel-Carbon Transducer with Tyrosinase Alumina Sol-Gel Immobilization,” Analytica Chimica Acta, Vol. 612, No. 2, 2008, pp. 198-203. doi:10.1016/j.aca.2008.02.029
- Y. Li, Z. Liu, Y. Liu, Y. Yang, G. Shen and R. Yu, “A Mediator-Free Phenol Biosensor Based on Immobilizing Tyrosinase to ZnO Nanoparticles,” Analytical Biochemistry, Vol. 349, No. 1, 2006, pp. 33-40. doi:10.1016/j.ab.2005.11.017
- M. El Kaoutit, I. Naranjo-Rodriguez, K. R. Temsamani, and J. L. Hidalgo-Hidalgo de Cisneros, “The SonogelCarbon Materials as Basis for Development of Enzyme Biosensors for Phenols and Polyphenols Monitoring: A Detailed Comparative Study of Three Immobilization Matrixes,” Biosensors and Bioelectronics, Vol. 22, No. 12, 2007, pp. 2958-2966. doi:10.1016/j.bios.2006.12.008
- A. M. Girelli, E. Mattei and D. Papaleo, “Tyrosinase Immobilized Reactor as a Fast Tool for Polyphenolic Index of Tea,” Journal of Food Composition and Analysis, Vol. 22, No. 7-8, 2009, pp. 709-713. doi:10.1016/j.jfca.2009.04.006
- M. Pelillo, B. Biguzzi, A. Bendini, T. Gallina Toschi, M. Vanzini and G. Lercker, “Preliminary Investigation into Development of HPLC with UV and MS-Electrospray Detection for the Analysis of Tea Catechins,” Food Chemistry, Vol. 78, No. 3, 2002, pp. 369-374. doi:10.1016/S0308-8146(02)00112-7
- C. Cabrera, R. Artacho and R. Giménez, “Beneficial Effects of Green Tea—A Review,” Journal of the American College of Nutrition, Vol. 25, No. 2, 2006, p. 79.
- H. Mukhtar and N. Ahmad, “Tea Polyphenols: Prevention of Cancer and Optimizing Health,” The American Journal of Clinical Nutrition, Vol. 71, No. 6, 2000, p. 1698S.
- L. Yao, Y. Jiang, N. Datta, R. Singanusong, X. Liu, J. Duan, K. Raymont, A. Lisle and Y. Xu, “HPLC Analyses of Flavanols and Phenolic Acids in the Fresh Young Shoots of Tea (Camellia sinensis) Grown in Australia,” Food Chemistry, Vol. 84, No. 2, 2004, pp. 253-263. doi:10.1016/S0308-8146(03)00209-7
NOTES
*Corresponding author.