Food and Nutrition Sciences
Vol. 3 No. 11 (2012) , Article ID: 24498 , 10 pages DOI:10.4236/fns.2012.311205
Individual and Combined Effects of Nucleotides and Human Milk Oligosaccharides on Proliferation, Apoptosis and Necrosis in a Human Fetal Intestinal Cell Line
![]()
1Division of Nutritional Sciences, Urbana, USA; 2Department of Food Science & Human Nutrition, University of Illinois, Urbana, USA.
Email: sdonovan@illinois.edu
Received October 4th, 2012; revised November 4th, 2012; accepted November 11th, 2012
Keywords: Epithelial Cells; Human Milk Oligosaccharides; Nucleotides; Intestine; Proliferation
ABSTRACT
Nucleotides (NT) and human milk oligosaccharides (HMO) individually affect epithelial cell growth, but their combined effects had not been studied. Herein, the impact of NT and HMO on cell proliferation, apoptosis, necrosis and cell cycle in the fetal epithelial cell line (FHs-74 Int) was determined. Cells were incubated with media containing 2.5% FBS and no epidermal growth factor (Control); fucosyllactose (FL) mix [85% 2’FL/15% 3’FL], sialyllactose (SL) mix [40% 6’SL/10% 3’SL/50% sialic acid (SA)] or LNnT at 125, 250, 500 or 1000 μg/mL with and without 250 μg/mL NT (43% CMP, 18.5% UMP, 16.4% AMP, and 22.0% GMP) for 24 or 72 h. NT alone significantly increased proliferation, but did not affect cell cycle or apoptosis/necrosis. All HMO treatments at 1000 μg/mL significantly decreased proliferation and some were also inhibitory at 250 or 500 μg/mL. When NT and HMO were simultaneously added, NT ameliorated the anti-proliferative effect of HMO. FL significantly increased cells in S phase and SL and LNnT treatments significantly increased cells in G2/M and S phases, which concomitantly decreased cells in G0/G1. HMO with NT significantly decreased the percent of cells in the G2/M phase compared to HMO alone. Higher HMO doses significantly increased the percentage of apoptotic and necrotic cells compared to control. In conclusion, HMO reduced cell proliferation and this effect is partially ameliorated by NT. It appears that HMO initially induced apoptosis/necrosis, which was later evidenced by G2/M cell cycle arrest and decreased proliferation.
1. Introduction
Intestinal epithelial cells are exposed to numerous dietary constituents that can regulate growth-related characteristics. Human milk (HM) contains numerous bioactive components that are thought to work in concert to promote optimal neonatal development [1], and ingredients have been added to infant formula to more closely reflect HM composition. Nucleotides (NT) are currently supplemented to infant formula and human milk oligosaccharides (HMO) are being investigated as potential additives. Both ingredients impact epithelial cell growth [2-4]; however their combined effects had not previously been examined.
Nucleotides are low molecular weight compounds that consist of a nitrogenous base (purine and pyrimidine bases), a sugar molecule (pentose), and 1 - 3 phosphate groups. They are natural components of HM and are present in higher concentrations than bovine milk, from which most infant formulas are made. Using the total potentially available nucleosides (TPAN) method of analysis, the NT content of HM was determined to be 72 mg/L [5]. Currently, most infant formulas are being fortified with ~70 mg NT/L. Dietary NT exert various physiological functions and may be of particular importance for growth of tissues with rapid turnover rates, such as the intestinal mucosa [6]. Previous studies have shown that NT induce cell proliferation in both transformed (Caco-2) and non-transformed intestinal cells (IEC-6) [2,7], particularly in cells that are in partially serum-deprived culture conditions.
At 12 - 15 g/L in mature milk, HMO are the third most abundant constituent of HM [8,9]. The composition of HMO is uniquely complex compared to other species and their concentration 100-fold higher than oligosaccharides in bovine milk (~0.1 g/L) [10,11]. Approximately 200 different HMO [12], which vary in size, structure and abundance, have been identified in HM [9]. Lactose present on the non-reducing end of HMO can be fucosylated in α1-2 and α1-3 linkages to form 2’fucosyllactose (2’FL) and 3’fucosyllactose (3’FL), respectively. Lactose can also be sialylated on the non-reducing end in α2-3 and/or α2-6 linkages to form 3’sialyllactose (3’SL) and 6’sialyllactose (6’SL), respectively. Even more complex HMO can be made by different combinations of monosaccharides. Recent evidence suggests that HMO can alter growth-related characteristics of both transformed (HT-29 and Caco-2) and non-transformed (HIEC) intestinal cells [4]. In HT-29 cells, all neutral and acidic oligosaccharides, except for 2’FL and 3’FL, inhibited cell growth.
Thus, NT increase epithelial cell proliferation [2], while HMO have an anti-proliferative effect [3,4]. However, HM and infant formula contain multiple ingredients that can modulate intestinal proliferation. Therefore, it is important to determine how NT and HMO would interact in order to better understand how adding HMO to an infant formula already containing NT may affect intestinal cell growth. Based on the previous literature, we hypothesized that NT alone would increase proliferation, HMO would decrease proliferation, and when added together, NT would counteract the anti-proliferative effects of HMO. In addition to proliferation, cell cycle, apoptosis and necrosis were measured by using flow cytometry and cyclin expression was assessed using PCR.
2. Materials and Methods
2.1. Cell-Line and Culture Conditions
A primary intestinal cell line of human fetal origin FHs-74 Int cells was obtained from the American Type Culture Collection (ATCC catalog no. CCL-241, Manassas, VA). Cells were maintained in 75 cm2 tissue culture flasks (BD Biosciences, Bedford, MA) in 46-X medium (ATCC, Manassas, VA) containing ingredients of a modified Dulbecco’s modified Eagle’s medium (DMEM), insulin, HEPES, and NaHCO3 supplemented with 30 ng/mL epidermal growth factor (EGF) (Sigma-Aldrich, St. Louis, MO), 10% fetal bovine serum (Gibco Invitrogen, Carlsbad, CA), 100 µg/mL penicillin, 100 µg/mL streptomycin and 50 µg/mL gentamicin (Life Technologies Invitrogen). The 46-X medium containing 30 ng EGF/mL and 10% FBS will be referred to as full medium. Cells were grown in a tissue culture incubator (Forma Scientific, Inc., Marietta, OH) at 37˚C with a humidified atmosphere of 5% CO2. Media was changed every 2 - 3 days.
2.2. NT and HMO Treatments
Treatments were added to 46-X medium containing 2.5% FBS and no EGF, which will be referred to as reduced medium, for proliferation, cell cycle and apoptosis/necrosis assays. Individual sialylated and fucosylated HMO were purchased from V-Labs (Covington, LA) and combined into a FL mix (85% 2’FL [product No. L302] and 15% 3’FL [product no. L303]) and a SL mix: (50% sialic acid (SA) [product no. N101], 40% 6’SL [product no. SL306] and 10% 3’SL [product no. SL302]). The FL mix ratios were based on taking concentration of each HMO reported in the literature and then calculating a ratio within HMO FL mix [10,13-16]. For the SL mix, we chose to mimic the total SA content of human milk [11,17-21]. The 6’SL and 3’SL were added at the reported ratio to each other and the remaining total SA was provided as free SA, assuming that some lipid or protein-bound SA could be released by sialidases in the intestine [22] or by microbial fermentation [23]. Lacto-Nneotetraose (LNnT) was donated by Abbott Nutrition (Columbus OH). The SL mix, FL mix and LNnT were tested at 125, 250, 500 or 1000 μg/mL in the absence or presence of 250 μg NT/mL (Sigma-Aldrich). The NT mixture was comprised of 43% CMP, 18.5% UMP, 16.4% AMP, and 22.0% GMP, which is the ratio present in HM and supplemented to infant formula [5]. The NT dose was chosen based on preliminary experiments showing that it was the lowest dose that consistently significantly increased cellular proliferation above control (data not shown). HMO and NT treatments were tested for lipopolysaccharide (LPS) with Limulus Amebocyte Lysate Assay (LAL Assay) (Lonza, Walkersville, MD). LNnT and 2’FL contained LPS above the threshold level (>0.1 endotoxin/mL), therefore samples were eluted through an Endotoxin Removing Gel (Thermo Scientific, Rockford, IL) and then re-tested using the LAL Assay. To determine the specificity of HMO on cell growth related-characteristics, FHs-74 Int cells were incubated with tri-galactose (Dextra, Reading, UK) and lactose (Sigma-Aldrich) at 1000 µg/mL as negative controls. No changes in proliferation, cell death and cell cycle were seen in cells treated with tri-galactose and lactose.
2.3. Proliferation Assay
Cells (7500/well) were plated in 96-well plates (Corning, New York, NY). After initial seeding, cells were grown in full medium (10% FBS, 30 ng/mL EGF) for 24 h, which was replaced with reduced media (2.5% FBS, no EGF) for 24 h. The reduced medium was removed and replaced with reduced media containing NT alone, HMO alone, or a combination of NT and HMO for either 24 or 72 h. No reagents or medium was added to the cultures during the treatment period. At the end of the experiment, 20 μL of CellTiter 96® Aqueous One Solution Reagent (MTS and PES) (Promega, Madison, WI) was added to each well, according to manufacturer’s general protocol, and incubated at 37˚C for 3 h. The absorbance at 490 nm was read on a spectrophotometer (SpectraMax M2e, Molecular Devices, Sunnyvale, CA). Cell numbers were determined based on a calibration curve using cell counts between 500 and 64,000. Proliferation data are expressed as a percentage of control (media alone).
2.4. Cell Cycle Assay
Cells (80,000/well) were plated in 24-well plates (Becton Dickinson, Franklin Lakes, NJ) and treated as described for cell proliferation assay. The cells were removed from the plate by incubating with trypsin-EDTA solution, 0.25% (Sigma-Aldrich) for 5min at 37˚C and placed in conical tubes. Cells were then pelleted by centrifugation at 500 × g for 5 min and washed twice with PBS. Cells were then fixed by suspending them in 70% ethanol at −20˚C for 24 h. Thereafter, the suspension was centrifuged for 5min at 500 × g, and the pellet was washed twice with PBS. After washing and centrifugation, cells were incubated and stained with 0.5 mL (5 μg/mL) propidium iodide (PI) (Sigma-Aldrich) for 30 min at room temperature. Cell cycle analysis was performed using a LSRII flow cytometer (BD Biosciences, San Jose, CA) and analyzed using FlowJo version 7.0 software (FlowJo, Ashland, OR). The first peak represented cells in the G0/G1 phase of the cell cycle, the second peak represented cells in the G2/M phase. The intervening cells between the two peaks were in the S-phase of the cell cycle.
2.5. Apoptosis and Necrosis Assay
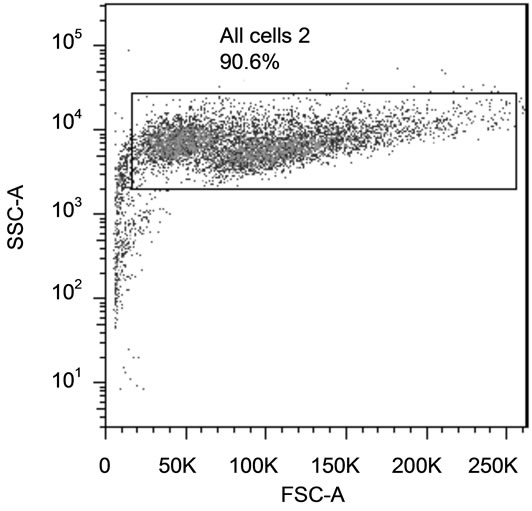
Cells (80,000/well) were plated in 24-well plates (Becton Dickinson) and treated as described for cell proliferation assay. The cells were trypsinized (Sigma-Aldrich), put into conical tubes, pelleted by centrifugation at 500 g for 5min and washed twice with PBS. The cells were then stained for apoptosis (Annexin-V) and necrosis (PI) using the Annexin-V-FLUOS Staining Kit (Roche, Indianapolis, IN) following the manufacturer’s protocol. Labeled Annexin-V has a high affinity for phosphatidylserine (PS), which is exposed on the outer layer of apoptotic cells. Since necrotic cells also expose PS as a result of lost membrane integrity, PI is utilized as a DNA stain to distinguish necrotic cells from apoptotic Annexin-Vlabeled cell clusters. Staining was assessed using a LSRII flow cytometer (BD Biosciences). Representative side scatter and quadrants from the flow separation are shown is Figure 1. The relative proportion of apoptotic and necrotic populations was determined using FlowJo version 7.0 software (FlowJo).
2.6. Cyclin mRNA Expression
Cells (80,000/well) were plated in 24-well plates (Becton Dickinson) and treated as described for cell proliferation
 (a)
(a)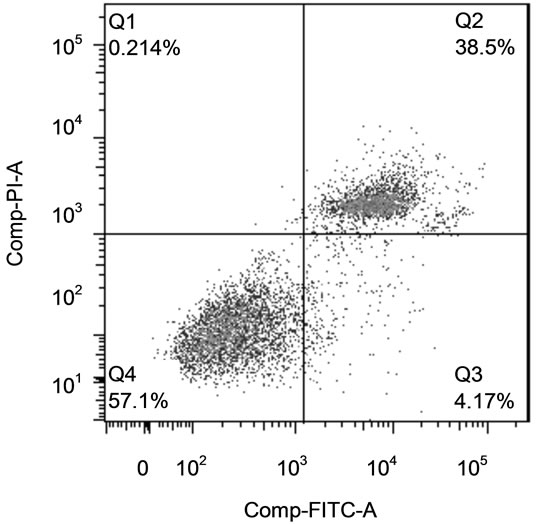 (b)
(b)
Figure 1. Identification of Apoptotic and Necrotic Cells by Flow Cytometry. (a) Cells were selected on the side scatter vs. forward scatter plot; (b) Annexin vs. PI staining. Cells in bottom left quadrant were live cells (Annexin − PI −), bottom right quadrant were apoptotic cells (Annexin + PI −) and upper right quadrant cells were be necrotic cells (Annexin + PI +).
assay, except cells were only exposed treatments for 24 h and only the highest HMO dose (1000 µg/mL) with or without NT was tested. Total RNA from intestinal cells was isolated using the Qiagen, RNeasy Plus Mini Kit (Applied Biosystems, Foster City, CA) following the manufacturer’s protocol. RNA was quantified by measuring the absorbance at 260 nm using a Nanodrop 1000 (Thermo Scientific), and the purity assessed by the 260/ 280 nm absorbance ratio. Reverse transcription was performed on 0.1 µg total RNA in a reaction volume of 20 µL (High Capacity cDNA Reverse Transcription KitApplied Biosystems). TaqMan® PreAmp Master Mix Kit was then used following the manufacturer’s protocol with 10 cycles of amplification. The preamplification products were diluted 1:5 and analyzed by quantitative real-time PCR in TaqMan® custom primers and probes or gene expression assays of target genes: Cyclin A (Hs00996788_m1) and Cyclin B (Hs01565448_g1). Reference cDNA glyceraldehyde 3-phosphate dehydrogenase (GAPDH; Hs02758991_g1) was used as an endogenous control (Applied Biosystems). All reactions were analyzed using the 7900HT Fast Real-Time PCR Detection System instrument and software (Applied Biosystems). Assays were performed in 10 μL singleplex reactions containing TaqMan® Universal PCR Master Mix, customized primers and probes, and cDNA according to the manufacturer’s instructions (Applied Biosystems). Universal reaction conditions were used as follows: 2 min at 50˚C and 10 min at 95˚C and then 40 cycles of 15 sec at 95˚C and 1 min at 60˚C. Each reaction was run in triplicate. The expression levels of genes were standardized to GAPDH mRNA and expressed as fold differences, which corresponds to a ratio to the mean value for control cells.
2.7. Statistical Analysis
Statistical analyses were performed using SAS (Version 6.09, SAS Institute, Cary, NC). All data were analyzed by 2-way ANOVA using the GLM procedure to determine the effects of HMO treatments, NT treatments and their interactions. In the event of a significant main effect, a post hoc Least Significant Difference test was used. Statistical significance was defined as p < 0.05 and trends were reported as p < 0.1. Data are presented as mean ± SD.
3. Results
3.1. Proliferation Assay
NT alone increased proliferation (p = 0.0032) at both 24 and 72 h and all HMO treatments at 1000 µg/mL significantly reduced proliferation at 72 h. The degree of inhibition of proliferation increased (p = 0.0365) with longer HMO exposure, 72 h vs. 24 h (Table 1). Overall, these data demonstrate a dose-dependent and timedependent growth inhibition response to HMO. At 72, but not 24 h, all FL mix doses significantly decreased proliferation compared to media alone. The addition of NT abolished the anti-proliferative effect of the FL mix at 72 h. For SL, the 250, 500 and 1000 µg/mL decreased proliferation at 24 h, which was abolished by NT. At 72 h, the results were less consistent. The 500 and 1000 µg/mL SL treatment significantly decreased proliferation. The addition of NT ameliorated the anti-proliferative effect of the 500 µg/mL dose, but the 250 and 1000 µg/mL SL mix doses still reduced proliferation, even in the presence of NT. For LNnT, none of the doses were inhibitory at 24 h and only the 500 and 1000 µg/mL
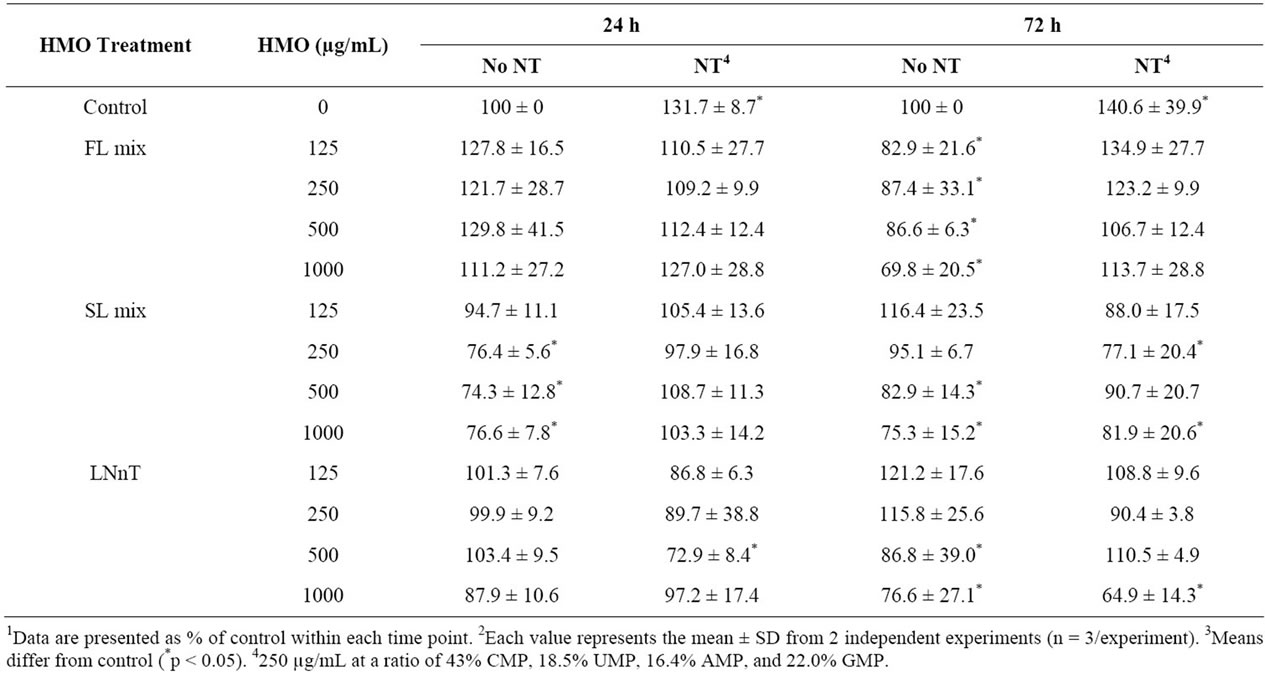
Table 1. Nucleotides ameliorate HMO-induced reductions in cellular proliferation1,2,3.
doses significantly decreased proliferation at 72 h. The addition of NT decreased the anti-proliferative effects at the LNnT at the 500, but not 1000 µg/mL dose.
3.2. Cell Cycle Analysis
Although NT increased proliferation rate, it did not affect the distribution of cells in each phase of the cell cycle compared to control. HMO had greater effects on cell cycle phases at 24 h (Figure 2) than at 72 h (Table 2). At 24 h, FL mix treatments without NT significantly decreased the percentage of cells in G0/G1 phase and increased cells in S phase. The percentage of cells in G2/M phase was not significantly affected by FL mix. At 72 h, FL mix with NT significantly increased cells in S phase and FL mix with and without NT increased the number of cells in G2/M phase. At 24 h, SL mix at 500 or 1000 µg/mL without NT had decreased the percentage of cells in the G0/G1 phase and increased cells in the S phase. The percentage of cells in G2/M phase was only increased at the highest doses of SL mix, 500 and 1000 µg/mL, without NT. At 72 h, SL mix without NT decreased the number of cells in G0/G1 phase. All doses of SL mix with or without NT significantly increased the number of cells in S phase, but only the 500 and 1000 µg/mL without NT and 250 µg/mL with NT increased cells in G2/M phase. At 24 h, G0/G1 decreased and S phase increased in LNnT treatments without NT. LNnT treatments with NT still showed an increased percent of cells in S phase, but did not show any differences in the proportion of cells in G0/G1 or G2/M phase compared to control. At 72 h, LNnT with or without NT decreased cells in G0/G1 phase, but did not show any differences in the proportion of cells in S and G2/M phase compared to control. Overall, HMO increased the percentage of cells in the G2/M and S phases and concomitantly decreased the cells in the G0/G1 phase at both 24 and 72 h.
3.3. Apoptosis and Necrosis Assay
NT alone did not induce apoptosis or necrosis (Table 3). At 24 h, the 500 and 1000 µg/mL doses of the FL mixes increased both apoptosis and necrosis. This effect was generally not reversed by the presence of NT. For the SL
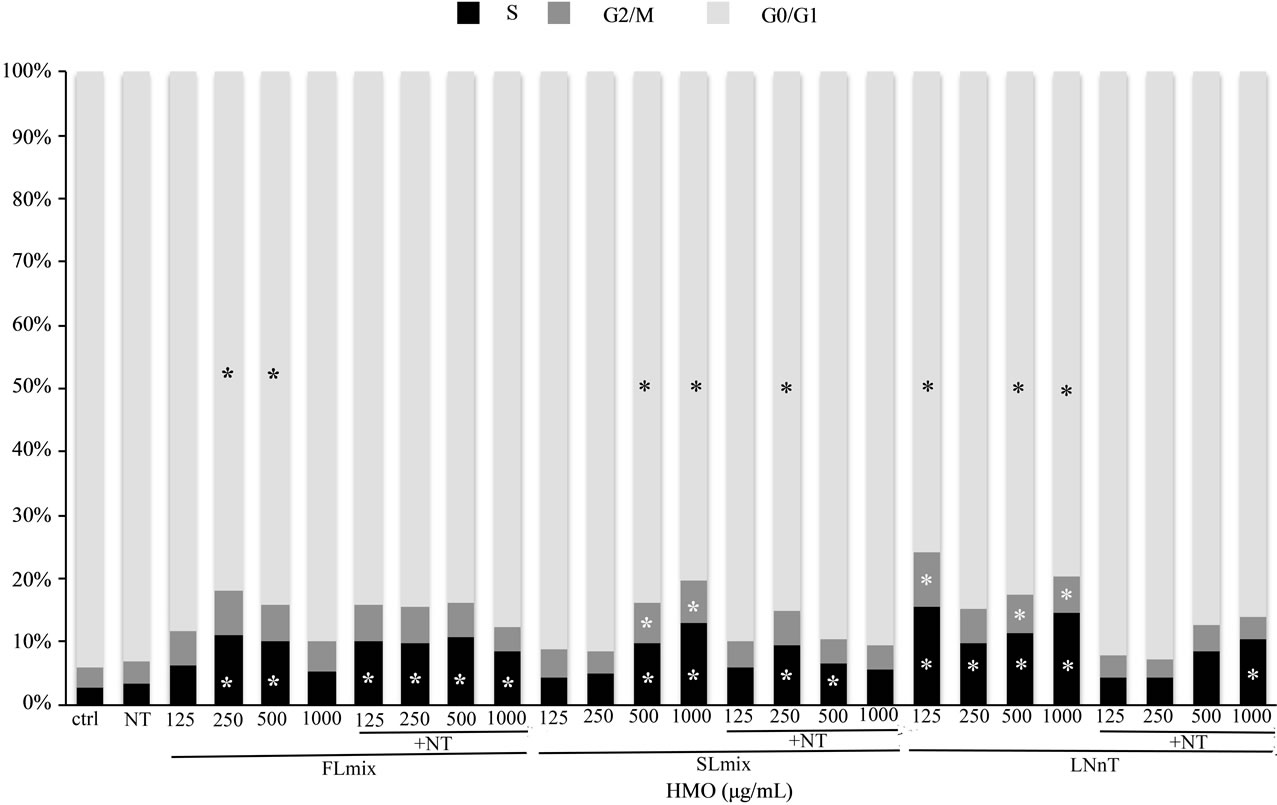
Figure 2. HMO Alters Distribution of Cells in the Cell Cycle at 24 hours. Data are presented as percent of cells in each stage of the cell cycle. FL mix treatments decreased G0/G1 phase and S phase was increased in all treatments except lowest and highest FL mix dose. G2/M was not significantly affected by FL mix. High SL mix treatments without NT had decreased G0/G1 phase and increased S phase. G2/M only increased at higher doses of SL mix without NT. G0/G1 decreased and S phase increased with LNnT treatments. G2/M increased with LNnT treatment but NT abolished this effect. Each value represents the mean from two independent experiments. (n = 2/experiment).
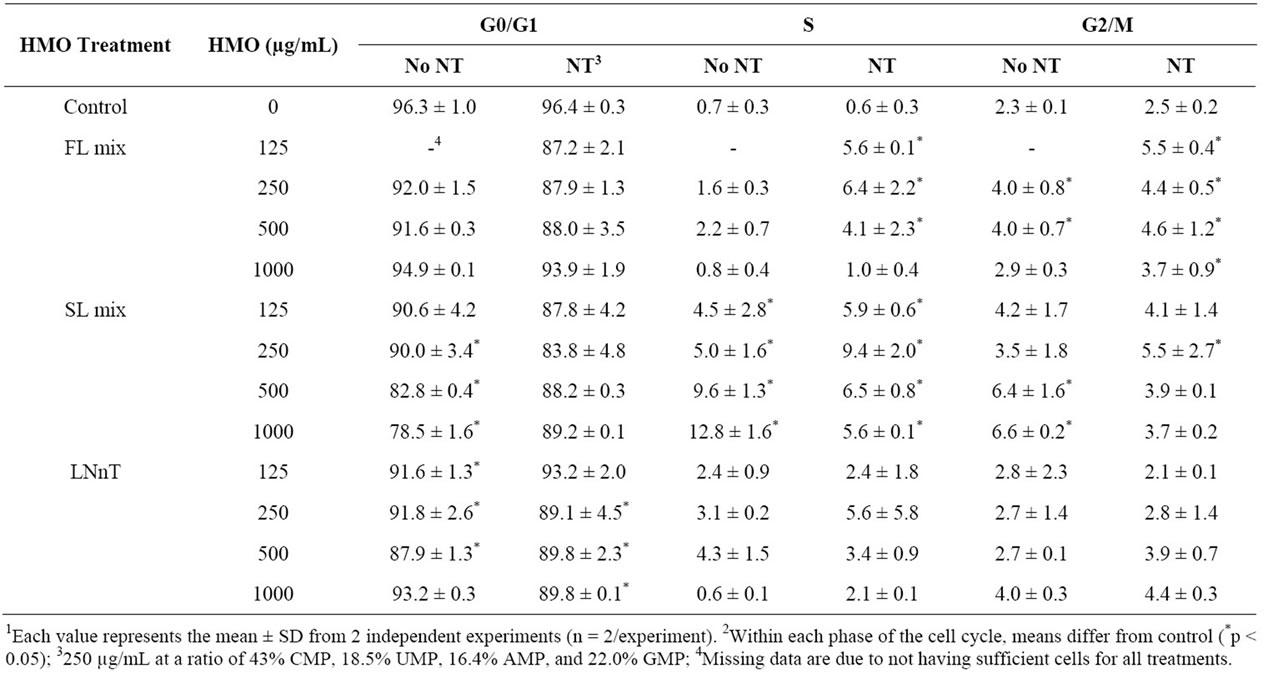
Table 2. Percentage of cells in each phase of the cell cycle in response to NT and HMO treatments for 72 h1,2.
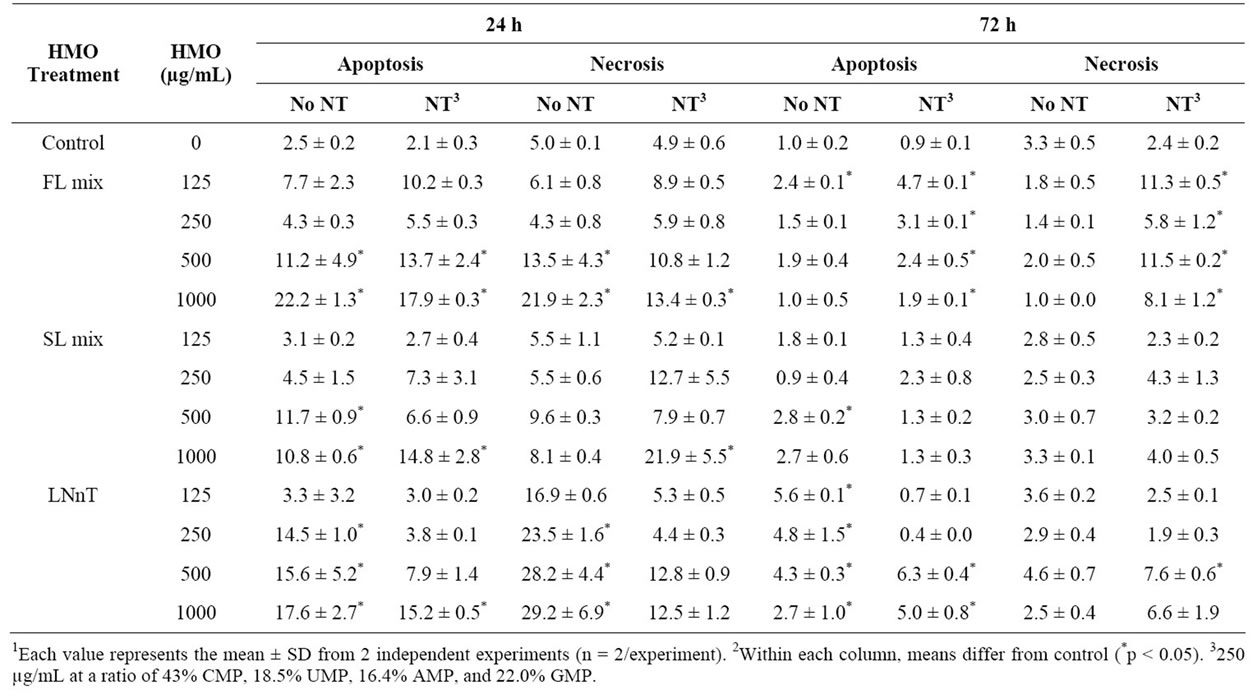
Table 3. Percentage of cells undergoing apoptosis and necrosis in response to NT and HMO treatments for 24 or 72 h1,2.
mix, 500 and 1000 µg/mL doses increased apoptosis, but not necrosis. The addition of NT inhibited the apoptosis induced by the 500, but not 1000 µg/mL dose. The combination of the SL mix + NT induced necrosis compared to control. At 72 h, the percentage of apoptotic and necrotic cells was significantly less than at 24 h and the pattern was less consistent. The exception was that LNnT induced significantly more apoptosis than control at all doses, which was reduced at the 125 and 250 µg/mL doses. For necrosis, the combination of the FL mix and NT appeared to induce more necrosis than control, which was not observed with the FL mix alone.
3.4. Cyclin mRNA Expression
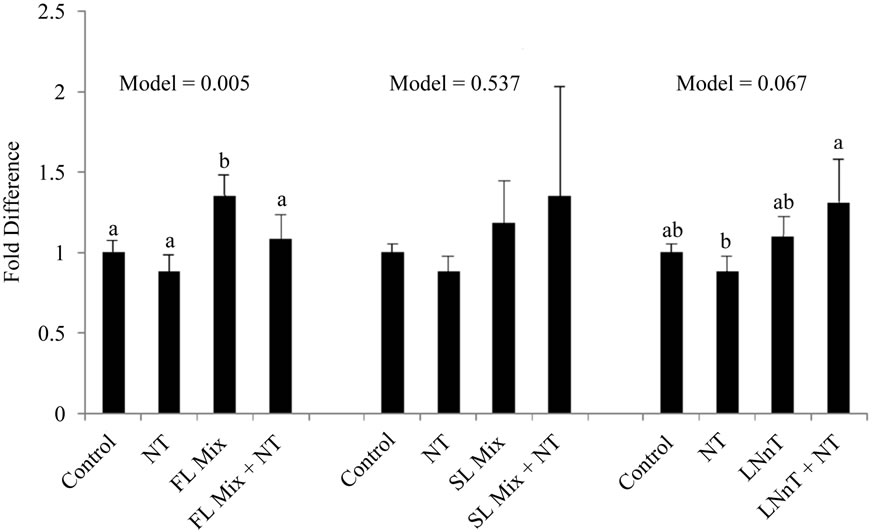
The expression levels of Cyclin A and Cyclin B summarized in Figure 3. After incubation of cells with 1000 µg/mL of the FL mix for 24 h, Cyclin A, a regulator of the S/G2 transition, was significantly increased compared to control cells and Cyclin B, which regulates the G2/M cell cycle transition, remained unchanged. Cells treated with LNnT + NT showed a trend for increased expression of both Cyclin A and Cyclin B compared to cells treated with NT alone. However LNnT treatments were not significantly different from control cells. The SL mix did not cause any changes in Cyclin A or Cyclin B mRNA expression.
4. Discussion
The neonatal intestine undergoes rapid growth and functional development in the early postnatal period. While growth is driven primarily via cell proliferation, apoptosis plays an important role in homeostasis of intestinal epithelia [24]. Human milk components support appropriate intestinal development by promoting both growth
 (a)
(a)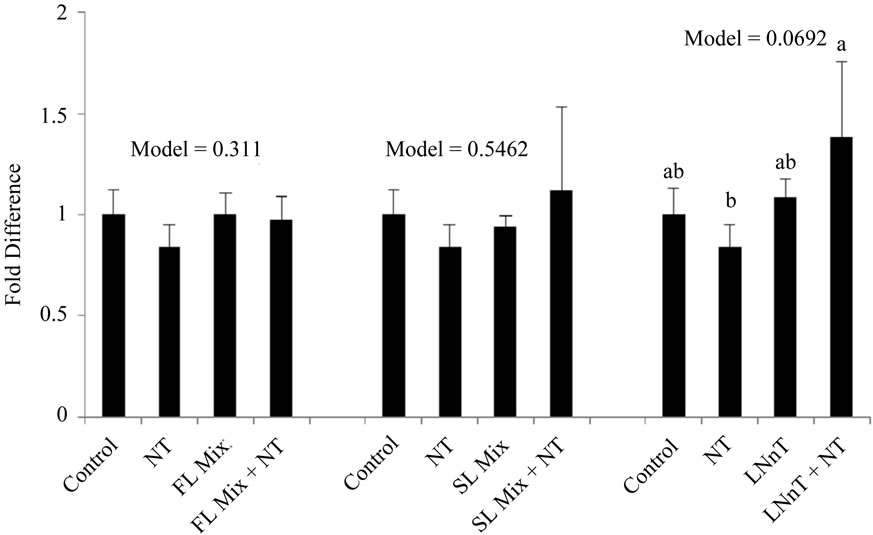 (b)
(b)
Figure 3. HMO Affects Cyclin mRNA Expression at 24 hours. Each value represents the mean ± SD from triplicates. (a) Cyclin A: After incubation of cells with 1000 µg/mL of FL mix for 24 h, Cyclin A was significantly increased compared to control cells. Cells treated with LNnT + NT showed a trend to increase in Cyclin B compared to NT only treated cells; (b) Cyclin B: Cells treated with LNnT + NT showed a trend to increase Cyclin B expression compared to NT only treated cells.
and functional differentiation [25]. Recent studies have suggested that HMO function to down-regulate intestinal proliferation and promote differentiated epithelial cell function [4]. However, HM contains a variety of components that may moderate this effect [5], including NT [5]. Herein, we specifically investigated the interaction between HMO and NT.
FHs-74 Int cells had to be treated in reduced medium to see NT proliferative effects. Preliminary experiments showed that exogenous NT did not stimulate differentiation unless the medium had decreased FBS and no EGF. It has been previously reported that Caco-2 and IEC-6 cells did not benefit from exogenous NT supply unless nutrition supply was limited [2]. One can extrapolate that a rapidly growing neonate could have limited nutrition supply even with adequate HM or infant formula intake. This can explain why NT-supplemented formula increased intestinal growth and immune function compared to formula alone [26,27]. Thus, our cell culture model may be representative of a rapidly growing neonate who would benefit from exogenous NT, since endogenous NT may not be sufficient to sustain maximum intestinal growth.
A concentration-dependent inhibition of the growth of FHs-74 Int cells by both neutral and acidic HMO was observed, which was partially or completely reversed when NT were added to the culture media. To better define how HMO and NT exerted their effects, flow cytometric analyses were carried out to examine cell cycle and apoptosis/necrosis. By examining effects after 24 and 72 h of treatment, it appeared that HMO induced apoptosis/necrosis within 24 h, preceding the G2/M cell cycle arrest and decreased proliferation observed at 72 h. The concentrations of HMO (125 - 1000 µg/mL) added to the cells in the current study is physiologically relevant to what is found in HM.
The growth inhibition induced by both neutral and acidic HMO is consistent with previous reports in which different HMO treatments at 1000 µg/mL were anti-proliferative in cell lines derived from tumors (HT-29, Caco-2 and HIEC) [4]. Kuntz and colleagues demonstrated that 2’FL and 3’FL decreased proliferation of HT-29 cells by 20% and 17.2% by, respectively, but neither decreased proliferation in Caco-2 or HIEC cell lines [4]. Herein, the FL mix decreased FHs-74 Int cell proliferation by 30.2%. In the same study, the acidic HMO, 3’SL and 6’SL, significantly decreased proliferation, by an average of 30.8% in all cell lines [4], which is consistent with the 24.7% decrease in FHs-74 Int cell proliferation in the current study.
Furthermore, accumulation of cells in the G2/M stage of the cell cycle in response to HMO treatments is consistent with previous reports using different intestinal epithelial cell lines [3]. Our data demonstrate that all HMO treatments decreased the percentage of cells in G0/G1 phase, which was also shown by Kuntz and colleagues [4]. However, our data also showed that higher concentrations of FL mix treatments increased the percentage of cells in S phase, and SL mix and LNnT treatments increased the percentage of cells in G2/M and S phases. This could indicate that different HMO act on different stages of the cell cycle.
The transition from one cell cycle phase to another occurs in an orderly fashion and is regulated by different cellular proteins [3]. Key regulatory proteins are the cyclin-dependent kinases (CDK), a family of serine/ threonine protein kinases that are activated at specific points of the cell cycle. The CDK protein levels remain stable during the cell cycle, in contrast to their activating proteins, the cyclins. Cyclin protein levels rise and fall during the cell cycle and in this way they periodically activate CDK. Different cyclins are required at different phases of the cell cycle. Since we observed that FL increased the percentage of cells in S phase, whereas SL mix and LNnT also increased the percentage of cells in G2/M and S phases, we focused on the expression of cyclin A, a regulator for S/G2 transition and cyclin B, which is responsible for the regulation of the G2/M cell cycle transition [3]. In the work of Kuntz and coworkers, G2/M stage cell cycle arrest induced by HMO was associated with increased cyclin B mRNA expression [4]. Cyclin B is a cell cycle regulatory protein that is induced at the G2/M transition and becomes deactivated as the cell exits mitosis.
In the current experiment, cells were exposed to 1000 µg/mL of HMO in the absence or presence of NT for 24 h. Cyclin B mRNA only showed a trend to be increased with LNnT + NT treatments in our experiments. FL and SL mix did not impact cyclin B expression. Additionally Cyclin A, a regulator for S/G2 transition was only significantly increased with the FL mix treatment and remained unchanged for other treatments. The increase in Cyclin A mRNA with the FL mix treatment is consistent with our cell cycle results, wherein the proportion of cells in the S phase was significantly increased after exposure to the FL mix. These results are not as conclusive as previous studies that showed acidic HMO at 15 mg/mL increase both cyclin A and cyclin B expression and neutral HMO mixes at 15 mg/mL significantly increased Cyclin B [3]. Our highest dose for HMO was 1 mg/mL, which is substantially lower than 15 mg/mL used by Kuntz and colleagues [3], which could explain why we did not see a consistent increase in both cyclin A and cyclin B in FHs-74 Int cells.
Intestinal cell growth is a balance of proliferation and apoptosis, thus we also assessed the impact of combined HMO and NT on apoptosis and necrosis. In a previous study, caspase-3 was used to assess apoptosis activity at 24 h in cells treated with HMO [4]. In that study, apoptosis was induced in HT-29 and HIEC cells, but not Caco-2 cells, by neutral HMO at 15 mg/mL, which is above the concentration in HM. However, acidic HMO fractions and individual compounds of the oligosaccharides at 1000 mg/mL did not change caspase-3 activity [4]. Caspase 3 is an early marker of apoptosis [28] and was reported at 24 h by Kuntz and colleagues. It is unknown if this research group measured other time points than 24 h, because our data showed a significant increase in both apoptotic and necrotic cells at 24 h and 72 h when treated with HMO at same concentrations. It is possible that apoptosis occurred in their cells at a later time point. The FHs-74 Int cells may also be more sensitive to HMO than the cell lines previously analyzed by Kuntz and colleagues [4].
Previous studies have shown that HMO induce differentiation of HT-29 and HIEC cells, but not in Caco-2 cells, by measuring alkaline phosphatase activity as a marker for differentiation [4]. However, we utilized FHs-74 Int cells, which are genotypically more similar to immature enterocytes [29]. FHs-74 Int cells are similar to stem-like cells in that they do not express markers of differentiation in vitro [30], which limited our ability to assess effects of NT + HMO on cell differentiation.
In summary, diet is a primary modulator of intestinal epithelial growth and, due to their frequent feeding, the infant’s intestine is nearly continuously bathed in either HM or infant formula. Therefore, understanding how ingredients in HM or infant formula influence intestinal growth characteristics is important [31]. Consistent with previous studies, we demonstrated that both neutral and acidic HMO impacted several important regulators of epithelial growth, namely proliferation, progression through the cell cycle and apoptosis. The current study expanded upon the existing literature by demonstrating that a primary neutral HMO (LNnT) and combinations of fucosylated and sialylated HMO at physiologicallyrelevant concentrations impacted growth characteristics of a human, fetal, non-transformed intestinal cells in vitro. Furthermore, we demonstrated for the first time that the presence of NT, a routine addition to infant formula, inhibited many of the effects of HMO on cell proliferation and cell cycle, but not apoptosis and necrosis. Thus, the inhibitory effects of HMO alone may not be physiologically relevant within the matrix of HM or infant formula. Thus, as new additions to infant formula are considered, it is important to evaluate how they may interact to influence infant development. In vivo studies will be needed to define the effects of HMO alone and HMO in the presence of NT and other bioactive compounds affects intestinal growth characteristics.
5. Acknowledgements
This research was funded by Abbott Nutrition (Columbus, OH). Sharon Donovan (S.D.) has served as a paid consultant for Abbott Nutrition. Shelly Hester (S.H.) was a part-time intern at Abbott Nutrition. The study was designed by S.D. and S.H. S.H conducted the study and analyzed the data. S.H. and S.D. wrote the paper. The authors acknowledge the assistance of Dr. Joseph Schaller (Abbott Nutrition) during the initial design of the study.
REFERENCES
- J. B. German, C. J. Dillard and R. E. Ward, “Bioactive Components in Milk,” Current Opinion in Clinical Nutrition & Metabolic Care, Vol. 5, No. 6, 2002, pp. 653-658. doi:10.1097/00075197-200211000-00007
- E. J. Holen, “Dietary Nucleotides and Intestinal Cell Lines: 1. Modulation of Growth,” Nutrition Research, Vol. 24, 2004, pp. 197-207. doi:10.1016/j.nutres.2003.11.004
- S. Kuntz, C. Kunz and S. Rudloff, “Oligosaccharides from Human Milk Induce Growth Arrest via G2/M by Influencing Growth-Related Cell Cycle Genes in Intestinal Epithelial Cells,” British Journal of Nutrition, Vol. 101, No. 9, 2009, pp. 1306-1315. doi:10.1017/S0007114508079622
- S. Kuntz, S. Rudloff and C. Kunz, “Oligosaccharides from Human Milk Influence Growth-Related Characteristics of Intestinally Transformed and Non-Transformed Intestinal Cells,” British Journal of Nutrition, Vol. 99, No. 3, 2008, pp. 462-471. doi:10.1017/S0007114507824068
- J. L. Leach, J. H. Baxter, B. E. Molitor, et al., “Total Potentially Available Nucleosides of Human Milk by Stage of Lactation,” The American Journal of Clinical Nutrition, Vol. 61, No. 6, 1995, pp. 1224-1230.
- J. R. Hess and N. A. Greenberg, “The Role of Nucleotides in the Immune and Gastrointestinal Systems: Potential Clinical Applications,” Nutrition in Clinical Practice, Vol. 27, No. 2, 2012, pp. 281-294. doi:10.1177/0884533611434933
- F. Rodriguez-Serrano, J. A. Marchal, A. Rios, et al., “Exogenous Nucleosides Modulate Proliferation of Rat Intestinal Epithelial IEC-6 Cells,” Journal of Nutrition, Vol. 137, No. 4, 2007, pp. 879-884.
- D. S. Newburg, “Are All Human Milks Created Equal? Variation in Human Milk Oligosaccharides,” Journal of Pediatric Gastroenterology and Nutrition, Vol. 30, No. 2, 2000, pp. 131-133. doi:10.1097/00005176-200002000-00007
- G. V. Coppa, O. Gabrielli, P. Pierani, et al., “Changes in Carbohydrate Composition in Human Milk over 4 Months of Lactation,” Pediatrics, Vol. 9, No. 3, 1993, pp. 637-641.
- D. S. Newburg, G. M. Ruiz-Palacios, M. Altaye, et al., “Innate Protection Conferred by Fucosylated Oligosaccharides of Human Milk against Diarrhea in Breastfed Infants,” Glycobiology, Vol. l14, No. 3, 2004, pp. 253- 263.
- C. Kunz, S. Rudloff, W. Baier, et al., “Oligosaccharides in Human Milk: Structural, Functional, and Metabolic Aspects,” Annual Review of Nutrition, Vol. 20, 2000, pp. 699-722. doi:10.1146/annurev.nutr.20.1.699
- L. Bode, “Human Milk Oligosaccharides: Prebiotics and Beyond,” Nutrition Reviews, Vol. 67, Suppl. 2, 2009, pp. S183-S191. doi:10.1111/j.1753-4887.2009.00239.x
- S. Asakuma, T. Urashima, M. Akahori, et al., “Variation of Major Neutral Oligosaccharides Levels in Human Colostrum,” European Journal of Clinical Nutrition, Vol. 62, No. 4, 2008, pp. 488-494. doi:10.1038/sj.ejcn.1602738
- P. Chaturvedi P, C. D. Warren, M. Altaye, et al., “Fucosylated Human Milk Oligosaccharides Vary between Individuals and over the Course of Lactation,” Glycobiology, Vol. 11, No. 5, 2001, pp. 365-372. doi:10.1093/glycob/11.5.365
- M. Musumeci M, J. Simpore, A. D’Agata, et al., “Oligosaccharides in Colostrum of Italian and Burkinabe Women,” Journal of Pediatric Gastroenterology and Nutrition, Vol. 43, No. 3, 2006, pp. 372-378. doi:10.1097/01.mpg.0000228125.70971.af
- S. Thurl, M. Munzert, J. Henker, et al., “Variation of Human Milk Oligosaccharides in Relation to Milk Groups and Lactational Periods,” British Journal of Nutrition, Vol. 104, No. 9, 2010, pp. 1-11.
- B. Wang, J. Brand-Miller, P. McVeagh, et al., “Concentration and Distribution of Sialic Acid in Human Milk and Infant Formulas,” The American Journal of Clinical Nutrition, Vol. 74, No. 4, 2001, pp. 510-515.
- J. B. Miller, S. Bull, J. Miller, et al., “The Oligosaccharide Composition of Human Milk: Temporal and Individual Variations in Monosaccharide Components,” Journal of Pediatric Gastroenterology and Nutrition, Vol. 19, No. 4, 1994. pp. 371-376. doi:10.1097/00005176-199411000-00001
- T. Nakano, M. Sugawara and H. Kawakami, “Sialic Acid in Human Milk: Composition and Functions,” Acta paediatrica Taiwanica, Vol. 42, No. 1, 2001, pp. 11-17.
- Y. Bao, L. Zhu and D. S. Newburg, “Simultaneous Quantification of Sialyloligosaccharides from Human Milk by Capillary Electrophoresis,” Analytical Biochemistry, Vol. 370, No. 2, 2007, pp. 206-214. doi:10.1016/j.ab.2007.07.004
- S. Martin-Sosa, M. J. Martin, L. A. Garcia-Pardo, et al., “Sialyloligosaccharides in Human and Bovine Milk and in Infant Formulas: Variations with the Progression of Lactation,” Journal of Dairy Science, Vol. 86, No. 1, 2003, pp. 52-59. doi:10.3168/jds.S0022-0302(03)73583-8
- J. J. Dickson and M. Messer, “Intestinal Neuraminidase Activity of Suckling Rats and Other Mammals. Relationship to the Sialic Acid Content of Milk,” Biochemical Journal, Vol. 170, No. 2, 1978, pp. 407-413.
- J. C. Brand-Miller, P. McVeagh, Y. McNeil, et al., “Digestion of Human Milk Oligosaccharides by Healthy Infants Evaluated by the Lactulose Hydrogen Breath Test,” Journal of Pediatrics, Vol. 133, No. 1, 1998. pp. 95-98. doi:10.1016/S0022-3476(98)70185-4
- C. S. Potten, “Epithelial Cell Growth and Differentiation. II. Intestinal Apoptosis,” American Journal of Physiology, Vol. 273, No. 2, 1997, pp. G253-257.
- S. M. Donovan, “Role of Human Milk Components in Gastrointestinal Development: Current Knowledge and Future Needs,” Journal of Pediatrics, Vol. 149, Suppl. 3, 2006, p. 49.
- A. T. Lopez-Navarro, M. A. Ortega, J. Peragon, et al., “Deprivation of Dietary Nucleotides Decreases Protein Synthesis in the Liver and Small Intestine in Rats,” Gastroenterology, Vol. 110, No. 6, 1996, pp. 1760-1769. doi:10.1053/gast.1996.v110.pm8964401
- R. Uauy, “Dietary Nucleotides and Requirements in Early Life: Text-Book of Gastroenterology and Nutrition in Infancy,” Raven Press Ltd., New York, 1989.
- U. Wenzel, S. Kuntz S, M. D. Brendel, et al., “Dietary Flavone is a Potent Apoptosis Inducer in Human Colon Carcinoma Cells,” Cancer Research, Vol. 60, No. 14, 2000, pp. 3823-3831.
- M. Y. Jou, A. F. Philipps, S. L. Kelleher, et al., “Effects of Zinc Exposure on Zinc Transporter Expression in Human Intestinal Cells of Varying Maturity,” Journal of Pediatric Gastroenterology and Nutrition, Vol. 50, No. 6, 2010, pp. 587-595. doi:10.1097/MPG.0b013e3181d98e85
- J. C. Chao and S. M. Donovan, “Effects of Insulin, Insulin-Like Growth Factors and Epidermal Growth Factor on Mitogenesis and Disaccharidase Activity in Rat (IEC-6) and Human (FHs 74 Int) Intestinal Cells,” The Chinese Journal of Physiology, Vol. 39, No. 4, 1996, pp. 253-263. doi:10.1146/annurev.nutr.20.1.311
- I. R. Sanderson and S. Naik, “Dietary Regulation of Intestinal Gene Expression,” Annual Review of Nutrition, Vol. 20, 2000, pp. 311-338.