American Journal of Plant Sciences
Vol.07 No.14(2016), Article ID:71303,18 pages
10.4236/ajps.2016.714183
Water-Deficit Response Is Not Affected by Glutathione Deficiency in Arabidopsis thaliana pad2-1 Plants
Tana Jubany-Marí, Seán Meehan, Marta López-Carbonell, Leonor Alegre*
Departament de Biologia Vegetal, Facultat de Biologia, Universitat de Barcelona, Barcelona, Spain

Copyright © 2016 by authors and Scientific Research Publishing Inc.
This work is licensed under the Creative Commons Attribution International License (CC BY 4.0).
http://creativecommons.org/licenses/by/4.0/


Received: September 16, 2016; Accepted: October 16, 2016; Published: October 19, 2016
ABSTRACT
Changes in glutathione and ascorbate content, hydrogen peroxide and abscisic acid were studied in developing leaves in wild-type (Col-0) and glutathione-deficient mutant pad2-1 lines of Arabidopsis thaliana over a time period of 9 days of drought followed by re-watering. Glutathione deficient mutant (pad2-1) presents mechanisms of acclimation to water stress through the reduction of plant biomass and increase in endogenous concentrations of ascorbate and glutathione. These acclimation responses to stress appeared along with the first symptoms of stress and we suggest here that they are regulated by ABA and H2O2. Normally, wild type plants under conditions of stress require an initial response phase in which a decrease in antioxidants is observed before reaching acclimation through the increase in levels of antioxidants. pad2-1 is more sensitive to stress and reacts to it; however, it did not suffer more oxidative stress than Col-0 plants, even though pad2-1 had higher levels of endogenous H2O2 relative to wild-type. In both water stressed Col-0 and pad2-1 plants increases in ABA were observed, however, more sharply in wild-type stressed plants. Low levels of glutathione together with high levels of H2O2 may regulate endogenous ABA concentrations and could be related to the slow growth rates which were observed during the experiment. The results highlighted the double function of glutathione as an antioxidant and signal molecule and also, the different response patterns of wild-type and pad2-1 when faced with drought stress. The results bring new insights to the responses of pad2-1 under conditions of water stress.
Keywords:
Abscisic Acid, Antioxidants, Growth, Hydrogen Peroxide, pad2-1, Water Stress

1. Introduction
Of the many environmental conditions which impact negatively on plants, drought is one of most detrimental to plant survival, and as such, plants have evolved several coping mechanisms. Water deficit in plants causes an increase in oxidative molecule concentration [1] and depending on both external parameters and endogenous plant factors such as the concentration of phytohormones, and the interplay between these, as well as the oxidative status of antioxidants [2] , cellular structures may be affected, thus causing oxidative stress. Oxidative metabolism is the product of the balance between pro-oxidant and antioxidant molecules in which glutathione, ascorbate and hydrogen peroxide are important players and to date have been extensively studied in plants.
While tripeptide thiol glutathione (g-glutamyl cysteinyl glycine; GSH) fulfils many important functions such as the storage and transport of cysteine, the maintenance of protein structure and function, and the regulation of enzyme activity through the oxidation/reduction of disulfide bonds and glutathionilation, antioxidant defense and redox signaling remain the primary function of this tripeptide [3] - [7] . Many studies have reported that total glutathione concentration as well as the ratio of it reduced to oxidized forms (GSH: GSSG) affects the cellular redox homeostasis during plant development and environmental stress [3] [8] [9] . In addition to the accepted antioxidant function of the glutathione form as an efficient scavenger of ROS by way of its cystenil thiol group, adjustments in glutathione status can be triggered by a variety of stresses [10] - [12] . A number of mutants with defects in the GSH1 genes have been identified in A. thaliana, including rax1-1, cad2-1 and pad2-1 [13] - [15] and the low level of glutathione present in these mutants is a useful tool in understanding the function of glutathione in plants. The pad2-1 mutation S298N of GLUTAMINE-CYSTEINE LIGASE (GCL), the first enzyme involved in the biosynthesis of glutathione results in lower glutathione content when compared with the wild type, approximately 20% of the wild type [16] . Furthermore, pad2-1 plants experience permanent oxidative stress [17] . Moreover, low GSH regulates the expression of a wide range of genes, particularly those that encode transcription factors and proteins involved in hormone dependent regulation of plant growth and development.
Environmental stresses, both biotic and abiotic promote the increased production of hydrogen peroxide (H2O2) and lead to its accumulation in plants [1] [18] [19] . H2O2 is at the same time both a harmful and useful cellular metabolite because it can react with many cellular components, but it is also a key component in the detoxification of other more reactive oxygen species. Furthermore, it is also an important signaling molecule that mediates responses to various stimuli in plant cells, including ABA [18] . Also, glutathione can react with H2O2, although this reaction is very slow. GSH is usually involved in H2O2 metabolism, reducing the dehydroascorbate that is generated following the (per) oxidation of ascorbate, and is mediated by ascorbate peroxidase (APX) [20] . The importance of glutathione in H2O2 metabolism and/or H2O2 signal transduction has been previously investigated [21] and several studies have been conducted with lines deficient in H2O2 metabolizing enzymes [22] - [25] . Findings from these suggest a close relationship between glutathione and H2O2 whose accumulations are regulated during pathogen attack and abiotic stress. However, the exact role of glutathione status in the regulation of H2O2 in glutathione deficient mutants subjected to water stress has not been clearly established and much remains to be elucidated on how glutathione affects H2O2. Moreover, low GSH has a negative impact on the hormonal pathways that regulate plant growth and development, and the depletion of GSH controls plant architecture under conditions of stress [26] . Low GSH concentrations leads to the decrease in the abundance of transcripts which encode core cell-cycle components and GSH deficiency negatively influences cell cycle progression.
The aim of the this work is to study and compare the responses of Arabidopsis plants, wild-type and pad2-1 lines (deficient in glutathione) to water stress followed by re-watering in order to better understand how a decrease in glutathione can effect plant responses to stress. For this purpose, the time course of leaf and soil water relations, plant biomass and variations in the concentration of antioxidants (ascorbate and glutathione), hydrogen peroxide and abscisic acid were monitored throughout the experiment in young developing plants. This work offers insights into the complexity of plant responses to water stress.
2. Material and Methods
2.1. Plant Material and Water Stress Treatment
Seeds of Arabidopsis thaliana Columbia (Col) ecotype wild-type (Col-0) and the glutathione deficient mutant (pad2-1) were grown. Seeds were surfaced sterilized in 70% ethanol and plated on MS agar medium under sterile conditions. These were then incubated for 4 days at 4˚C to ensure synchronized germination (cold stratification) whereupon they were transferred to a long-day growth chamber (16 h light/8 h darkness) at 21˚C and with a light intensity of 90 - 110 μmol photons m−2∙s−1.
At the stage of four true leaves the seedlings were transplanted to a substrate mixture of peat/perlite/vermiculite (1:1:1; v/v/v) and maintained in the same long-day growth chamber. After 2 weeks, the experiment began (day 0) by subjecting plants to two different watering regimes: 1) plants were watered to saturation with a diluted (1/10) Hoagland solution twice/three times a week throughout the experiment [well-watered (WW) plants] and 2) water was withheld from plants for 9 d [water stressed (WS) plants] and on day 9, re-watering of these plants was performed. These were then allowed to recover under the same conditions as WW plants. Sampling took place on days 0, 4, 7, 9, 10.
2.2. Water Status Measurement and Growth
The aerial part of the plants was used to carry out both biochemical measurements and to assess plant water status, measuring both relative water content (RWC) and Hydration (H). RWC was determined according to the following equation: RWC (%) = 100 × (FW − DW)/(TW − DW) and H (g H2O g−1 DW) where FW is the fresh weight, TW is the turgid weight after rehydrating the samples for 24 h at 4˚C in darkness and DW is the dry weight after oven-drying samples at 60˚C until constant weight. Biomass (g DW) was also determined. A minimum of 6 plants per sampling point and treatment were taken for measurements
2.3. Soil Water Content
Gravimetric soil water content (SWC) was directly determined using the difference in soil weight immediately after sampling (FW) and after oven drying (DW). The soil water content was adjusted daily using gravimetric measurements.
Relative water content was also determined for the soil (SWC): SWC (%) = 100 × (FW − DW)/(TW − DW), where FW is the fresh weight, TW is the turgid weight after rehydrating samples for 24 h at 4˚C in darkness and DW is the dry weight after oven- drying samples at 60˚C until constant weight.
2.4. H2O2 Determination
Extraction and quantitative analyses of H2O2 were done as described by [18] . Quantification of H2O2 in cleared and neutralized extracts was carried out using an Amplex red Hydrogen peroxide Assay kit (Molecular probes, Invitrogen Detection Technologies, Leiden, The Neterlands). Fluorescence was measured with a fluorescence microplate reader (Fluostar Optima, BMG Labtechnologies, Germany) equipped excitation at 520 nm and emission at 590 nm. The concentration of H2O2 in each sample was calculated using a standard curve obtained with known concentrations of pure H2O2 (molecular probes) diluted in 0.2 M HClO4.
2.5. Analyses of Ascorbate and Glutathione
For both ascorbate and glutathione determinations, 70 mg of leaves were ground in liquid nitrogen which was followed by the addition of 350 µl of cold extraction buffer (6% meta-Phosphoric acid; 2.5 mM EDTA) and placement in an ultrasonic bath (30 min) to increase penetration. The extract was then centrifuged for 10 min at 9500 g at 4˚C. The supernatant was re-centrifuged under the same conditions in order to remove any remaining pellet residue. The reduced forms of ascorbate and glutathione were determined using a 96-well quartz microplate (Hellma) and plate reader (BIO-RAD, × Mark) as described in [27] with some modifications. Levels of ascorbate (AA) (reduced) were determined using ascorbate oxidase (AO) as described in [28] . Glutathione was determined using the glutathione reductase (GR) recycling method [29] . The assay consisted of 5 mM EDTA, 0.6 mM DTNB [5,5’-dithiobis-(2-nitro-benzoic acid)], 0.2 mM NADPH and glutathione reductase (GR) dissolved in a buffer (pH 6.5). A standard curve was prepared from 0 to 7.5 µM GSH and the GSH concentration for the sample was extrapolated from this curve.
A minimum of three methodological replicas per sampling point and treatment were performed and for each methodological replica, a further three experimental replicas were carried out.
2.6. ABA Analysis
Concentrations of ABA were analyzed by HPLC MS/MS [30] . Briefly, 100 mg of leaves were ground in liquid nitrogen with a mortar and pestle and extracted with 750 µl of methanol-water-acetic acid (90:9:1 v/v/v). Deuterium-labeled internal standard (40 ng of ABA-d6) was added to each of the samples and replicas at the beginning of the extraction procedure. Extracts were vortexed for 5 min and incubated for 10 min at 4 ºC under ultrasonication (Vibra-Cell Ultrasonic Proccessor, Sonics & Materials Inc., Newton, CT, USA) and subsequently centrifuged for 10 min at 10,000 rpm. The supernatants were collected and the pellets were re-extracted with 750 µl of the extraction solvent. They were then pooled and filtered through a 0.22-µm polytetrafluoroethylene (PFTE) filter (Waters, Milford, MA, USA) and injected into the LC-MS/MS system.
Finally, 5 µl of each sample was injected into the LC system (Acquity UPLC, Waters) using a Waters X-Bridge C18 column (3.5 µm; 100 × 2.1 i.d). Quantification was carried out using MS/MS on an API 3000TM triple quadrupole mass spectrometer (AB Sciex, DanaberCrp, Washington DC). Multiple reaction monitoring (RMN) acquisition was performed by monitoring the 263/153.
2.7. Statistical Analysis
Statistical differences between treatments were analyzed by the Statistical Package for Social Sciences (SPSS for Windows version 16.0; SPSS Inc., Chicago, USA) using the Duncan multiple range test. Significance levels of 95% (p < 0.05) are indicated in figure legends. At sampling time, significantly different means are indicated with different letters.
3. Results
3.1. Water Relations and Plant Growth
Here, we compare the behavior of Col-0 (wild type) and mutant (deficient in glutathione) pad2-1 Arabidopsis thaliana plants under conditions of water deficit. While no significant differences between Col-0 and pad2-1 plants were observed in terms of water relations when subjected to water stress, they did show differences in terms of growth and the time course of the production of the antioxidants: ascorbate, glutathione, H2O2 and ABA.
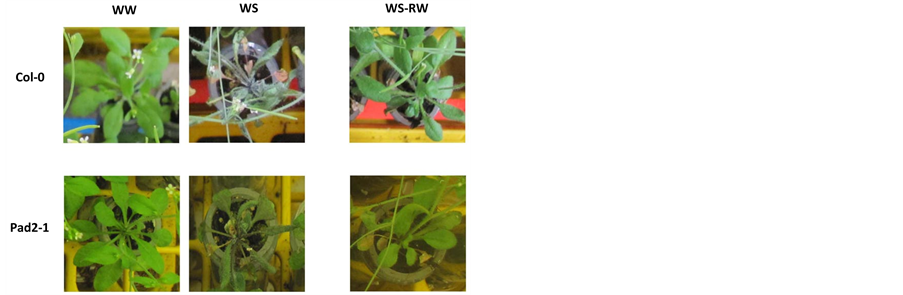
Soil moisture, expressed as RWCs (%), was maintained in WW plants between 87.7% and 93.6% in both experiments (Figure 1), where this was considered as well-watered. WW plant populations in both wild type and GSH-deficient plants maintained a RWC (%) and H (g H2O・g−1 DW) above 76.1% and 11.5 g H2O・g−1 DW respectively, demonstrating that they were well hydrated (Figure 2(a), WW). It was also observed that the growth rates of Col-0 and pad2-1, measured as DW (g DW), were significantly different. pad2-1 maximum weight (8.6 × 10⁻³ g DW) was reached on day 7 of the experiment and remained at similar levels until the end. In the case of WW Col-0 plants, this same DW value had already been overtaken by day 4 of experiment (9.6 × 10⁻³ g DW) and by day 7 of the experiment, it was almost 1.6- fold that of pad2-1. Furthermore, it continued to increase eventually reaching 20.4 g DW, 2.4-fold the DW of pad2-1 plants of the same age and treatment. This was reflected in the growth slope (Figure 2(c)), where the WW Col-0 growth slope was 2.76-fold that of pad2-1 WW plants.


Figure 1. Soil and leaf water relations and growth in Col-0 and pad2-1 Arabidopsis thaliana plants. WW (●) and WS (○). Soil relative water content (soil RWC, %), leaf relative water content (leaf RWC, %), hydration (H, g H2O g−1 DW) and growth (g DW). For the experiments whole rosettes were collected. Values followed by the same letter in the same column are not significantly different at P < 0.05 according to Duncan multiple range test, Data are the means ± SE, n = 6.
However, no significant decrease in RWC in WS plants was observed until the last day of water with-hold when plants began showing clear symptoms of wilting (Figure 2(a)), H, and especially growth were reflected in the decrease in soil RWC (Figure 1). However, in terms of the responses of Col-0 and pad2-1 WS plants, the same patterns
 (a)
(a) (b)
(b)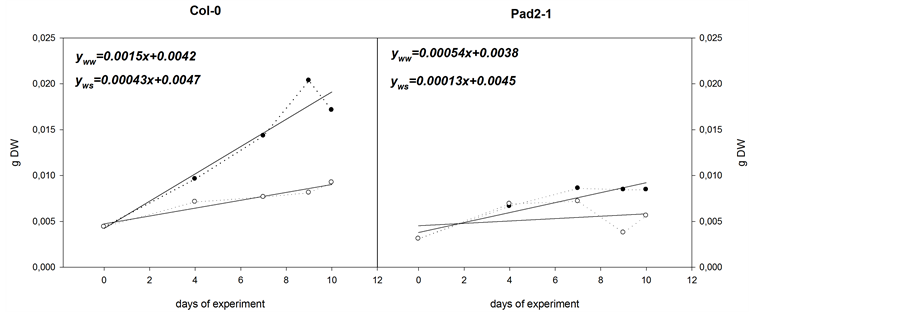 (c)
(c)
Figure 2. Growth and H2O2 in Col-0 and pad2-1 Arabidopsis thaliana plants. WW and WS plants at the end of the water deficit period, and after re-watering (a); Mean of all data obtained for H2O2 determination (n = 30) in Col-0 (■) and pad2-1 (□) plants (b); Growth slope in, WW and WS, Col-0 and Pad-2 plants (c).
did not hold. By day 4 of the experiment, soil RWC was 38.6% in Col-0 WS plants and 31.5% in pad2-1 WS plants. At this point, both H and DW of WS Col-0 plants were slightly lower than that of WW plants (13.3 vs. 11.7 g H2O・g−1 DW and 9.6・10−3 vs. 7.2 × 10⁻³ g DW respectively), but at the same time, in the case of pad2-1 no differences between WW and WS plants were observed. These differences in the growth patterns between Col-0 and pad2-1 were more obvious by day 7 of the experiment, by which time soil RWC had decreased to 17.1% and 13.9% in Col-0 and pad2-1 WS plants respectively. Moreover, there were significant differences in H between watering regimes in both wild type and GSH deficient populations. While leaf RWC was still greater than 70% in both pad2-1 and Col-0 WS plants, and statistically the same as the values for the same point in WW plants, H had reached values of 10.4 and 8.6 g H2O・g−1 DW in Col-0 and pad2-1 WS plants respectively. These were both significantly lower than their equivalent in WW treatment. In turn, in pad2-1 WS plants, H was significantly lower than in Col-0 WS plants. At this point DW of WW Col-0 plants was 1.9-fold DW of WS Col-0 plants, 1.69-fold DW of WW pad2-1 plants and 1.98- fold DW of WS pad2-1 plants.
By day 9 at the end of the water deficit period, the same pattern for both growth and H was even more evident, however, in addition, RWC of WS plants in both Col-0 and pad2-1 were finally significantly lower than RWC of the wild type WW plants, 53.3% and 54.4% respectively. At this stage plants showed clear symptoms of wilting (Figure 2(a), WS) and H values of WW plants were approximately 2-fold higher than those of WS plants in both Col-0 and pad2-1 populations. Similarly, growth parameter values of WW Col-0 plants were around 2-fold those of WS Col-0 plants and WW pad2-1 plants, and 5.2-fold the DW of pad2-1 WS plants.
Differences in growth between Col-0 and pad2-1 for both WW and WS treatments, are also explained by the GSH deficiency in pad2-1 plants (Figure 1 and Figure 2(c)). However, that said, water deficiency had also clearly influenced the growth slope as is demonstrated in the difference between the growth slopes of WS and WW Col-0 plants (Figure 2(c)) as well as the differences in the growth slopes of WS and WW pad2-1 plants (Figure 2(c)). The growth slope in WW Col-0 plants was 0.0015, 2.7-fold that of pad2-1 WW plants (0.00043), and 11.6-fold that of WS pad2-1 plants (0.00013). On the other hand, the growth slope of WW Col-0 plants was 3.4-fold that of WS Col-0 plants, and, similarly, the growth slope of WW pad2-1 plants was 4.2-fold that of WS pad2-1 plants. Thus, growth was clearly influenced by both GSH and water deficiency.
After sampling on day 9 of the experiment, plants were re-watered, and 24 h later on day 10 they had almost returned to pre-stress values with the exception of growth, a parameter which needs more time to recover.
3.2. Oxidative Parameters and ABA
Glutathione results confirmed that pad2-1 mutants had indeed a deficiency of GSH, where the maximum values for GSH in pad2-1 mutants were 56.0% those of the Col-0 GSH maximum. Moreover, the time course of GSH values followed very different patterns in both Col-0 and pad2-1. In WW Col-0 plants, GSH gradually decreased from 1.3 µmol∙g−1 DW to 0.8 µmol∙g−1 DW, with a slight but not significant increase on day 4 of the experiment. WS Col-0 GSH showed a slight increase on day 9 of water with-hold and also upon re-watering. On the other hand, pad2-1 followed the complete opposite pattern: where from the very beginning an increase in GSH was observed, with a gradual rise from 0.4 to 0.7 µmol∙g−1 DW in WW plants. In WS plants the pattern was very similar, but at the end of the water deficit period and upon recovery GSH decreased significantly.
Glutathione deficiency in pad2-1 plants would clearly influence leaf H2O2 concentrations, which overall were 66.4% higher in pad2-1 plants than in Col-0 plants (Figure 2(b)).
The parameter that was most noticeably influenced by water deficit in both Col-0 and pad2-1 plants was leaf AA concentration. At the end of the water deficit period when plants began showing symptoms of stress, both WS treatments experienced a peak of 31.4 and 40.5 µmol∙g−1 DW respectively (Figure 2(a)) having being subject to 9 days of water deficit (53% leaf RWC and 7.3 g H2O g−1 DW). When re-watered (above 85% soil RWC), values returned to pre-water-deficit levels. Overall, peak AA was statistically higher in pad2-1 plants (40.5 vs. 31.4 µmol∙g−1 DW). With respect to differences between WW and WS treatments in both WS Col-0 and pad2-1 plants, there was a significant peak in AA at the end of water deficit period (31.4 and 40.47 µmol∙g−1 DW respectively). At this point, RWC had decreased in both Col-0 and pad2-1 to 13.4% and 11.7% respectively. These returned to pre-stress values when plants were re-watered. Although in terms of changes to AA both populations followed the same pattern, in WS pad2-1 plants AA peaked on day 9 of water deficit.
In contrast, ABA values in both Col-0 and pad2-1 plants followed a different pattern (Figure 3). Overall, ABA values in Col-0 plants were 46.10% higher than in pad2-1 plants. A more accurate analysis showed that ABA in WW Col-0 and pad2-1 plants remained stable, although they were significantly lower in pad2-1 when compared to Col-0 plants, ranging from 0.7 to 1.2 nmol∙g−1 DW and 0.2 to 0.5 nmol∙g−1 DW respectively. Furthermore, over the time course of the experiment, ABA increased in WS plants as was expected. However, in Col-0 plants it increased sharply and stayed at elevated levels on days 7 and 9 of the experiment whereas in pad2-1 plants the increase was more gradual. The peak on day 7 in WS Col-0 plants was 5.6-fold initial values of ABA and was concomitant with the initial decrease in H and the significant arrest in growth of WS plants. On day 9, ABA decreased slightly but was still 3.3 fold higher than initial values. Once WS Col-0 plants were re-watered, ABA returned to pre-stressed levels.
ABA in pad2-1 had increased 2.5-fold by day 4 of water deficit (soil RWC had also decreased to 31.5%, and GSH had increased from 0.4 to 0.7 µmol∙g DW−1). This remained the same through to day 7 of experiment and on day 9, concomitant with a significant decrease in soil RWC (11.7%), leaf RWC (54.4%) and H (6.1 gH2O∙g DW−1), ABA peaked at 1.9 nmol∙g DW−1, 3.6-fold the initial ABA value. On day 10 after plants had been re-watered; ABA values also decreased but not to initial values and still held at 2-fold initial leaf ABA concentrations.

Figure 3. GSH, AA and ABA in Col-0 and pad2-1 Arabidopsis thaliana plants. WW (●) and WS (○). Endogenous GSH content (µmol∙g−1 DW). Endogenous AA content (µmol∙g−1 DW). Endogenous ABA content (nmol∙g−1 DW). For the experiments whole rosettes were collected. Values followed by the same letter in the same column are not significantly different at P < 0.05 according to Duncan multiple range test, Data are the means ± SE, n = 6.
4. Discussion
Here, we report a comparative study of the effects of progressive water stress and recovery, coupled with simultaneous measurements of plant biomass, ascorbate and glutathione, hydrogen peroxide and abscisic acid content in glutathione deficient (pad2-1) and wild-type Arabidopsis plants in order to examine the relevance of glutathione in plant responses to stress. In a previous study [31] we had investigated the effects of water stress and recovery in ascorbate deficient (vtc-2) and wild-type Arabidopsis plants. Since that earlier work showed significant changes in ascorbate with the onset of water stress, and also because ascorbate and glutathione are so intimately coupled with the control of plant redox status, we wanted to further explore a presumed association of glutathione with water stress. This prompted us to examine glutathione behavior in a glutathione deficient mutant (pad2-1) subjected to water stress. This report is therefore the first to investigate the interaction between antioxidants, abscisic acid and hydrogen peroxide in mutants deficient in glutathione subjected to progressive water stress, followed by recovery. Finally, we considered how these findings may shed light on the processes by which plants respond to stress and show that the arrest of growth together with an increase in antioxidants in a glutathione deficient mutant (pad2-1) is a mechanism of acclimation to water stress in these plants.
4.1. Glutathione Deficiency and Water Stress Affects Plant Biomass Regulating Plant Responses to Drought
There were no significant differences in the time course of water relations in either the soil nor in wild-type and pad2-1 plants. However, the fact that the biomass of WW pad2-1 was significantly lower, from day 4 and until the end of the experiment, compared with the biomass of WW Col-0 plants highlights the role of glutathione in plant growth under non-stressed conditions.
With respect to glutathione and the regulation of plant development, it has been shown that GSH is required for the development of the shoot apical meristem [3] [32] [33] and furthermore, GSH is required for cell proliferation and is recruited into the cell nucleus early on in the cell cycle [34] [35] . However, to date, no detailed characterization of the role played by GSH in shoot development has been reported. The effects of glutathione depletion in root architecture has been studied primarily in rml-1 lines, a mutant deficient in glutathione as well as in pad2-1 and cad2-1 (also glutathione deficient) [34] [36] [37] and, it has been shown that GSH depletion provokes a decrease in the expression of PINs which in turn limits auxin transport and therefore, causes the arrest of the cell cycle in roots. Thus, it cannot be discarded that the depletion of GSH could influence the rosette development of pad2-1 by also regulating auxin transport.
Water stress usually induces a reduction in biomass which can be beneficial for plant acclimation to water stress by limiting plant surface evaporation [38] and water absorption. It is a very fast and actively regulated response that affects leaf growth throughout the entire course of development doing so through the interplay of both reduced cell division and expansion. Furthermore, different mutants respond differently to mild drought stress [39] [40] . Our results showed that water stress produces a reduction in biomass which is significantly different from what happened in WW plants: wild type biomass on day 4 was the same as on day 9 for the pad2-1 line. At the beginning of water with-hold, biomass for pad2-1 was identical in WW and WS plants. This suggests that a reduction in glutathione in the pad2-1 mutant did not impair the ability of this line to respond to mild water stress, at least up until 7 day, following the same growth rate as WW plants. However, by day 9 with more severe water stress conditions, biomass for the WS pad2-1 line was 23.8% lower than in pad2-1 WW plants and remained low even after 1 day of re-watering.
4.2. Depletion in Glutathione Does Not Impair Plant Responses to Mild Water Stress in pad2-1 Mutant: Reponses Mediated by Antioxidants and Abscisic Acid
In general, acclimation responses to stress are related to an increase in endogenous glutathione concentrations [41] [42] . Our results showed that the time course of GSH values followed very different patterns in Col-0 and pad2-1. Glutathione increased progressively until day 8 in pad2-1 mutants subjected to water stress, whereas in WS wild-type plants, GSH decreased gradually with a slight but not significant increase on day 8 of water with-hold and also at re-watering. To some degree the same pattern was observed for ascorbate which showed a slight but not significant decrease in AA in wild-type stressed plants and a peak in AA was only observed after 9 days of stress. On the other hand, AA began to increase in the WS pad2-1 line after 4 days of water with- hold and continued increasing progressively with a peak on day 9 of stress, eventually reaching values 1.28-fold higher than those in Col-0 plants. This suggests that wild type plants need a period of stress before acclimation, whereas pad2-1 plants showed acclimation responses early on at the beginning of the application of a stress. This would indicate that they are more sensitive to drought stress than Col-0. The increase in glutathione content, already observed after 4 days of water with-hold in the pad2-1 mutant could be related to a decrease in soil RWC when this stress had still not been detected in leaves. These results suggest that roots sense the decrease in soil water content and send a signal, possibly ABA [43] to leaves at a stage before drought stress is detected there [44] . However, in this study the increase in AA was observed at the same time as the decrease in RWC in leaves.
Considering that glutathione synthesis is inhibited in this mutant [16] , it remains unclear how the pad2-1 mutant was able to accumulate a higher glutathione content under water stress [45] . In summary, the results of measurements of glutathione and ascorbate indicate that pad2-1 plants respond to water stress by increasing the synthesis of glutathione and ascorbate which improve plant resistance to stress. The results highlight the importance of these antioxidants in plant responses to stress.
It is well documented that ABA is involved in plant responses to water stress [39] [46] [47] . It has a plethora of functions and in terms of sulfate assimilation and glutathione biosynthesis it has been shown that maize plants treated with ABA accumulate GSH [48] [49] , however, it is unclear how ABA regulates glutathione accumulation. Furthermore, many of the transcription factor mRNAs that were modified as a result of GSH depletion are known to be responsive to phytohormone signaling. Of the hormone encoding transcripts associated with proteins and the transcription factors that were changed in abundance in rm1-1 relative to wild type, more than 50% are classified either as responsive to abscisic acid or auxin/auxin related pathways [37] . Again, the pattern of ABA accumulation differs between pad2-1 and Col-0 where ABA concentration is higher in Col-0 than in pad2-1 in WW as well in WS plants. This would suggest an interaction between glutathione and endogenous ABA concentration. However, our results also showed that the pad2-1 line responds to water stress by increasing the levels of ABA, although the increase in ABA is lower than in Col-0 plants.
4.3. Depletion of Glutathione in pad2-1 Line Influences Leaf Endogenous H2O2 Concentration
Pad2-1 plants showed a significant increase (66% higher) in H2O2 with respect to wild-type. The accumulation of H2O2 observed in our study indicates that the ascorbate-glutathione cycle was not able to detoxify H2O2 [41] in the pad2-1 line because of the depletion of glutathione.
The relationship between glutathione and H2O2 has been documented [17] [21] [50] [51] and it is accepted in most of these studies working with cat2 and cad2 double mutants that H2O2 triggers glutathione accumulation. However, according to [52] in the pad2-1 mutant, in the case of the mutation in the single gene which encodes for the first committed enzyme of glutathione synthesis that produces a constitutive decrease in glutathione, the function of H2O2 in triggering up-regulation of glutathione is blocked. Thus, the low levels of glutathione in pad2-1 could explain the accumulation of H2O2 without incurring an increase in glutathione levels. H2O2 was initially recognized as a toxic reactive oxygen species, capable of causing damage to a variety of cellular structures. However, it has been demonstrated that H2O2 can also act as a signaling molecule, involved in a plethora of physiological functions [50] and can induce abiotic oxidative stress tolerance in plants. Our results showed that the H2O2 increase in pad2-1 mutants with respect to Col-0 plants is as a result of a lack of glutathione thus, it could be indicative of the depletion of this antioxidant and could be considered as a marker of oxidative stress. Nevertheless, this does not discard the role of H2O2 as signal molecule, which is involved in many physiological processes in plants such as adaption responses or the acclimation process in pad2-1 plants.
4.4. Glutathione as an Antioxidant and Signaling Molecule
Glutathione is a multifunctional molecule with diverse functions acting as an antioxidant and signaling molecule. But while its role as an antioxidant is well known, its role as a signaling molecule is not yet well understood [50] . Our study of GSH as an antioxidant is in part demonstrated since a higher accumulation of H2O2 in the WS glutathione deficient mutant (pad2-1) when compared to WS wild-type was observed and also because an increase in GSH in WS pad2-1 protects plants from conditions of stress. However, glutathione can also play a role as a signaling molecule downstream modifying the levels of H2O2 and ABA during growth development and stress responses. H2O2 communicates with a variety of other signaling molecules and plant hormones and together they form an intricate network that regulates and protects plants against biotic and abiotic stresses [26] [38] [52] . H2O2 induces a decrease in growth, and ABA, the stress hormone, can both directly inhibit growth and indirectly stimulate growth by reducing ethylene biosynthesis. H2O2 in signal transduction networks in plants is essential for both the communication with external biotic and abiotic stimuli and the control of developmentally regulated processes. In addition, H2O2 complements this process by synergizing and antagonizing many cellular regulatory circuits through the active interaction with other signals and plant hormones during growth and development band stress responses. We suggest that the interaction between H2O2 and ABA in parallel with the depletion of glutathione can regulate the rosette growth in the pad2-1 line, although more studies are needed on this subject.
5. Conclusion
The results of time course measurements of glutathione and ascorbic in parallel with biomass, soil and plant water relations, ABA as well as H2O2 concentrations bring new insights into the responses of pad2-1 to water stress. The glutathione deficient mutant (pad2-1) presents mechanisms of acclimation to water stress by reducing plant biomass and increasing the endogenous concentrations of ascorbate and glutathione. These acclimation responses to stress appeared at the first to be symptoms of stress and we suggest that they are regulated by ABA and H2O2. Indeed, wild type plants need an initial response phase before reaching acclimation in which time a decrease in antioxidants is observed. Therefore, we can conclude that the accumulation of antioxidants in the pad2-1 mutant under conditions of water stress seems to be an important mechanism for the survival of plants with low glutathione content, thus indicating that the pad2-1 did not suffer more oxidative stress than wild-type plants.
Acknowledgements
We thank the Serveis de Camps Experimentals (Facultat de Biologia, Universitat de Barcelona) for technical assistance. This work was supported by grant BFU2012-39527 from the Spanish Government.
Cite this paper
Jubany-Marí, T., Meehan, S., López-Carbonell, M. and Alegre, L. (2016) Water-Deficit Response Is Not Affected by Glutathione Deficiency in Arabidopsis thaliana Pad2-1 Plants. American Journal of Plant Sciences, 7, 2020-2037. http://dx.doi.org/10.4236/ajps.2016.714183
References
- 1. Apel, K. and Hirt, H. (2004) Reactive Oxygen Species: Metabolism, Oxidative Stress, and Signal Transduction. Annual Review of Plant Biology, 55, 373-379.
http://dx.doi.org/10.1146/annurev.arplant.55.031903.141701 - 2. Brossa, R., López-Carbonell, M., Jubany-Marí, T. and Alegre, L. (2011) Interplay between Abscisic Acid and Jasmonic Acid and Its Role in Water-Oxidative Stress in Wild-Type, ABA Deficient, JA-Deficient, and Ascorbate Deficient Arabidopsis Plants. Journal of Plant Regulation, 30, 322-333.
http://dx.doi.org/10.1007/s00344-011-9194-z - 3. Foyer, C.H. and Noctor, G. (2011) Ascorbate and Glutathione: The Hearth of the Redox Hub. Plant Physiology, 155, 2-18.
http://dx.doi.org/10.1104/pp.110.167569 - 4. Noctor, G. (2006) Metabolic Signaling in Defence and Stress. The Central Roles of Soluble Redox Couples. Plant Cell and Environment, 29, 409-425.
http://dx.doi.org/10.1111/j.1365-3040.2005.01476.x - 5. Noctor, G., Mhamdi, A., Chaouch, S., Han, Y., Neukerman, J., Marquez-Garcia, B., et al. (2012) Glutathione Functions in Plants: An Integrated Overwiew. Plant Cell and Environment, 35, 454-484.
http://dx.doi.org/10.1111/j.1365-3040.2011.02400.x - 6. Noctor, G., Mhamdi, A., Queval, G. and Foyer, C.H. (2013) Regulating the Redox Gatekeeper: Vacuolar Sequestration Puts Glutathione Disulfide in Its Place. Plant Physiology, 163, 665-671.
http://dx.doi.org/10.1104/pp.113.223545 - 7. Potters, G., De Gara, L., Asard, H. and Horemans, N. (2002) Ascorbate and Glutathione Guardians of the Cell Cycle, Partners in Crime? Plant Physiol.ogy and Biochemistry, 40, 537-548.
http://dx.doi.org/10.1016/S0981-9428(02)01414-6 - 8. May, M.J., Vernoux, T., Leaver, C., Van Montagu, M. and Inzé, D. (1998) Glutathione Homeostasis in Plants: Implications for environmental Sensing and Plant Development. Journal of Experimental Botany, 49, 649-667.
- 9. Mullineaux, P.M. and Raush, T. (2005) Glutathione, Photosynthesis and the Redox Regulation of Stress-Responsive Gene Expression. Photosyntesis Research, 86, 459-474.
http://dx.doi.org/10.1007/s11120-005-8811-8 - 10. Bick, J.A., Setterdahl, A.T., Knaff, D.B., Chen. Y., Pitcher, L.H., Zilinkas, B., et al. (2001) Regulation of the Plant-Type 5’-Adenylyl Sulfate Reductase by Oxidative Stress. Biochemistry, 40, 9040-9048.
http://dx.doi.org/10.1021/bi010518v - 11. Gomez, L., Vanacker, H., Buchner, P., Noctor, G. and Foyer, C.H. (2004) The Intercellular Distribution of Glutathione Synthesis and Its Response to Chilling in Maize. Plant Physiology, 134, 1662-1671.
http://dx.doi.org/10.1104/pp.103.033027 - 12. Holler, K., Kiraly, L., Künstler, A., Müller, M., Gullner, G., Fatinger, M., et al. (2010) Enhanced Glutathione Metabolism Is Correlated with Sulfur-Induced Resistance in Tobaco Mosaic Virus-Infected Genetically Susceptible Nicotiana tabacum Plants. Molecular Plant-Microbe Interactions, 23, 1448-1459.
http://dx.doi.org/10.1094/MPMI-05-10-0117 - 13. Ball, L., Accotto, G.P., Bechtold, U., Creissen, G., Funck, D., Jimenez, A., et al. (2004) Evidence for a Direct Link between Glutathione Biosynthesis and Stress Defense Gene Expression in Arabidopsis. Plant Cell, 16, 2448-2462.
http://dx.doi.org/10.1105/tpc.104.022608 - 14. Cobbett, C.S., May, M.J., Howden, R. and Rolls, B. (1998) The Glutathione-Deficient Cadmium-Sensitive Mutant cad2-1, of Arabidopsis thaliana Is Deficient in Gamma-Glutamylcysteine Synthase. Plant Journal, 16, 73-78.
http://dx.doi.org/10.1046/j.1365-313x.1998.00262.x - 15. Howden, R., Andersen, C.R., Goldsbrough, P.B. and Cobbett, C.S. (1995) A Cadmium-Sensitive, Glutathione-Deficient Mutant of Arabidopsis thaliana. Plant Physiology, 107, 1067-1073.
http://dx.doi.org/10.1104/pp.107.4.1067 - 16. Parisy, V., Poinssot, B., Owsianowki, A., Glazebrook, J. and Mauch, F. (2006) Identification of pad2 as a γ-Glutamylcisteine Synthatase Highlights the Importance og Gluatahione Disease Resistance of Arabidopsis. The Plant Journal, 49, 159-172.
http://dx.doi.org/10.1111/j.1365-313X.2006.02938.x - 17. Dubreuil-Maurizi, C., Vitecek, J., Marty, L., Branciard, L., Frettinger, P., Wendehenne, D., et al. (2011) Glutathione Deficiency od the Arabidopsis Mutant pad2-1 Affects Oxidative Stress-Related Events, Defense Gene Expression and the Hypersensitive Response. Plant Physiology, 157, 2000-2012.
http://dx.doi.org/10.1104/pp.111.182667 - 18. Jubany-Marí, T., Munné-Bosch, S., López-Carbonell, M. and Alegre, L. (2009) Hydrogen Peroxide Is Involved in the Acclimation of the Mediterranean Shrub Cistus albidus L., to Summer Drought. Journal of Experimental Botany, 60, 107-120.
http://dx.doi.org/10.1093/jxb/ern274 - 19. Jubany-Marí, T., Prinsen, E., Munné-Bosch, S. and Alegre, L. (2010) The Timing of Methyl Jasmonate, Hydrogen Peroxide and Ascorbate Accumulation during Water Deficit and Subsequent Recovery in the Mediterranean Shrub Cistus albidus L. Environmental and Experimental Botany, 69, 47-55.
http://dx.doi.org/10.1016/j.envexpbot.2010.02.003 - 20. Asada, K. (1999) The Water-Water Cycle in Chloroplasts: Scavenging of Active Oxygens and Dissipation of Excess Photons. Annual Review of Plant Physiology and Molecular Biology, 50, 601-639.
http://dx.doi.org/10.1146/annurev.arplant.50.1.601 - 21. Mhamdi, A., Hager, J., Chaoux, S., Queval, G., Han, Y., Taconnat, L., Saindrenan, P., et al. (2010) Arabidopsis GLUTATHIONE REDUCTASE1 Plays a Crucial Role in Leaf Responses to Intracellular Hydrogen Peroxide and in Ensuring Appropriate Gene Expression Signaling Pathways. Plant Physiology, 153, 1144-1160.
http://dx.doi.org/10.1104/pp.110.153767 - 22. Queval, G., Issakidis-Bourguet, E., Hoeberischts, F.A., Vandorpe, M., Gakière, B., Vanaker, H., et al. (2007) Conditional Oxidative Stress Responses in the Arabidopsis Photorespiratory Mutant cat2 Demonstrate That Redox Status Is a Key Modulator of Day-Length-Dependent Gene Expression and Define Photoperiod as a Crucial Factor in the Regulation of H2O2 Induced Cell Death. The Plant Journal, 52, 640-657.
http://dx.doi.org/10.1111/j.1365-313X.2007.03263.x - 23. Queval, G., Thominet, D., Vanacker, H., Miginiac-Maslow, M., Gakière, B. and Noctor, G. (2009) H2O2-Activated Up-Regulation of Glutathione in Arabidopsis Involves Induction of Genes Encoding Enzymes Involved in Cysteine Synthesis in the Chloroplasts. Molecular Plant, 2, 344-356.
http://dx.doi.org/10.1093/mp/ssp002 - 24. Smith, I.K., Kendall, A.C., Keys, A.J., Turner, J.C. and Lea, P.J. (1984) Increased Levels of Glutathione in Catalase-Deficient Mutant of Barley (Hordeum vulgare L.). Plant Science Letters, 37, 29-33.
http://dx.doi.org/10.1016/0304-4211(84)90198-6 - 25. Willekens, H., Chamnongpol, S., Davey, M., Schraudner, M., Langebartels, C., Van Montagu, M., et al. (1997) Catalase Is a Sink for H2O2 and Is Indispensable for Stress Defense in C3 Plants. The EMBO Journal, 16, 4806-4816.
http://dx.doi.org/10.1093/emboj/16.16.4806 - 26. Tognetti, V.B., Van Aken, O., Morreel, K., Vandnbroucke, K., Van de Cotte, B., De Clercq I., et al. (2010) Perturbation of Indole-3-Butyric Acid Homeostasis by the UDP-Glucosyltrasferase UGT74E2 Modulates Arabidopsis Architecture and Water Stress Tolerance. The Plant Cell, 22, 2660-2679.
http://dx.doi.org/10.1105/tpc.109.071316 - 27. Queval, G. and Noctor, G. (2007) A Plate Reader Method for the Measurement of NAD, NADP, Glutathione, and Ascorbate in the Tissue Extracts: Application to Redox Profiling during Arabidopsis Rosette Development. Analytical Biochemistry, 363, 58-69.
http://dx.doi.org/10.1016/j.ab.2007.01.005 - 28. Foyer, C., Rowell, J. and Walker, D. (1983) Measurement of the Ascorbate Content of Spinach Leaf Protoplasts during Illumination. Planta, 157, 239-244.
http://dx.doi.org/10.1007/BF00405188 - 29. Tietze, F. (1969) Enzymic Method for Quantitative Determination of Nanogram Amounts of Total and Oxidized Glutathione Applications to Mammalian Blood and Other Tissues. Analytical Biochemistry, 27, 502-522.
http://dx.doi.org/10.1016/0003-2697(69)90064-5 - 30. López-Carbonell, M., Gabassa, M. and Jáuregui, O. (2009) Enhanced Determination of Abscisic Acid (ABA) and Abscisic Acid Glucose Ester (ABA-GE) in Cistus albidus Plants by Liquid Chromatography Mass Spectrometry in Tandem Mode. Plant Physiology and Biochemistry, 47, 256-261.
http://dx.doi.org/10.1016/j.plaphy.2008.12.016 - 31. Brossa, R., Pintó-Marijuan, M., Jiang, K., Alegre, L. and Feldman, L. (2013) Assessing the Regulation of Leaf Redox Status under Water Stress Conditions in Arabidopsis thaliana. Plant Signaling & Behavior, 8, e24781.
http://dx.doi.org/10.4161/psb.24781 - 32. Reicheld, J.P., Khafif, M., Riondet, C., Droux, M., Bonnard, G. and Meyer, Y. (2007) Inactivation of Thioredoxin Reductases Reveals a Complex Interplay between Thioredoxin and Glutathione Pathways in Arabidopsis Development. The Plant Cell, 19, 1851-1865.
http://dx.doi.org/10.1105/tpc.107.050849 - 33. Vernoux, T., Wilson, R.C., Seeley, K.A., Reicheld, J.P., Murot, S., Brown, S., et al. (2000) The ROOMERISTEMLESS1/CADMIUM SENSITIVE2 Gene Defines a Glutathione-Dependent Pathway Involved in Initiation and Maintenance of Cell Division during Postembryonic Root Development. The Plant Cell, 12, 97-110.
- 34. Koprivova, A., Mugford, S.T. and Kopriva, S. (2010) Arabidopsis Root Growth Dependence on Glutathione Is Linked to Auxin Transport. Plant Cell Reports, 29, 1157-1167.
http://dx.doi.org/10.1007/s00299-010-0902-0 - 35. García-Giménez, J.L., Markovic, J., Dasí, F., Queval, G., Schanaubelt, D., Foyer, C.H., et al. (2013) Nuclear Glutathione. Biochimica et Biophysica Acta (BBA)-General Subjects, 1830, 3304-3316.
http://dx.doi.org/10.1016/j.bbagen.2012.10.005 - 36. Bashandy, T., Guilleminot, J., Vernoux, T., Caparros-Ruiz, D., Ljung, K., Meyer, T., et al. (2010) Interplay between the NADP-Linked Thioredoxin and Glutathione Systems in Arabidopsis Auxin Signaling. The Plant Cell, 22, 376-391.
http://dx.doi.org/10.1105/tpc.109.071225 - 37. Schnaubelt, D., Queval, G., Dong, Y., Diaz-Vivancos, P., Makgopa, M.E., Howell, G., et al. (2015) Low Glutathione Regulates Gene Expression and the Redox Potentials of the Nucleus and Cytosol in Arabidopsis thaliana. Plant, Cell & Environment, 38, 266-279.
http://dx.doi.org/10.1111/pce.12252 - 38. Claeys, H. and Inzé, D. (2013) The Agony of Choice: How Plants Balance Growth and Survival under Water-Limiting Conditions. Plant Physiology, 162, 1768-1779.
http://dx.doi.org/10.1104/pp.113.220921 - 39. Clauw, P., Coppens, F., De Beuf, K., Dhondt, S., Van Daele, T., Maleux, K., et al. (2015) Leaf Responses to Mild Drought Stress in Natural Variants of Arabidopsis. Plant Physiology, 167, 800-816.
http://dx.doi.org/10.1104/pp.114.254284 - 40. Tardieu, F., Parent, B. and Simonneau, T. (2010) Control of Leaf Growth by Abscisic Acid Hydraulic or Non-Hydraulic Processes? Plant, Cell & Environment, 33, 636-647.
http://dx.doi.org/10.1111/j.1365-3040.2009.02091.x - 41. Heyneke, E., Lushi-Ebengreuth, N., Krajcer, V., Müller, M. and Zechmann, B. (2013) Dynamic Compartment Specific Changes in Glutathione and Ascorbate Levels in Arabidopsis Plants Exposed to Different Light Intensities. BMC Plant Biology, 13, 104.
http://dx.doi.org/10.1186/1471-2229-13-104 - 42. Tausz, M., Sircelj, H. and Grill, D. (2004) The Glutathione System as a Stress Markers in Plant Ecophysiology: Is a Stress-Response Concept Valid? Journal of Experimental Botany, 55, 1955-1962.
http://dx.doi.org/10.1093/jxb/erh194 - 43. Schachtman, D.P. and Goodger, Q.D. (2008) Chemical Root to Shoot Signaling under Drought. Trends in Plant Science, 13, 281-287.
http://dx.doi.org/10.1016/j.tplants.2008.04.003 - 44. Koffler, B.E., Luschin-Ebengreuth, N.L., Stabentheir, E., Müller, M. and Zechmann, B. (2014) Compartment Specific Response of Antioxidants to Drought Stress in Arabidopsis. Plant Science, 227, 133-144.
http://dx.doi.org/10.1016/j.plantsci.2014.08.002 - 45. Koffler, B.E., Luschin-Ebengreuth, N.L. and Zechmann, B. (2015) Compartment Specific Changes of the Antioxidative Status in Arabidopsis thaliana during Salt Stress. Journal of. Plant Biology, 58, 8-16.
http://dx.doi.org/10.1007/s12374-014-0264-1 - 46. Finkelstein, R.B. and Rock, C.D. (2002) Abscisic Acid Biosynthesis and Response. The Arabidopsis Book, 1, e0058.
http://dx.doi.org/10.1199/tab.0058 - 47. Yamaguchi-Shinozaki, K. and Shinozaki, K. (2006) Transcriptional Regulatory Networks in Cellular Response and Tolerance to Dehydration and Cold Stresses. Annual Review of Plant Biology, 57, 781-803.
http://dx.doi.org/10.1146/annurev.arplant.57.032905.105444 - 48. Chan, K.X., Wirtz, M., Phua, S.Y., Estavillo, G.M. and Pogson, B.J. (2012) Balancing Metabolites in Drought: The Sulfur Assimilation Conundrum. Trends in Plant Science, 18, 18-29.
http://dx.doi.org/10.1016/j.tplants.2012.07.005 - 49. Jiang, M. and Zhang, J. (2002) Water Stress-Induced Abscisic Acid Accumulation Triggers the Increased Generation of Reactive Oxygen Species and Up-Regulates the Activities of Antioxidant Enzymes in Maize Leaves. Journal of Experimental Botany, 53, 2401-2410.
http://dx.doi.org/10.1093/jxb/erf090 - 50. Han, Y., Chaouch, S., Mhamdi, A., Queval, G., Zechmann, B. and Noctor, G. (2013) Functional Analysis of Arabidopsis Mutants Points to Novel Roles for Glutathione in Coupling H2O2 to Activation of Salicylic Accumulation and Signaling. Antioxidants & Redox Signaling, 18, 2106-2121.
http://dx.doi.org/10.1089/ars.2012.5052 - 51. Niu, Y., Wang, Y., Li, P., Zhang, F., Liu, H. and Zheng, G. (2013) Drought Stress Induces Oxidative Stress and the Antioxidant Defense System in Ascorbate-Deficient vtc1 Mutants of Arabidopsis thaliana. Acta Physiologiae Plantarum, 35, 1189-1200.
http://dx.doi.org/10.1007/s11738-012-1158-9 - 52. Petrov, V.D. and Van Breusegem, F. (2012) Hydrogen Peroxide—A Central Hub for Information Flow in Plants. AoB Plants, 2012, pls014.
http://dx.doi.org/10.1093/aobpla/pls014