Open Journal of Social Sciences
Vol.04 No.01(2016), Article ID:63210,13 pages
10.4236/jss.2016.41015
Parametric Characterization of an Industrial Production Technology: The Canadian Sawmilling Industry’s Case
Asghedom Ghebremichael
Department of Environmental Economics and Management, Michigan State University, East Lansing, MI, USA

Copyright © 2016 by author and Scientific Research Publishing Inc.
This work is licensed under the Creative Commons Attribution International License (CC BY).
http://creativecommons.org/licenses/by/4.0/


Received 24 November 2015; accepted 25 January 2016; published 29 January 2016
ABSTRACT
The goal of this study was to analyze a long-run technological progress in the Canadian sawmilling industry. Technological progress was considered as any kind of shift in the production technology estimated by total factor productivity growth (TFPG) and other parameters that complemented it. Out of six econometric models that were tested for efficacy in describing the technology, an unrestricted translog functional-form of a long-run total cost function described the technology sufficiently. The industry’s TFPG averaged 2.3% per year over the study period. Factor substitution elasticities implied that it was easy for the industry to substitute labor for capital and energy. The industry recorded increasing returns to scale and economies of scale; and technological progress was biased toward capital-using, energy-saving, and Hicks-neutral for labor and material. The multiple benefits that society derives from TFPG include: being one of the engines of economic growth, mitigation of natural capital depletion, minimization of wasteful-use of factors of production, mitigation of the adverse effects of inflation, boosting economic savings, freeing input factors to be reallocated to production of other goods and services, improvements in industrial competitiveness in the marketplace, and revealing possibilities to raise wage rates. Implications of the findings for industrial policymaking are discussed.
Keywords:
Total Factor Productivity, Factor Substitution Elasticities, Derived Demand for Inputs, Economies of Scale, Elasticity of Total Cost, Technological Progress

1. Introduction
The Canadian forest sector plays prominent roles in the national socioeconomic fabric to which the sawmilling industry is one of the major contributors. In 2013, for example, the sector contributed $20.9 billion to the national GDP, hired 321,300 persons, paid $8.7 billion in salaries and wages, and earned a trade balance of $19.2 billion [1] . Despite its importance, however, the Canadian forest sector experiences frequent challenges that are revealed through workforce layoffs, rapid pace of mergers, acquisitions, and mill closures. The challenges are often attributed to many market and non-market forces, which cannot be detailed in a single-science oriented article like this one.
Goal: The goal of this study is to characterize the Canadian sawmilling industry’s production technology parametrically. Effects of multiple parameters on the industry’s economic performance that include total factor productivity growth (TFPG), economies of scale, returns to scale, elasticity of total cost with respect to output, cost diminution, which is a dual measure of the primal TFPG, and own- and cross-price elasticities of derived demand for inputs are explored.
Hypothesis: Enhanced public and private investments in research and development (R&D) lead to human capital accumulation; hence, inventions/discoveries, which eventually lead to technological progress and thereby TFPG, which spurs economic growth [2] . Figure 1 illustrates the logic behind this hypothesis.
Figure 1 is a simple unidirectional virtuous cycle, which does not take into account positive or negative feed- backs. It shows the various stages through which the forces that usher in economic growth traverse. It is an attempt to highlight the conditions and sequences described by endogenous growth theory. For example, let us assume that exogenously designed enabling macroeconomic policy incentives (e.g., reduced corporate income tax, increased corporate investment credits, reduced royalties to harvest timber, and enabling institutional configurations and coordination) motivate corporations to join government agencies to enhance investments in R&D where inventions/discoveries might occur (Stage 1), leading to innovations (creative use of new technologies to generate value) (Stage 2), followed by diffusion (spread) of new technologies (Stage 3); and then, adoption of new technologies occurs (Stage 4) , which leads to technological progress, an upward shift of the technological frontier (Stage 5), revealed through TFPG (Stage 6), which boosts economic growth (Stage 7).
At the Canadian sawmilling industry level, plausibility of this hypothesis is expected to be realized through TFPG, conditioned upon: 1) technological progress, i.e., an upward shift of the production frontier, 2) optimized scale of operations, 3) technical efficiency, 4) sustainable forest ecosystem management, 5) environmentally
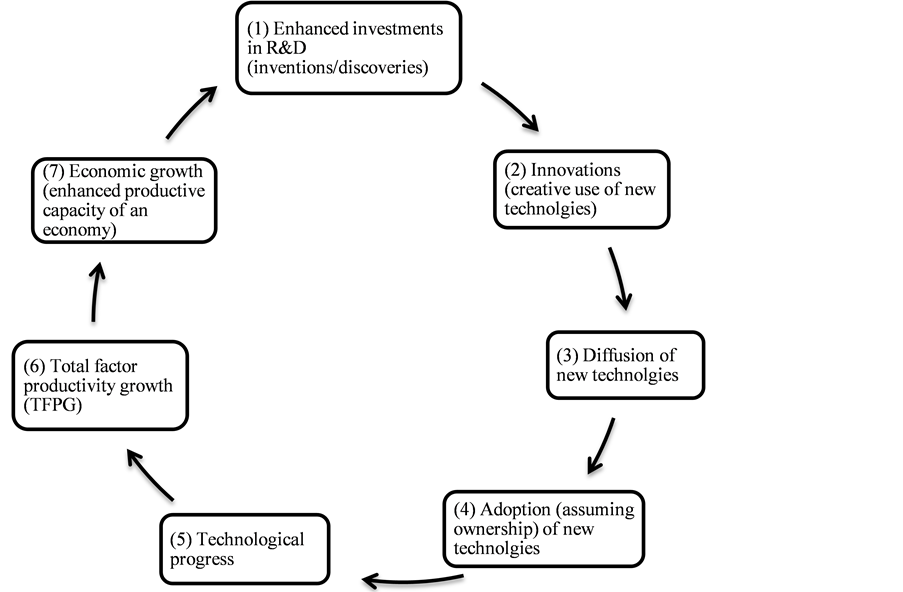
Figure 1. A virtuous cycle of enhanced investments in R&D.
friendly production processes, 6) risk-taking entrepreneurship and managerial competency, and 7) coherent policies implemented through effective institutional configurations that guide allocation of scarce-productive inputs effectively and efficiently [2] .
In an exogenous economic growth accounting of a neoclassical economic model, Robert Solow [3] [4] attri- butes TFPG to a “residual”, something leftover that cannot be attributed to exogenous or endogenous productive factors. However, other neoclassical economists, who adhere to the theory of endogenous growth, argue that economic growth, to which TFPG is a major contributor, is attributable to many endogenously determined factors that include quality of accumulated human capital, integration of international markets, spillovers, learning- by-doing, effective and efficient institutional configurations, social and physical infrastructures, and entrepreneurship-among many others [5] [6] .
In general terms, it can be postulated that, in dynamic production systems, there are always circular causations among all endogenous economic forces (Figure 1). This implies that if one condition changes, others will change in response, and so forth. Thus, changes in the conditional forces and their outcomes are interdependent; and the circular causations will have cumulative effects. Consequently, technological progress should be expected to usher in increasing returns to adoption: the more a new technology is adopted the more experiential knowledge, human capital, is accumulated.
Organization: In addition to this introductory section, the paper is organized into six sections: the next five sections present successively: theoretical framework, estimation techniques, the data, empirical results and discussion, and conclusions and policy implications.
2. Theoretical Framework
Microeconomic theory of production deals with the process of combining and coordinating productive resources and services, which are collectively called inputs. What to produce, how much to produce, and the optimal combination of all inputs are the key issues in any production process. These issues are of concern to a firm, an industry, a government, and a society.
Characterized by multiple inputs and multiple outputs, the Canadian sawmilling industry is one of the major- national economic entities. The following specification is assumed to explain its production technology:
 (1)
(1)
where: Q = aggregate of the three types of output: 1) lumber, 2) shakes and shingles, and 3) all marketable sawmilling operations’ byproducts that include wood chips, sawdust, slabs, edgings, and shavings, which are sold to pulp mills; K, L, E, and M are, respectively, capital, labor, energy, and raw materials, the sawlogs processed to produce various commodities (e.g., lumber and plywood); T is a time trend variable, which is expected to capture disembodied technological progress, measured by TFPG, a shifter of the production function in Equation (1) [3] [4] ; and the subscript t stands for a specific year during the study period.
Key assumptions: continuously twice differentiable aggregate production function, constant returns to scale, Hicks-neutral production technology, competitive market prices for inputs, and diminishing marginal productivity of each input.
Functional Form of the Empirical Model
Identifying and quantifying drivers of TFPG require parametric estimation of models with explicit performance factors built into a functional form that captures all technological attributes. A transcendental logarithmic (TL) functional form summarized in Equation (2), is expected to meet these requirements. This functional form is assumed to be a flexible second-order approximation to the industry’s long-run cost function; and is expected to explain the industry’s production technology [7] :
 (2)
(2)
where C = total cost of production; Q = aggregate output; Wi = price of input, i (= K, L, E, M); and T = time in years. By symmetry ; and all the terms interacting with time, T, imply technological effects. In order to correspond to a well-behaved production function characterized by constant returns to scale, a cost function must be homogeneous of degree one in input prices, i.e., the following conditions must hold:
 ;
; (3)
(3)
A homothetic production structure is further restricted to be homogeneous, if and only if, the elasticity of cost with respect to output is constant. For the TL cost function, therefore, homotheticity and homogeneity restrictions are imposed as follows:
 for homotheticity; and
  for homogeneity.
Derived demand functions for inputs: One of the important features of cost function estimation is that the derived demand functions for inputs can easily be obtained using Shephard’s lemma, which uses the envelope theorem:
 (4)
(4)
where xi stands for input i and SCi depicts a share of an input i in total cost. Note that the last portion of Equation (4) represents a system of demand functions for the four inputs: K, L, E, and M.
Derived demand elasticities for inputs: What are the economic and technological effects of changes in optimal demand functions for inputs in response to changes in the exogenously determined output and input prices? The sensitivity of the derived demand for input xi to a change in the price of xj is measured by the cross-price elasticity of demand, eij. That is, from Equation (4):
 (5)
(5)
where output quantity and prices of all other inputs, Wj,  , are fixed. Cross-price elasticity measures the percentage change in the cost minimizing demand for xi in response to the price of input xj, when gross output and all other input prices are held fixed. Since
 , positive
  implies inputs xi and xj are substitutes; negative
  implies they are complements; and
  reveals xi and xj are independent. Furthermore, the necessary condition for concavity curvature of the production function is met when all own-price elasticities,
  are negative.
Allen input substitution elasticities: For the TL cost function, the Allen Elasticity Substitution (AES) [8] ,  , is calculated from the following formulas:
 (6)
(6)
And the own-utilization elasticity of a factor is:
 (7)
(7)
AES is more credible than Morishima elasticity of substitution [9] . Hence, this study draws conclusions based on AES results.
The dual measure of TFPG: Differentiating Equation (2) with respect to time, T, yields the dual measure of TFPG [10] . That is,
 (8)
(8)
In the context of the long-run cost function, Equation (8) states that TFPG is equivalent to the rate of cost diminution,  , under given input prices and output quantity. A negative sign is attached to the partial derivative equation to ensure that a positive value of technological progress is achieved in a situation where production cost is falling.
Decomposition of the gross TFPG: Given estimates of the parameters of a system of equations that involve Equation (2) and three of the four share equations summarized in Equation (4), the way TFPG can be decomposed into its main sources is summarized in Equation (9) [11] :
 (9)
(9)
where  = elasticity of total cost with respect to output;
  = annual growth rate of the output; and
  = total cost diminution rate, which is attributable to disembodied technological progress; and it is a dual measure of the primal TFPG. The right hand side of Equation (9) contains two important components on which TFPG depends: the scale effect, which is a function of
  and
and , and the cost diminution rate,
 .
.
One important condition implicit in Equation (9) is that the formulation is based on the assumption that the Canadian sawmilling industry departs from the condition of constant returns to scale and perfect competition in input and output markets. This departure relaxes the condition that restricts gross TFPG to be explained only by technological change. If this assumption was violated and the production technology exhibits constant returns to scale, then . Consequently, the whole scale effect disappears, leaving only
 . This outcome makes the primal and the dual measures of TFPG equivalent [12] .
Returns to scale: Returns to scale (RTS) are estimated as reciprocals of :
:
 (10)
(10)
Under given input prices, the following are three important economic implications of the inverse relationship between RTS and : if the production function exhibits increasing returns to scale, then
  Þ doubling of output by doubling each input factor would less than double total cost; when the production technology is characterized by constant returns to scale, then
  Þ doubling output would equiproportionately double total cost; and, finally, if the production technology is in a decreasing returns to scale scenario, then
  Þ doubling output would more than double total cost.
Economies of scale: Although they are more applicable at a firm level, the literature shows that economies of scale (ES) are widely reported in industrial empirical studies to gain additional insights in characterizing industrial production technologies [13] 1. In the context of estimating a cost function, ES can be estimated from the relationship between total cost and output along the expansion path, where input prices are constant and costs are minimized at every output level. That is, ES is one minus the elasticity of cost with respect to output [14] :
 (11)
(11)
where  Þ economies of scale;
  Þ diseconomies of scale; and
  Þ constant returns to scale, i.e.,
 .
.
Hicks neutral versus biased technological progress: The technology is Hicks neutral, if  in Equation (8); for no technological progress,
 ; rejection of Hicks-neutrality of technological progress suggests biased technological progress; and this means that the technology is such that it saves more on some inputs than on others. Binswanger [15] derives the following formula for estimating bias in utilization rate of a given input:
 (12)
(12)
where Bi is the bias; T is technological progress variable, as described earlier; and SCi is the share of input i in total cost. For the TL cost function in Equation (2), the rate of bias can be estimated easily from the formula in Equation (13):
 (13)
(13)
where Bi > 0 Þ input i-using; Bi < 0 Þ input i-saving; and Bi = 0 Þ Hicks neutral.
3. Estimation Techniques
It is feasible to estimate the parameters of the TL total-cost function in Equation (2) and each of the cost share equations that are summarized in Equation (4), using ordinary least squares (OLS) equation by equation [14] . However, the OLS estimates of each equation will risk the problem of multicollinearity; and restrictions on cross-equation parameters must be imposed. In other words, since many of the coefficients in the unrestricted TL form long-run cost function and those in each of the share equations are the same, it is imperative that all these equations be estimated as a system simultaneously. This should be done not only to attain higher effectiveness of the models through minimized determinants of the cross-products’ matrix, but also to obtain the estimates of: , which all appear only in the unrestricted TL form in Equation (2). Because they are derived from partial differentiation of the long-run TL cost function, the cost share equations are not constrained by stochastic terms of their own. Moreover, it is assumed that the disturbance terms have a joint normal distribution; and the four cost shares sum to unity at each observation, leading the disturbance terms to add up to zero at each observation [16] . It should be expected also that the disturbance term in the unrestricted TL form total cost function to be correlated with the random errors of the share equations, which are nested in it. Thus, to ensure maximum efficiency, estimating the unrestricted TL total cost function and three of the four input cost share equations, as a multivariate regression system, applying the maximum likelihood estimation (MLE) method is the optimal approach. Note that MLE applied to a multi-equation chooses the set of parameters by minimizing the determinant of the residual cross-products’ matrix [12] .
That is, MLE minimizes the determinant . Six models are tested for capability of describing the Canadian sawmilling industry’s production technology. Model I is the unrestricted long-run TL form cost function in Equation (2). The test models are: Model II for Hicks-neutrality of technological progress; Model III for presence of technological progress; Model IV for homotheticity; Model V for homogeneity; and Model VI for unitary elasticity.
The likelihood ratio test approach was used to test the various theoretical restrictions. Likelihood ratio test is a more general method that does not utilize least squares and does not rely on the normality of the error term [17] . This procedure, which is summarized in Equation (14), is based on the notion that, for large sample size, the test statistic,l, follows the chi-square, c2, distribution.
 (14)
(14)
where ULLF and RLLF are the maximized values of the unrestricted and the restricted log-likelihood functions, respectively, while m, the subscript of c2, depicts the number of the imposed restrictions, which are used as degrees of freedom. Multiplying the parenthesized value in Equation (14) by two approximates the LR to chi-square distribution [18] . The testing procedure involves a simple comparison of the calculated value of  with its critical value,
  , at a 5% level of significance. That is, if l is greater than
 , then, the null should be rejected.
4. The Data
Covering a 40-year period (1961-2000)2, the database includes multiple data sets, each comprising several variables. The output and input variables, including implicit derivations of some of the required variables and the main sources, are summarized here. For lack of space, an independent note, Database Technical Note, was used to detail all the secondary and primary sources as well as the preliminary processing procedures of the raw data.
4.1. Outputs
The sawmilling industry is a multioutput industry. For the purpose of this study, the sawmilling industry is Sector 251 of the 1980 Standard Industrial Classification (SIC-E-251), which includes plants primarily engaged in manufacturing lumber, both rough and dressed, and other sawmill and/or planing mill products, covering products of the Shingle and Shake Industry (SIC-E-2511) and the Sawmill and Planing Mill Products Industry (SIC- E-2512). Accordingly, the industry is treated as a multi-output industry: 1) lumber, 2) shakes and shingles, and 3) an aggregate of all the byproducts of sawmilling operations that include wood chips, veneer cores, slabs, edgings, sawdust, and shavings.
Lumber (SIC-E-2512): The annual series of lumber output (Q1) were collected from Table I-4 of Selected Forestry Statistics Canada (CFS 2006a). The quantities and values of shipments that were used to the derive implicit annual price series were collected from Table I-6 of Selected Forestry Statistics Canada Special Edition- Historical Series (CFS 2001) and from Statistics Canada Catalogue No. 35-204 and 35-250. A series of industrial product price index (IPPI) for the Wood Industries Group (SIC-25-E) was collected from Selected Forestry Statistics Canada Special Edition-Historical Series, Table V-1 and from Statistics Canada Catalogue No. 62- 011. These indices were used to convert the current dollar prices into real dollar prices.
Shakes and shingles (SIC-E-2511): The annual series of value added in production activities were collectedfrom various issues of the Selected Forestry Statistics reports of the Canadian Forest Service and Statistics Canada. Industrial product price indices (IPPI) were used to derive output quantity (Q2) implicitly.
Wood residues: An annual series of quantities (Q3) of wood residues sold to pulp mills and their current dollar prices were collected from multiple sources.
Finally, the multiplicative form of the Törnqvist quantity index formulation in Equation (15) was used to aggregate the three outputs. This procedure is a discrete time approximation to the Divisia index procedure [19] - [21] .
 (15)
(15)
where w = a weight of the share of output i (=1, 2, 3) in total revenue during the base and current years, depicted by s and t, respectively.
4.2. Inputs
The multiple inputs that characterize the industry’s production function are summarized as follows:
Capital stock and rental price: Statistics Canada, the agency which provided nominal and real values of capital, classifies the stock of capital input of the sawmilling industry into three major asset categories: 1) building construction (e.g., plants and offices), 2) engineering construction (e.g., roads, dams, and bridges), and 3) machinery and equipment.
The perpetual inventory method (PIM), pioneered by [19] and subsequently refined by [20] [21] , was used to compute the rental price of capital. PIM provides an estimate of the “true opportunity cost” of using a given capital asset, because it takes into account effects of corporate income tax rates, investment tax credits, and property taxes on the true cost of the funds tied up in physical assets, economic depreciation, and capital gains or losses due to changes in an asset price
Labor: Two sets of labor input in production and in management activities Are identified. The values for each set Are collected from Table III-11A in Selected Forestry Statistics Canada (CFS 2006a). The annual number of workers in production (LP = labor in production) was subtracted from the total number of employees in both production and management to determine the total number of employees in management and administration (LM = labor in management). Similarly, wages in production (WP) Are subtracted from total salaries and wages reported for both production and management to obtain total wages in management (WM). Then, WP divided by LP provided labor price in production (W1), while WM divided by LM provided labor price in management and administration (W2). Finally, a quantity weighted average price of labor, WL, was calculated.
Energy: The quantity of energy was derived implicitly. Total cost of fuels and electricity was collected from Table III-11A in Selected Forestry Statistics Canada (CFS 2006a). Then, industrial energy consumption price indices were collected from Economic Reference Tables (old title) and Fiscal Reference Tables (current title) of the Department of Finance Canada (2006) for deriving implicit energy quantity.
Harvested timber: A complete annual series of harvested timber, the sole raw material input, were collected from various issues of the Selected Forestry Statistics report of the Canadian Forest Service. Implicit prices were derived from quantity and value of shipments collected from various issues of Statistics Canada Catalogue Number 25-201.
5. Empirical Results
The empirical results of each of the six models are summarized in Table 1.
Model II results show that the Hicks-neutrality null hypothesis is rejected at the 5% level of significance in accordance with the log likelihood ratio (LR) test (Table 1). Furthermore, the LR test statistics show that neither the no technological progress hypothesis (Model III) nor the unitary elasticity hypothesis (Model VI) can be accepted at the 5% significance level. This suggests presence of technological progress over the study period. Rejection of the unitary elasticity hypothesis means that a Cobb Douglas functional form cannot describe the industry’s production technology.
In contrast, neither the null hypothesis on homotheticity (Model IV) nor that on homogeneity (Model V) can be rejected. These results indicate that either a homothetic or homogeneous model can describe the Canadian sawmilling industry’s production technology. Other studies have drawn similar conclusions [22] .
The outcome that a homothetic technology characterized the Canadian sawmilling industry over the study period is encouraging in empirical terms. It shows that both the input price ratios and the output level determined cost minimizing input combinations. This verifies specification of the industry’s total cost of production as a function of input prices and output level.
The objectives of this study, however, involve investigation of the dynamics of multiple technological attri- butes in order to analyze productivity performance of the industry. Model I, the nonhomothetic, unrestricted TL form long-run cost function, is selected as the one that meets the objectives. This decision is based on three main reasons. Firstly, it is a full technology model. In other words, it is the model with sufficient information necessary for conducting a complete analysis of the production technology. Secondly, a model that allows nonhomotheticity and nonunitary elasticity of substitution is required to adequately explain the production technology of the Canadian sawmilling industry. Thirdly, the results of this model show that all of the estimated coefficients that are required for computing the various measures of technological attributes are statistically different from zero (Table 1). Thus, the estimated parametric results from Model I are used to analyze the following technological attributes:
Factor substitution elasticities: The pairs of labor/capital, labor/energy, capital/material, and energy/material were substitutes to each other, while the pairs of labor/material and capital/energy were complements over the study period (Table 2).
The substitution elasticities of labor/capital and labor/energy are greater than unity, implying that it was relatively easy for the industry to substitute labor for capital and energy. These findings are consistent with economic theory in that productive inputs are expected to be neither perfect substitutes nor perfect complements.
Own-and cross-price elasticities of derived demand for inputs: The negative values of own elasticities of substitution,  , (Table 2) and of the own-price elasticities of demand,
  , (Table 3) reveal that the necessary condition for global concavity of the dual cost function is met.
Although most of the estimates are statistically significant, both the own- and the cross-price derived demand elasticities are inelastic. The cross-price elasticities between the pairs of capital/energy and energy/capital show complementarities; while the pairs of labor/capital, labor/energy, capital/labor, capital/material, energy/labor, and material/capital were substitutes (Table 3). The highly inelastic nature of the own- and the cross price elasticities indicates that each input was treated as a “basic” good during the study period. In other words, the Canadian sawmilling industry experienced very limited options for substituting one input for another.
Technological progress-biases: The production technology was characterized by capital-using, energy-saving, and Hicks-neutrality for labor and material (Table 4). That is, technological progress resulted in rising demand

Table 1. Parameters of six-translog form cost functions estimated according to IZEF/MLE procedure.
*** and ** indicate statistical significance at the 1% and 5% levels, respectively.
Table 2. AES estimates at sample mean (standard errors in parentheses).
*** and ** indicate significance at the 1% and 5% levels, respectively.
Table 3. Derived demand price elasticity estimates at sample mean for inputs (standard errors in parentheses).
*** and ** indicate significance at the 1% and 5% levels, respectively.
for capital, declining demand for energy, and had no effect on the individual demand functions for labor and material, ceteris paribus.
Table 4. Average annual rates of technological progress biases at ten-year intervals and the 40-year study period.
Table 5. Average annual results of the other key technological attributes at ten-year intervals and the 40-year study period.
An input bias technological progress has important economic implications. For example, the technology’s Hicks-neutrality on labor and material implies that technological progress in the Canadian sawmilling industry used labor and material proportionately to produce an optimal output, leaving the marginal rate of technical substitution of material for labor or vice versa as well as the price ratio of the two inputs fixed. That is, the isoquant moved inward along the expansion path.
The dual measure of the primal TFPG and other key attributes: The diminution rate of total cost of production, which is the dual measure of the primal TFPG, averaged a modest rate of 2.3% per year over the 40-year study period (Table 5).
Scale effects associated with inelastic total cost with respect to output, under given technology and input prices, resulted in increasing returns to and economies of scale (Table 5).
6. Conclusions and Policy Implications
Estimating an industry specific long-run cost function provides important information regarding the cost and the production structures of a given industry. Attributes that include decomposed measures of TFPG, factor substitution elasticities, measures and effects of technological progress-bias, elasticities of derived demand for inputs, returns to productive inputs, and economies of scale were measured and analyzed.
Cost minimization assumption in studies like this means that a rise in one input’s price increases total cost, calling for substituting a higher-price input by a lower-price one. For this to be realized, the degree of substitutability must be greater than unity. With the exception of the ease to substitute labor for capital and energy, less than unity elasticities of substitution between pairs of the other inputs revealed that the industry experienced limited input adjustment options. However, the nature of substitutability by itself has industrial policy implications. For example, sawlogs (the sole raw material inputs) accounted for average annual of nearly 70% of the total cost of production over the study period. Hence, the empirical results of elasticities of substitutability between capital and materials suggested that introducing technology, such as modernizing machinery and equipment, that would have enhanced efficiency in processing logs, would have been an important policy option to minimize cost.
Complementarities between input pairs were observed. According to the AES results, the input pairs of labor/material and capital/energy were complements. Complementarity has important policy implications for cost of production. If, for example, the rental price of capital rose, the price of energy would also rise. This would lead to significant rise in total cost, triggering inefficiency. Thus, targeting both inputs for cost minimization
would have been advisable policy-prescription for the Canadian sawmilling industry.
Technological progress in the industry was biased toward capital-using, energy-saving, and Hicks-neutral for labor and material. That is, technological progress resulted in rising demand for capital; declining demand for energy; and no effect on the individual demand functions for labor and material, ceteris paribus. This outcome has important economic and policy implications that call for continual research on the dynamics of factor supply and demand. For example, the capital-using result suggests need for investments in machinery, equipment, and computer hardware and software in order to improve efficiency. On the other hand, the Hicks-neutrality on labor and material implies that technological progress in the industry might have led to the use of labor and materials proportionately to produce a given level of output, leaving the marginal rate of technical substitution of material for labor or vice versa as well as the price ratio of the two inputs unchanged. An additional point that must be made is that energy prices exhibited rapid rising trends during the study period. Thus, the declining demand for energy might be attributed to its rising price, at least partially.
While they were statistically significant, both the own- and cross-price elasticities showed that input demands were price inelastic. This outcome indicated that each input was treated as a “basic good”; and that input price “rigidity” appeared to have prevailed in the industry over the study period. This condition is believed to be one of the sources of inefficiency along the production line, because cross-price effects, substitution effects, and output effects are mutually reinforcing production elements that influence the demand for an input and thereby productivity performance.
Inferred through its dual measure, the diminution rate of total cost of production, the industry’s TFPG averaged a modest rate of 2.3% per year over the study period. TFPG is considered as one of the engines of economic growth. Its importance is manifested through the fact that “it has become a workhorse of empirical economic growth analysis and that it is a closely watched government statistic” [23] . Its determinants, all of which have important policy implications, include technological progress, improved quality of human and physical capital, effective institutional arrangements, and efficiency of a given management system.
Society derives multiple benefits from TFPG, including its contributions to: 1) economic growth, 2) mitigation of natural capital depletion, 3) minimization of wasteful-use of factors of production, 4) mitigation of the adverse effects of inflation, 5) improvements in economic savings, 6) freeing input factors to be reallocated to production of other goods and services, 7) improvements in industrial competitiveness in the marketplace, and 8) possibilities of raising wage rates. Moreover, modern economic growth theory suggests two fundamental sources of growth: the rate of input factor accumulation and TFPG. Factor accumulation includes, but is not limited to, investments in human and physical capital, coupled with increases in the supply of labor force. Increases in the aggregate quantity of input factors, assuming no TFPG, can be expected to boost aggregate output at the rate of factor accumulation, while increases in TFPG, without increase in factor accumulation, can be expected to result in economic growth at the rate of TFPG. Furthermore, it can be postulated that per capita income grows at the rate of per capita factor accumulation and per capita TFPG.
Outcomes of this study have implications for policy making on: investments in R&D, compliance of logging companies with their obligations to be stewards of ecological integrity, technological progress in and transformation of the Canadian forest sector, and preserving ecological integrity. Thus, industrial policymaking strategies ought to focus on enhancing R&D investments, accumulating human and physical capital, improving effectiveness and efficiency of institutions, and boosting entrepreneurship capacity.
Acknowledgements
This is a product of many helping hands. For invaluable help in building the database, I am grateful to two experts of Statistics Canada: Mr. Richard Landry, Chief of the Capital Stock Section, and Ms. Mychele Gagnon, Senior Economist in the Capital Stock Section. For helpful guidance all the way through the course of the study, I am gratefully indebted to Robert J. Myers, distinguished professor of econometrics at the Department of Agricultural Economics, Michigan State University. For constructive comments, I thank David M. Nanang, Canadian Department of Natural Resources, and Shashi Kant, University of Toronto.
Cite this paper
AsghedomGhebremichael, (2016) Parametric Characterization of an Industrial Production Technology: The Canadian Sawmilling Industry’s Case. Open Journal of Social Sciences,04,113-125. doi: 10.4236/jss.2016.41015
References
- 1. Canadian Forest Service (2014) The State of Canada’s Forests. Annual Report 2014, Cat. No. Fo1-6/2014E, Natural Resources Canada, Ottawa. http://cfs.nrcan.gc.ca/pubwarehouse/pdfs/35713.pdf
- 2. Ghebremichael, A. (2015) Exploring Causal Linkages between Sustainable Forest Ecosystem Management and Technological Progress in Canadian Logging Industries. Canadian Journal of Forest Research, 45, 1419-1426. http://dx.doi.org/10.1139/cjfr-2015-0093
- 3. Solow, R.M. (1956) A Contribution to the Theory of Economic Growth. The Quarterly Journal of Economics, 70, 65-94. http://dx.doi.org/10.2307/1884513
- 4. Solow, R.M. (1957) Technical Change and the Aggregate Production Function. The Review of Economics and Statistics, 39, 312-320. http://dx.doi.org/10.2307/1926047
- 5. Romer, P.M. (1990) Endogenous Technical Change. The Journal of Political Economy, 98, S71-S102. http://dx.doi.org/10.1086/261725
- 6. Aghion, P. and Howitt, P. (2009) The Economics of Growth. The MIT Press, Cambridge, MA.
- 7. Christensen, L.R., Jorgenson, D.W. and Lau, L.J. (1973) Transcendental Logarithmic Production Frontiers. The Review of Economics and Statistics, 55, 28-45. http://dx.doi.org/10.2307/1927992
- 8. Allen, R.G.D. (1938) Mathematical Analysis for Economists. Macmillan, London.
- 9. Kant, S. and Nautiyal, J.C. (1997) Production Structure, Factor Substitution, Technological Change, and Total Input Productivity in the Canadian Logging Industry. Canadian Journal of Forest Research, 27, 701-710. http://dx.doi.org/10.1139/x96-190
- 10. Berndt, E.R. and Watkins, G.C. (1981) Energy Prices and Productivity Trends in the Canadian Manufacturing Sector, 1957-76: Some Exploratory Results. Cat. No. EC-22, Canadian Government Publishing Centre, Supply and Services Canada, Ottawa.
- 11. Denny, M., Fuss, M. and Waverman, L. (1981) The Measurement and Interpretation of Total Factor Productivity in Regulated Industries with Application to Canadian Telecommunications. In: Cowing, T.G. and Stevenson, R.E., Eds., Productivity Measurement in Regulated Industries, Academic Press, New York, 179-218.
- 12. Berndt, E.R. (1991) The Practice of Econometrics, Classic and Contemporary. Addison-Wesley Publishing Company, Reading.
- 13. Bhattacharyya, A. and Mitra, K. (1997) Decomposition of Technological Progress and Factor Bias in Indian Power Sector: An Unbalanced Panel Data Approach. Journal of Productivity Analysis, 8, 35-52. http://dx.doi.org/10.1023/A:1007720330754
- 14. Christensen, L.R. and Greene, W.H. (1976) Economies of Scale in US Electric Power Generation. Journal of Political Economy, 84, 655-675. http://dx.doi.org/10.1086/260470
- 15. Binswanger, H.P. (1974) A Cost Function Approach to the Measurement of Elasticities of Factor Demand and Elasticities of Substitution. American Journal of Agricultural Economics, 56, 377-386. http://dx.doi.org/10.2307/1238771
- 16. Zellner, A. (1962) An Efficient Method of Estimating Seemingly Unrelated Regression and Tests for Aggregation Bias. Journal of American Statistics Association, 57, 348-368. http://dx.doi.org/10.1080/01621459.1962.10480664
- 17. Pindyck, R.S. and Rubinfeld, D.L. (1998) Econometric Models and Economic Forecasts. 4th Edition, Irwin-McGraw- Hill, Boston.
- 18. Wooldridge, J.M. (2006) Introductory Econometrics: A Modern Approach. 3rd Edition, Thomson/South-Western, Mason.
- 19. Christensen, L.R. and Jorgenson, D.W. (1969) The Measurement of US Real Capital Input, 1929-1967. Review of Income Wealth, 15, 293-320. http://dx.doi.org/10.1111/j.1475-4991.1969.tb00814.x
- 20. Caves, D., Christensen, L.R. and Diewert, D.E. (1982) Multilateral Comparisons of Output, Inputs, and Productivity Using Superlative Index Numbers. Economic Journal, 92, 73-86. http://dx.doi.org/10.2307/2232257
- 21. Caves, D., Christensen, L.R. and Diewert, W.E. (1982) Economic Theory of Index Numbers and the Measurement of Input, Output, and Productivity. Econometrica, 50, 1393-1413.
- 22. Nautiyal, J.C. and Singh, B.K. (1985) Production Structure and Derived Demand for Factor Inputs in the Canadian Sawmilling Industry. Forest Science, 31, 871-881.
- 23. Hulten, C.R. (2001) Total Factor Productivity: A Short Biography. In: Hulten, C.R., Dean, E.R. and Harper, M.J., Eds., New Developments in Productivity Analysis, Studies in Income and Wealth, Volume 63, University of Chicago, Chicago, 1-52. http://dx.doi.org/10.7208/chicago/9780226360645.003.0001
NOTES

1The assumption is that identical organizational behavior of firms of an industry prevails at a given time. Although this might not be acceptable universally, it is acceptable for industries similar to the Canadian sawmilling industry, whose firms are characterized by: 1) homogeneity in inputs and outputs, 2) equitable impacts of federal policy measures, and 3) similar market structures.

2The North American Industrial Classification System (NAICS), which came into effect in 1998, has created some mix-up in industrial databases. Consequently, it was not possible to get consistent time series data beyond Year 2000. In fact, I had to do some extrapolation for the three data points of 1998, 1999, and 2000.