Open Journal of Preventive Medicine
Vol.2 No.1(2012), Article ID:17434,7 pages DOI:10.4236/ojpm.2012.21015
Physical activity, screen time and pediatric health-related quality of life in the Mississippi Delta
![]()
1Department of Pediatrics, University of Arkansas for Medical Sciences, Little Rock, USA; *Corresponding Author: perrytamarat@uams.edu
2Arkansas Children’s Hospital Research Institute, Little Rock, USA
3Department of Biostatistics, University of Arkansas for Medical Sciences, Little Rock, USA
Received 9 October 2011; revised 16 November 2011; accepted 22 December 2011
Keywords: Physical Activity; Screen Time; Quality of Life; Pediatrics
ABSTRACT
Background: The association of physical activity (PA) and screen time (ST) on health-related quality of life (HRQOL) among predominantly lowincome children in the Mississippi Delta region has not been previously described. Methods: We performed a cross-sectional survey to assess health risks from a representative sample of the population ≥ 3 years old in the Delta Region of Arkansas, Louisiana, and Mississippi. Linear models were utilized to examine Pediatric Quality of Life Inventory (PedsQL) scores based on reported PA and ST. Results: Median age of the 371 participants was 9.8 years, 57% were African American, and 26% had annual household income ≤ $14,999. Overall, 262 (75%) were categorized as physically active and 48% reported >2 hours ST per day. Children reporting exercising 5 - 7 days per week had significantly better PedsQL total score (84.3 vs 80.8; p < 0.05) and physical function subscale score (91.5 vs 85.6; p < 0.01) compared to inactive children. The relationship between PA and improved HRQOL was stronger among white children and children with total household income ≥ $15,000. High ST (>2 hours per day) did not significantly impact HRQOL. Conclusion: Findings suggest that PA among children living in the Mississippi Delta was related to higher HRQOL; however, the positive effects of PA on HRQOL may be less for minority and low-income children.
1. BACKGROUND
Long-term physical benefits of regular physical activity (PA) have been extensively studied with scientific evidence suggesting improvement in strength, agility, and coordination. More recently investigators have reported on the importance of PA on health outcomes. Positive health outcomes have been associated with regular PA in several chronic health conditions such as the metabolic syndrome, hypertension, arthritis, cardiovascular disease and others [1]. PA has been shown to have a positive impact on health-related quality of life (HRQOL) for the general population [2], and a limited number of studies have reported a positive impact of PA in pediatric populations [3-5]. The 2008 Physical Activity Guidelines for Americans published by DHHS were designed to provide guidance on the types and amounts of physical activity necessary for substantial health benefits for Americans aged 6 years and older [6]. The rationale for establishing the guidelines was to promote long-term health benefits from regular PA over months and years. Guidelines for children ages 6 - 17 years were established as follows: 1) 1 hour or more of accumulated physical activity per day; 2) this 1 hour of activity should be comprised mostly of moderate or vigorous intensity aerobic activity with vigorous intensity activities being included at least 3 days a week; and 3) muscle-strengthening and bone-strengthening activities should also be included on at least 3 days week.
The American Academy of Pediatrics (AAP) position statement cites many adverse pediatric outcomes associated with sedentary behavior as measured by increased screen time (ST) including increased obesity risk, increased aggressive behavior and poorer school performance [7]. For this reason, the AAP recommends limiting pediatric ST from all media sources (television, video games, computer, etc.) to ≤2 hours per day for children ≥2 years old and no media exposure for children <2 years old. The validity of these guidelines has been supported by several investigations that reveal the negative associations between increased ST and Body Mass Index [BMI] [8], metabolic risk [9], psychosocial and academic well-being [10], and physical activity [11]. Despite these numerous reports on the health benefits of PA and increased health risks associated with sedentary behavior, investigations are lacking on the impact of such behaviors on HRQOL among predominately minority children living in high risk rural environments. In the current study, we examined the impact of PA and ST on HRQOL among predominantly minority, rural children living in the Mississippi Delta region of the US.
Children in the Mississippi Delta region live in predominately agricultural environments with high rates of poverty and increased risk of chronic health conditions [12- 15]. These previous investigations have revealed significantly increased risk for poor health outcomes as well as poor functional status among adult residents living in the region. We conducted the current investigation to assess the relationship between PA and ST on child HRQOL in an effort to inform current public health policy regarding PA among children at high risk for poor health outcomes. We hypothesized that increased PA and decreased ST would be associated with improved HRQOL among children in the Mississippi Delta.
2. METHODS
PA and QOL data were examined from a cross-sectional, random-digit telephone survey of food intake from a representative sample of the population 3 years and older from 36 counties in the Delta Region of Arkansas, Louisiana, and Mississippi [16-18]. The sample population is representative of the larger rural Mississippi Delta region where there is a high concentration of minority residents and families with children living in poverty (US Census Bureau 2011). As previously reported, the survey included a 24-hour dietary recall, a self-report on ST and PA, as well as questions from the Pediatric Quality of Life Inventory (PedsQL) version 4.0 [19,20]. PedsQL is a validated measure of HRQOL for children ages 2 - 18 years and has been utilized to assess pediatric QOL in numerous investigations. The PedsQL is a 23-item survey that encompasses 4 subscales including: physical functioning (8 items); emotional functioning (5 items); social functioning (5 items); and school functioning (5 items). A total score is derived from the 4 subscales. Survey scores were transformed to a 0 to 100 scale in which higher scores indicate better HRQOL. For the current study the total and physical functioning scores were considered. The survey was administered by computer-assisted telephone interview using the multiple-pass method and was conducted January-June 2000 utilizing a two-stage stratified cluster-sampling plan. In the first stage, the 36 counties were assigned to nine strata based on the proportion of residents residing in urban areas, proportion who were African-American, and the proportion who were living below the poverty level. Children were categorized as being 3 to 18 years of age and adults were 19 years or older. The primary ethnic groups in the Delta are non-Hispanic whites (hereafter referred to as whites) and African Americans. The study was approved by the University of Arkansas for Medical Sciences Institutional Review Board.
At first contact with the household, interviwers determined household eligibility. Eligible households had at least one member 18 years of age or older and a nonbusiness telephone number. During initial interviews, all household members were enumerated. Predetermined algorithms randomly selected one adult per household and one child until designated sample size was obtained. Race/ethnicity and education level of each household member were collected. Household income data and participation in nutrition assistance programs were obtained during subsequent interviews. Interviews with children were conducted with the assistance of a parent/guardian (proxy) for those younger than 11 years.
Survey design and data collection occurred prior to dissemination of DHHS national PA guidelines for children; therefore, the survey question regarding PA assessed frequency and intensity but not duration of exercise. The survey question used in the current study asked, “How often do you exercise, work or do other activities enough to work up a sweat?” The question was modified from a contemporary PA question on the Youth Risk Behavior Surveillance Survey (YRBSS) national survey [21,22] which asked “On how many of the past 7 days did you participate in physical activity for at least 20 minutes that made you sweat or breathe hard?” To approximate compliance with current PA guidelines, children who answered “daily” or “5 - 6 times per week” to the question, “How often do you exercise, work or do other activities enough to work up a sweat?” were categorized as physically active. Children were categorized as moderately active if they reported working up a sweat 1 - 4 days per week or minimally active if they reported working up a sweat <1 day per week. Because no statistically significant differences in HRQOL or ST were observed between the moderately active and minimally active groups, these groups were categorized together as the inactive group for statistical analyses.
Children were categorized as having high screen time if they reported >2 hours/day when asked, “How many hours did you sit and watch television or videos, play video games, or use the computer yesterday?” For statistical analysis, PA and ST were considered separate categories; therefore, individuals could be categorized as both physically active and as having high screen time.
Food security status was determined using the US Household Food Security scale [23]. Households were categorized as being food secure or insecure as previously described [18]. Briefly, food insecure homes were defined as those with limited or uncertain availability of nutritionally adequate and safe foods or limited or uncertain ability to acquire acceptable foods.
3. SAMPLE
Estimates from a pilot study [24] and from Continuing Survey of Food Intakes of Individuals (CSFII) [17,25] were used to calculate sample size using a two-sided test with 5% significance level and 80% power. Thus, 1727 households were determined large enough to detect differences from national data estimates for a variety of outcomes. Within those households, a sample size of 485 children, ages 3 to 17, was obtained. Details regarding the sampling design and collection of data used in this study have been previously published [16].
4. STATISTICAL ANALYSIS
Participant’s demographic characteristics were summarized. For continuous variables, the summaries include sample size, mean, standard deviation, and corresponding 95% confidence intervals. For categorical variables, the summaries include frequencies and percentages. Further, comparisons between categorical variables were made using Fisher’s Exact or Chi-square tests, and t-tests were used for continuous variables. Linear regression analyses were conducted with PedsQL (i.e. physical, psychosocial, and total scores) as the dependent variable and activity level (physically active or inactive) or screen time (ST > 2 hours/ day or ≤2 hours/day) as the independent variable. Covariates impacting either PA or HRQOL were included in the model. These covariates were child’s age, gender, ethnic group, annual household income level, BMI and food security. SAS® version 9.2 (SAS Institute Inc., Cary, NC) was used to conduct all analyses. All analyses (including descriptive summaries) incorporated sampling survey weights; the Jackknife II method of calculating variances available in SAS® version 9.2 (SAS Institute Inc., Cary, NC) was incorporated for all presented analytical computations. Additional details concerning the sampling survey weights are found in previously published reports [16].
5. RESULTS
Data were collected on 485 children between the ages of 3 and 17. Four-hundred and sixty-five completed a subsequent interview containing information on the adultreported household food security. Complete demographic, PA and ST data were available for 371 pediatric participants (Table 1). The median age of participants was 9.8 years. A slight majority were male (52%) and African American (57%). Annual household income was ≤$14,999 for 26% of participants and 24% were from homes that were food insecure.
Overall, 262 (75%) of participants were categorized as physically active with 169 (46%) stating that they worked up a sweat daily and 93 (28%) reporting that they worked up a sweat 5 - 6 days/week (Table 2). Significant differences were found when PA was compared between age groups (Table 3). Younger children age 3 - 8 years were more likely to be categorized as physically active (85%) as compared to 9 - 11 years (68%) or 12 - 17 years (69%) [p = 0.01]. There were no significant differences in reported PA based on other demographic characteristics.
High ST was frequently reported with 192 (48%) reporting >2 hours of ST (Table 2). Differences in ST behaviors were found between age and racial groups. Pre-teen children were more likely to report high ST with 65% of 9 - 11 year olds reporting >2 hours ST as compared to 36% of 3 - 8 year olds and 49% of 12 - 17 year olds. Also, 57% of black and 62% other minority children reported high ST as compared to 32% of white children (Table 4).
PedsQL scores were examined to determine if there were statistically significant differences between demographic groups. Significant differences were found between age, race, food security, BMI, and annual income categories; therefore, these variables and gender were
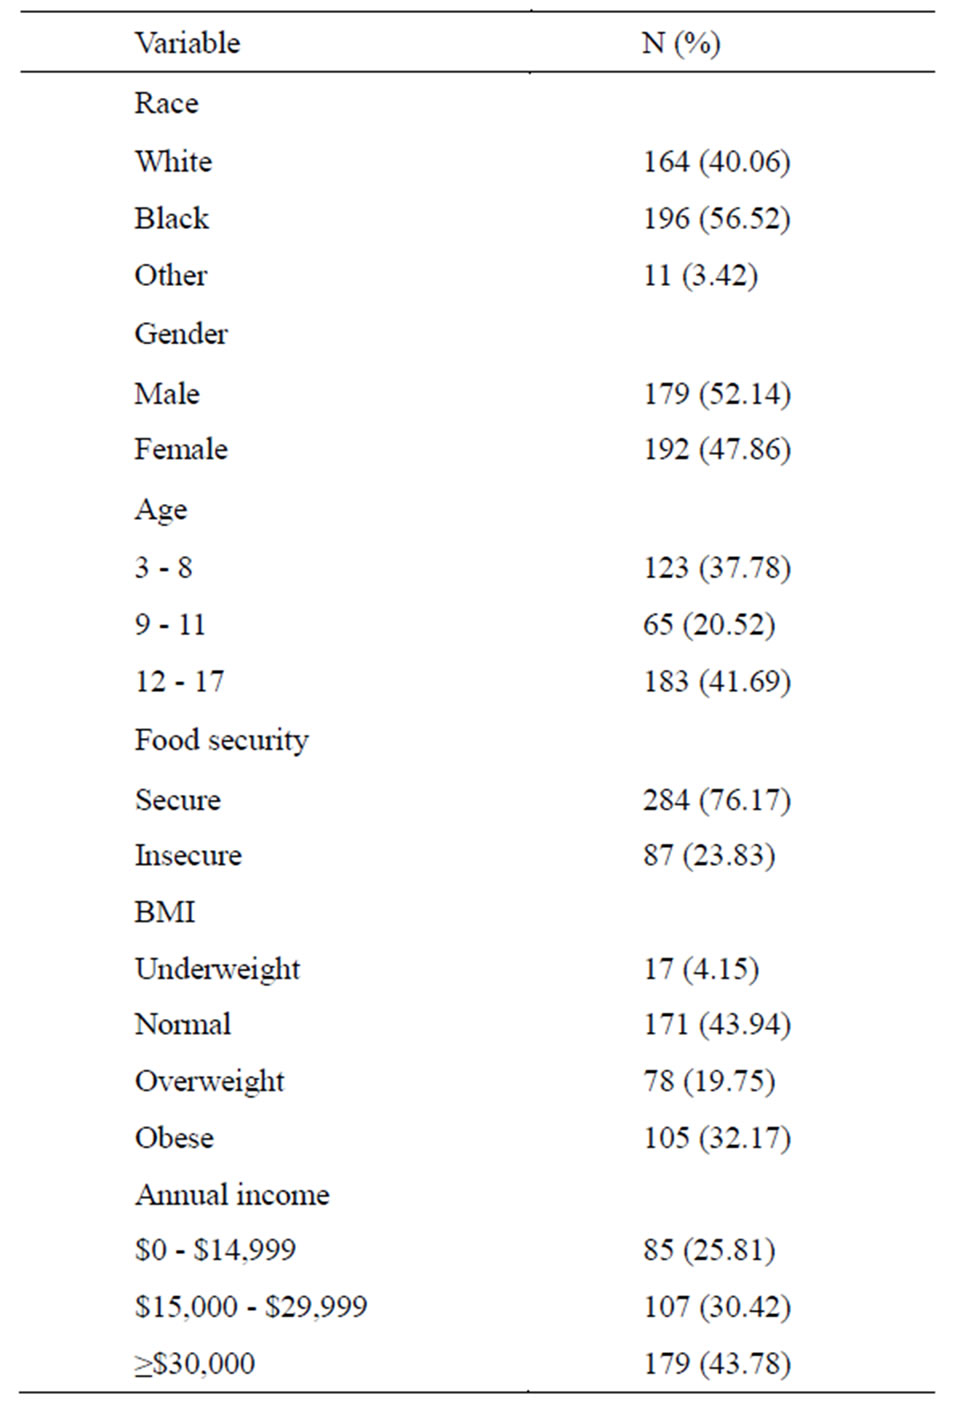
Table 1. Demographics, food security and BMI of children in the Mississippi Delta (n = 371).
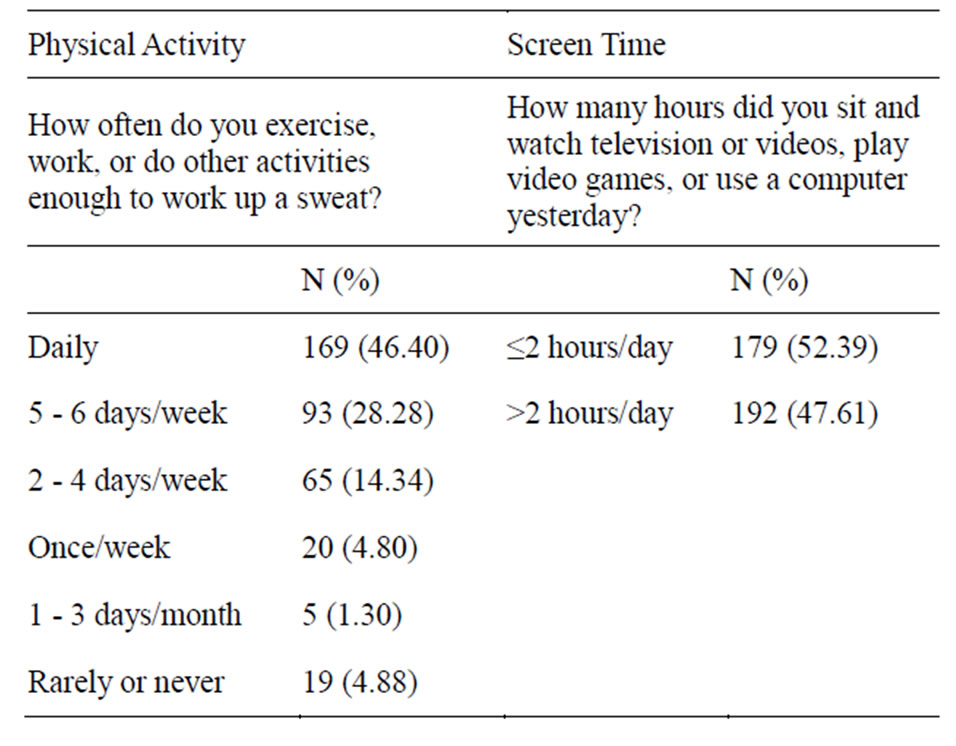
Table 2. Physical activity and screen time of children in the Mississippi Delta (n = 371).
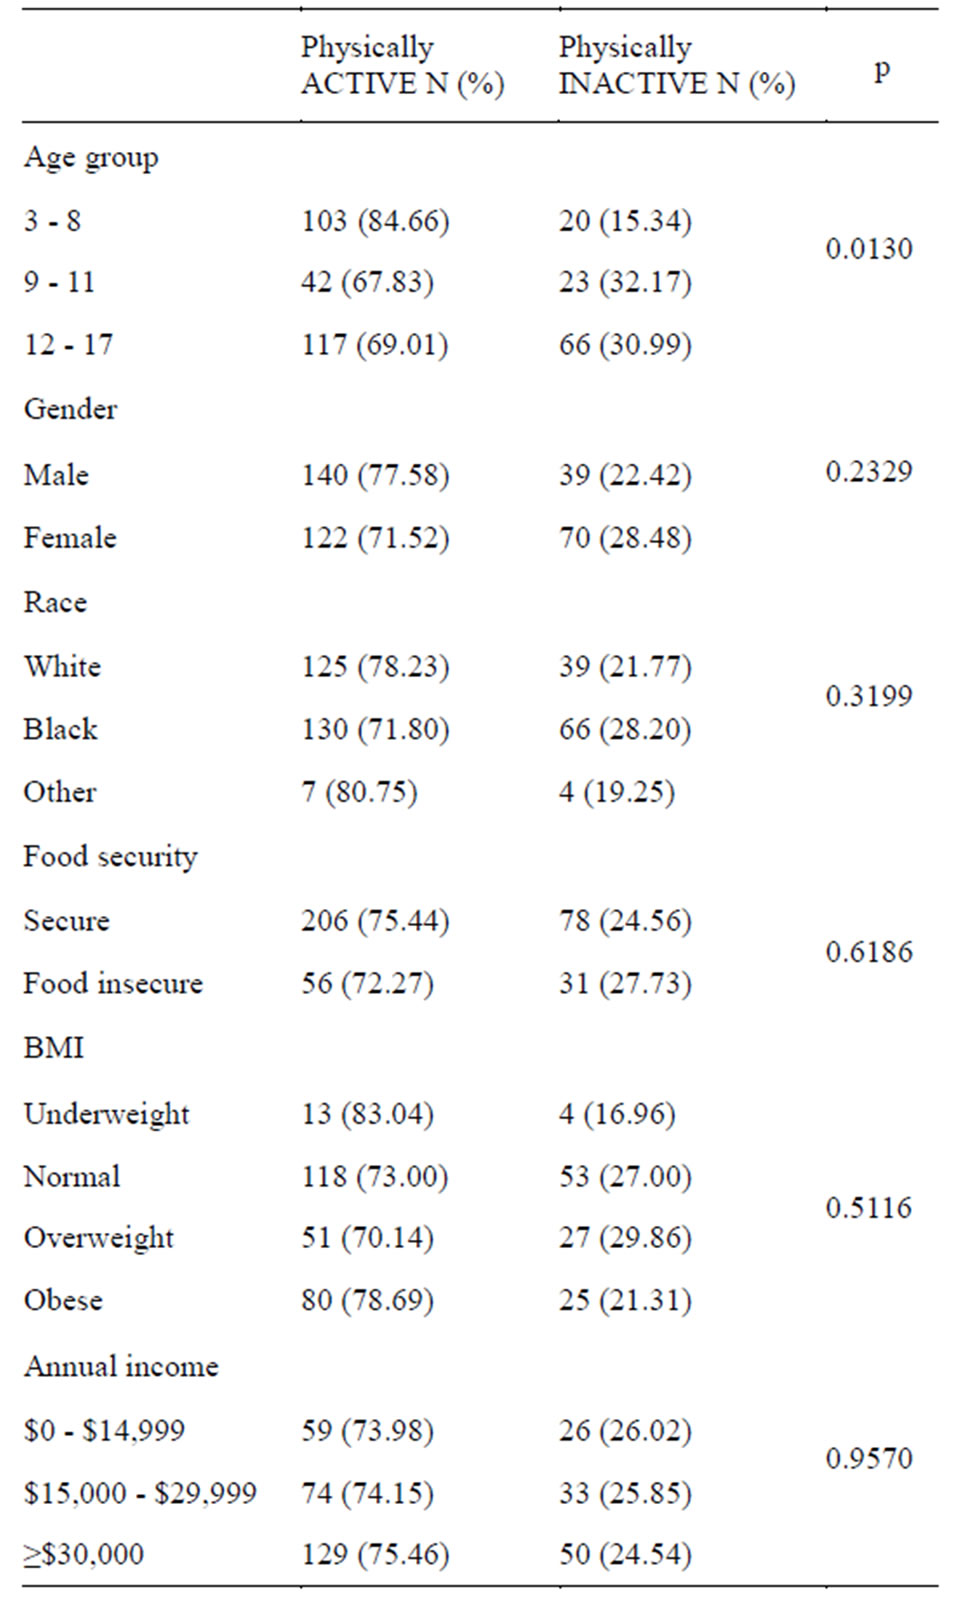
Table 3. Physical Activity (PA) by age, gender, race, food security, Body Mass Index (BMI), and annual income.
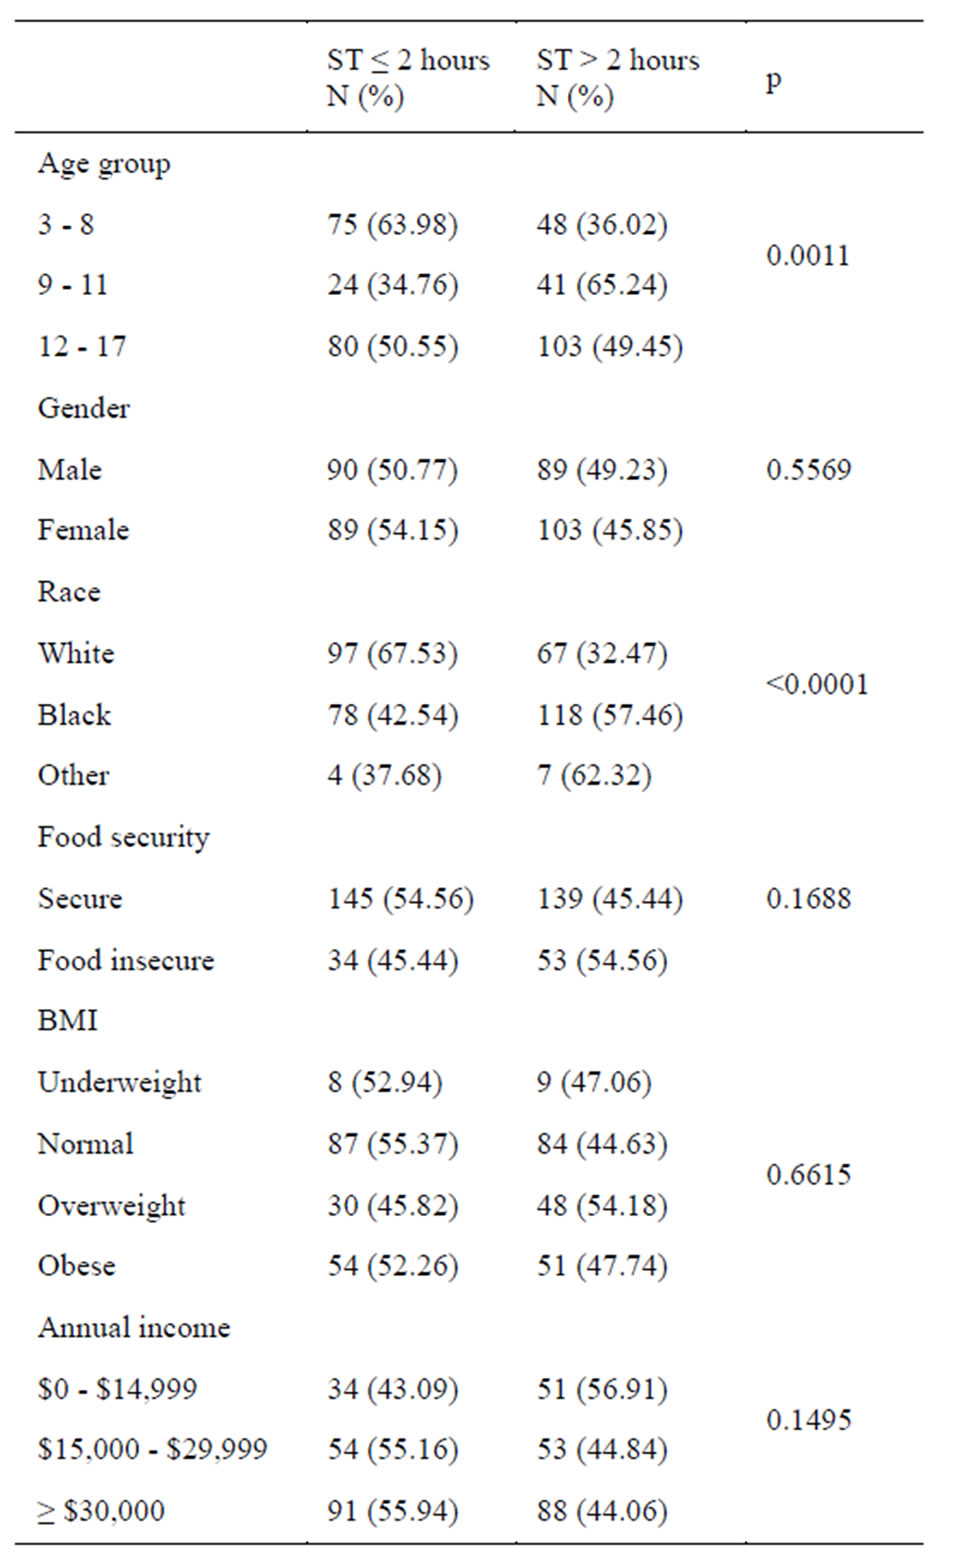
Table 4. Screen Time (ST) distribution by age, gender, race, food security, BMI and annual income.
included in linear regression models to determine impact of PA on HR-QOL. Overall, physically active children had significantly better HRQOL with higher mean total score (84.3 vs 80.8; p < 0.05) and physical function subscale score (91.5 vs 85.6; p < 0.01) on the PedsQL as compared to inactive children in unadjusted models. In univariate analyses, the trend of higher PedsQL scores among active children compared to inactive children was evident across all demographic categories. In multivariable analyses, physical function subscale score remained significantly higher for active compared to inactive children (91.7 vs 87.0; p < 0.01) after adjusting for age, gender, race, family income, BMI and food security (Table 5). In adjusted models, psychosocial subscale and total scores remained higher for the physically active group; however, results were not statistically significant. The positive relationship between physical functioning score and PA was most evident for physically active white children compared to inactive white children and
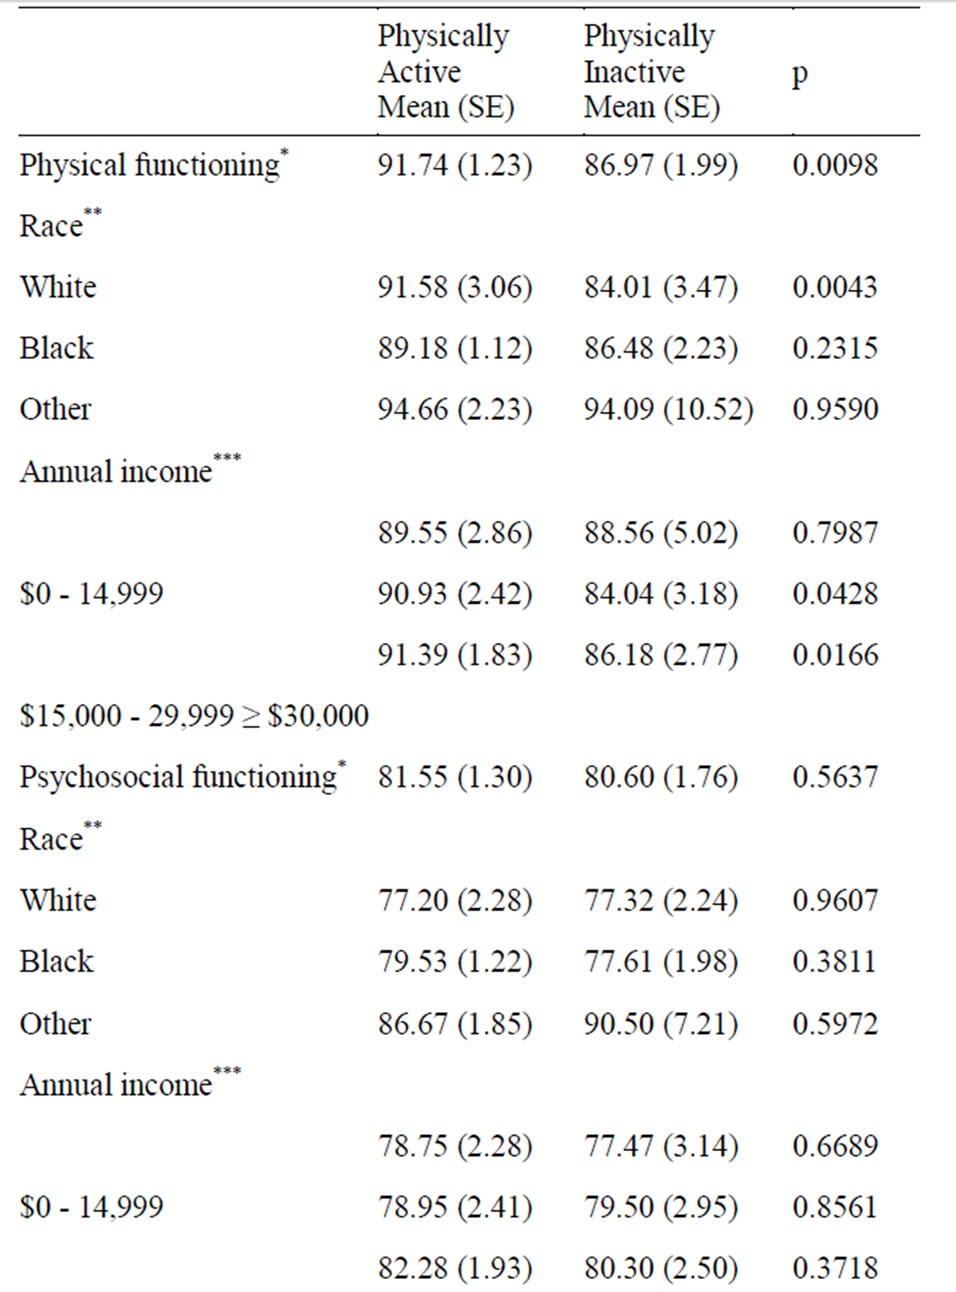
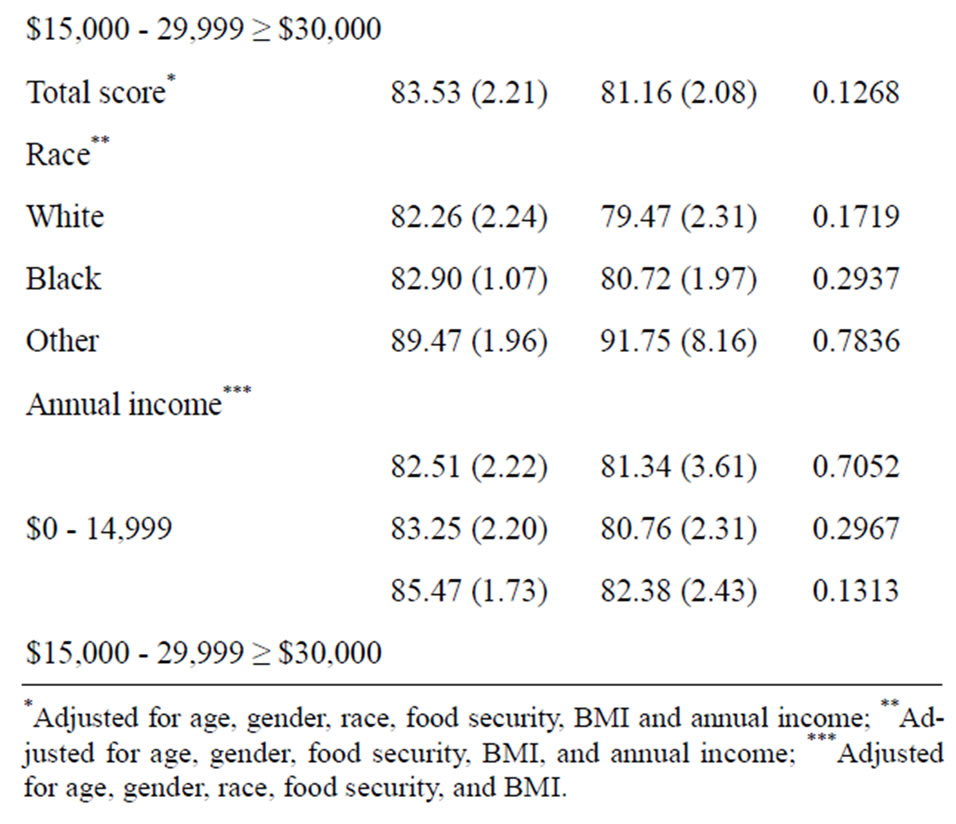
Table 5. Adjusted child health-related quality of life scores by physical activity.
physically active compared to inactive children with annual family income ≥$15,000 (Table 5). In addition, similar analyses were conducted to evaluate the relationship between ST and PedsQL scores and found no significant difference between high and low ST groups. For this reason, ST was not included as a covariate in the model describing the impact of PA on HRQOL.
6. DISCUSSION
The impact of PA on physical health for children has been extensively studied [1] and there are proven health benefits of regular exercise. Benefits include decreased risk of obesity and metabolic syndrome, improved bone strength and cardiovascular health; however, the impact of PA on child HRQOL has not been clearly elucidated for rural children living in the Mississippi Delta. With increasing public awareness and the implementation of public health campaigns to promote PA, determining the impact of PA on all aspects of health including quality of life is important. We found that PedsQL scores were higher among children who reported being physically active as compared to inactive children. These findings support our hypothesis that PA is positively associated with pediatric HRQOL. However, we found that among this representative sample of children from the Mississippi Delta region, positive effects of PA may be tempered by other factors related to social, environmental or demographic characteristics.
We were able to detect a trend of improved HRQOL among active participants as compared to inactive participants in all racial and income categories, however, higher income and white children were statistically significantly more likely to have improved HRQOL associated with PA as compared to lower income and nonwhite children, respectively. One factor that may have negatively influenced our ability to detect a statistically significant difference associated with PA for non-white children was the fact that HRQOL scores were higher for inactive non-white participants as compared to inactive white children, therefore, making it more difficult to detect the impact of PA due to ceiling effect.
Factors associated with the impoverished and rural locale of the region may be important in determining the types of available PA opportunities and the subsequent impact that PA has on HRQOL among certain demographic groups. Other investigators have reported negative associations between low socioeconomic status (SES) and PA. Gordon-Larsen et al. [26] reported that children living in lower SES and high minority blocks were less likely to have access to PA facilities and findings were related to decreased PA and increased prevalence of overweight among a representative sample of US adolescents. Humbert et al. [27]. found that low-SES children were more likely to report that nearby access to a recreational facility was a determining factor on their level of PA compared to high-SES children. Limited or no access to recreational facilities and organized PA is potentially more detrimental in low-income children compared to more affluent children due to parental concerns for neighborhood safety and fewer opportunities for spontaneous play outdoors [28,29] A recent AAP statement [30] outlines the importance of community design to include safe, accessible environments to promote daily PA.
In addition to differences in PA opportunities, there are other factors important in determining HRQOL for lowincome families. Psychosocial stressors such as depression, parental stress or other factors associated with poverty may overshadow the positive impact of PA in children. Several investigators have reported the negative impact of depression on QOL [31-33]; however, we did not have depression or stressor data available to determine the impact on child HRQOL or the relationship between psychosocial factors and PA or ST.
ST in excess of 2 hours/day was reported by 48% of the population. In 2001, the AAP recommended that children ≥2 years old should limit ST to 2 hours or less/day [7]. Recommendations were based on evidence that increased ST is linked to decreased PA and subsequent increased BMI. Since guidelines were established, several investigators have reported non-compliance with limited ST guidelines and have reported the relationship between increased ST and decreased PA [21,34]. The fact that we did not find a relationship between reported ST and decreased PA may be related to the design of the question that only inquired about the previous day’s ST. Perhaps an estimation of sedentary behaviors over a longer period of time and examination of additional types of sedentary behaviors (reading, homework, hanging out with friends, etc.) would have allowed for better determination of the impact of sedentary behavior on PA levels.
A potential study limitation was the design of the PA question and may have resulted in a high percentage of participants being categorized as physically active. In the Mississippi Delta, 75% of children were categorized as being physically active based on their response to the survey question regarding frequency of working up a sweat. This may have led to an overestimation of physically active children in the population since specifics about the type of exercise and duration was not available. Although frequency and intensity can be inferred by the question, duration of PA was not ascertained. The survey question was based on the contemporary PA questions on national surveys [21,22] and [35] prior to the release of national PA guidelines that recommended a specific duration (i.e. 60 minutes) of exercise.
7. CONCLUSION
In the current study we found a positive relationship between PA and HRQOL for a general population of children living in the Mississippi Delta, one of the most impoverished US regions. Our findings provide further evidence of the importance of programs that promote increased PA among children and highlight the need for these programs to specifically target children from the lowest income and minority groups since opportunities for PA may be limited in these populations. Children living in the Mississippi Delta and other impoverished regions need support of public health officials and community stakeholders to build environments conducive to healthier and more physically active lifestyles. In doing so, communities can realize the positive health benefits of PA and also improve quality of life for its youngest residents.
REFERENCES
- Janssen, I. and Leblanc, A.G. (2010) Systematic review of the health benefits of physical activity and fitness in school-aged children and youth. International Journal of Behavioral Nutrition and Physical Activity, 7, 40. doi:10.1186/1479-5868-7-40
- Bize, R., Johnson, J.A. and Plotnikoff, R.C. (2007) Physical activity level and health-related quality of life in the general adult population: A systematic review. Preventive Medicine, 45, 401-415. doi:10.1016/j.ypmed.2007.07.017
- Sagatun, A., Sogaard, A.J., Bjertness, E., Selmer, R. and Heyerdahl, S. (2007) The association between weekly hours of physical activity and mental health: A three-year follow-up study of 15-16-year-old students in the city of Oslo, Norway. BMC Public Health, 7, 155. doi:10.1186/1471-2458-7-155
- Sanchez-Lopez, M., Salcedo-Aguilar, F., Solera-Martinez, M., Moya-Martinez, P., Notario-Pacheco, B. and Martinez-Vizcaino, V. (2009) Physical activity and quality of life in schoolchildren aged 11 - 13 years of Cuenca, Spain. Scandinavian Journal of Medicine & Science in Sports, 19, 879-884. doi:10.1111/j.1600-0838.2008.00839.x
- Shoup, J.A., Gattshall, M., Dandamudi, P. and Estabrooks, P. (2008) Physical activity, quality of life, and weight status in overweight children. Quality of Life Research, 17, 407-412. doi:10.1007/s11136-008-9312-y
- US Department of Health and Human Services (2008) Physical activity guidelines for Americans. www.health.gov/paguidelines
- American Academy of Pediatrics (2001) Children, adolescents, and television. Pediatrics, 107, 423-426. doi:10.1542/peds.107.2.423
- Andersen, R.E., Crespo, C.J., Bartlett, S.J., Cheskin, L.J. and Pratt, M. (1998) Relationship of physical activity and television watching with body weight and level of fatness among children: Results from the Third National Health and Nutrition Examination Survey. Jama, 279, 938-942. doi:10.1001/jama.279.12.938
- Hardy, L.L., Denney-Wilson, E., Thrift, A.P., Okely, A.D, and Baur, L.A. (2010) Screen time and metabolic risk factors among adolescents. Archives of Pediatrics & Adolescent Medicine, 164, 643-649. doi:10.1001/archpediatrics.2010.88
- Pagani, L.S., Fitzpatrick, C., Barnett, T.A. and Dubow, E. (2010) Prospective associations between early childhood television exposure and academic, psychosocial, and physical well-being by middle childhood. Archives of Pediatrics & Adolescent Medicine, 164, 425-431. doi:10.1001/archpediatrics.2010.50
- Carlson, S.A., Fulton, J.E., Lee, S.M., Foley, J.T., Heitzler, C. and Huhman, M. (2010) Influence of limit-setting and participation in physical activity on youth screen time. Pediatrics, 126, e89-e96. doi:10.1542/peds.2009-3374
- (2004) Self-reported health of residents of the Mississippi Delta. Journal of Health Care for the Poor and Underserved, 15, 645-662. doi:10.1353/hpu.2004.0056
- Pearson, T.A. and Lewis, C. (1998) Rural epidemiology: Insights from a rural population laboratory. American Journal of Epidemiology, 148, 949-957.
- Smith, J., Lensing, S., Horton, J.A., et al. (1999) Prevalence of self-reported nutrition-related health problems in the lower Mississippi Delta. The American Journal of Public Health, 89, 1418-1421. doi:10.2105/AJPH.89.9.1418
- Centers for Disease Control and Prevention (2009) Estimated county-level prevalence of diabetes and obesity— United States, 2007. Morbidity and Mortality Weekly Report (MMWR), 58, 1259-1263.
- Champagne, C.M., Bogle, M.L., McGee, B.B., et al. (2004) Dietary intake in the lower Mississippi delta region: Results from the foods of our delta study. Journal of the American Dietetic Association, 104, 199-207. doi:10.1016/j.jada.2003.11.011
- Stuff, J.E., Casey, P.H., Szeto, K.L., et al. (2004) Household food insecurity is associated with adult health status. Journal of Nutrition, 134, 2330-2335.
- Casey, P.H., Szeto, K.L., Robbins, J.M., et al. (2005) Child health-related quality of life and household food security. Archives of Pediatrics & Adolescent Medicine, 159, 51-56. doi:10.1001/archpedi.159.1.51
- Varni, J.W., Seid, M. and Kurtin, P.S. (2001) PedsQL 4.0: Reliability and validity of the pediatric quality of life inventory version 4.0 generic core scales in healthy and patient populations. Medical Care, 39, 800-812. doi:10.1097/00005650-200108000-00006
- Varni, J.W., Limbers, C.A. and Burwinkle, T.M. (2007) Impaired health-related quality of life in children and adolescents with chronic conditions: A comparative analysis of 10 disease clusters and 33 disease categories/severities utilizing the PedsQL 4.0 Generic Core Scales. Health and Quality of Life Outcomes, 5, 43. doi:10.1186/1477-7525-5-43
- Eisenmann, J.C., Bartee, R.T. and Wang, M.Q. (2002) Physical activity, TV viewing, and weight in US youth: 1999 Youth Risk Behavior Survey. Obesity Research, 10, 379-385. doi:10.1038/oby.2002.52
- Kann, L., Kinchen, S.A., Williams, B.I., et al. (2000) Youth risk behavior surveillance—United States, 1999. MMWR Surveillance Summaries, 49, 1-32.
- Bickel, G., Nord, M., Price, C., Hamilton, W. and Cook, J. (2000) Measuring food security in the United States. Guide to measuring household food security. Alexandria, VA: US Department of Agriculture.
- Bogle, M., Stuff, J., Davis, L., et al. (2001) Validity of a telephone-administered 24-hour dietary recall in telephone and non-telephone households in the rural Lower Mississippi Delta region. Journal of the American Dietetic Association, 101, 216-222. doi:10.1016/S0002-8223(01)00056-6
- US Department of Agriculture ARS. Continuing survey of food intakes by individuals 1994-1996, 1998. CDROM (2000).
- Gordon-Larsen, P., Nelson, M.C., Page, P. and Popkin, B.M. (2006) Inequality in the built environment underlies key health disparities in physical activity and obesity. Pediatrics, 117, 417-424. doi:10.1542/peds.2005-0058
- Humbert, M.L., Chad, K.E., Spink, K.S., et al. (2006) Factors that influence physical activity participation among highand low-SES youth. Qualitative Health Research, 16, 467-483. doi:10.1177/1049732305286051
- Gomez, J.E., Johnson, B.A., Selva, M. and Sallis, J.F. (2004) Violent crime and outdoor physical activity among inner-city youth. Preventive Medicine, 39, 876-881. doi:10.1016/j.ypmed.2004.03.019
- Babey, S.H., Hastert, T.A., Yu, H. and Brown, E.R. (2008) Physical activity among adolescents. When do parks matter? American Journal of Preventive Medicine, 34, 345-348. doi:10.1016/j.amepre.2008.01.020
- Tester, J.M. (2009) The built environment: Designing communities to promote physical activity in children. Pediatrics, 123, 1591-1598. doi:10.1542/peds.2009-0750
- Papakostas, G.I., Petersen, T., Mahal, Y., Mischoulon, D., Nierenberg, A.A. and Fava, M. (2004) Quality of life assessments in major depressive disorder: A review of the literature. General Hospital Psychiatry, 26, 13-17. doi:10.1016/j.genhosppsych.2003.07.004
- Sapin, C., Fantino, B., Nowicki, M.L. and Kind, P. (2004) Usefulness of EQ-5D in assessing health status in primary care patients with major depressive disorder. Health and Quality of Life Outcomes, 2, 20. doi:10.1186/1477-7525-2-20
- Sobocki, P., Ekman, M., Agren, H., et al. (2007) Healthrelated quality of life measured with EQ-5D in patients treated for depression in primary care. Value Health, 10, 153-160. doi:10.1111/j.1524-4733.2006.00162.x
- Salmon, J., Timperio, A., Telford, A., Carver, A. and Crawford, D. (2005) Association of family environment with children’s television viewing and with low level of physical activity. Obesity Research, 13, 1939-1951. doi:10.1038/oby.2005.239
- Brener, N.D., Kann, L., McManus, T., Kinchen, S.A., Sundberg, E.C. and Ross, J.G. (2002) Reliability of the 1999 youth risk behavior survey questionnaire. Journal of Adolescent Health, 31, 336-342.
- Brener, N.D., Kann, L., McManus, T., Kinchen, S.A., Sundberg, E.C. and Ross, J.G. (2002) Reliability of the 1999 youth risk behavior survey questionnaire. Journal of Adolescent Health, 31, 336-342. doi:10.1016/S1054-139X(02)00339-7