Paper Menu >>
Journal Menu >>
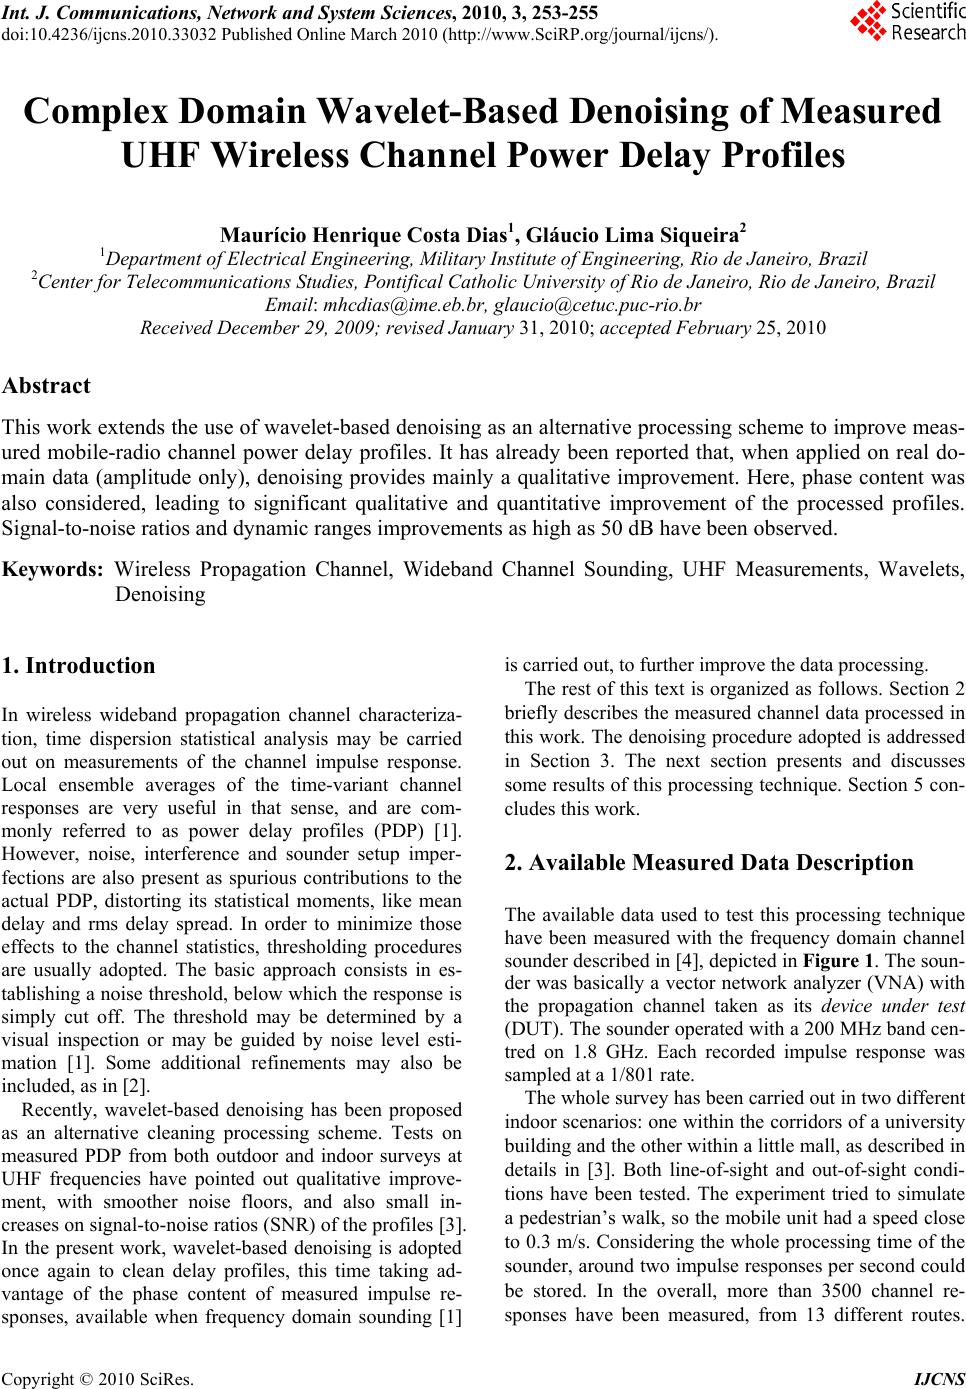 Int. J. Communications, Network and System Sciences, 2010, 3, 253-255 doi:10.4236/ijcns.2010.33032 blished Online March 2010 (http://www.SciRP.org/journal/ijcns/). Copyright © 2010 SciRes. IJCNS Pu Complex Domain Wavelet-Based Denoising of Measured UHF Wireless Channel Power Delay Profiles Maurício Henrique Costa Dias1, Gláucio Lima Siqueira2 1Department of Electrical Engineering, Military Institute of Engineering, Rio de Janeiro, Braz il 2Center for Telecommunications Studies, Pontifical Catholic Un iversity of Rio de Janeiro, Rio de Janeiro, Brazil Email: mhcdias@ime.eb.br, glaucio@cetuc.puc-rio.br Received December 29, 2009; revised January 31, 2010; accepted Feb ruary 25, 2010 Abstract This work extends the use of wavelet-based denoising as an alternative processing scheme to improve meas- ured mobile-radio channel power delay profiles. It has already been reported that, when applied on real do- main data (amplitude only), denoising provides mainly a qualitative improvement. Here, phase content was also considered, leading to significant qualitative and quantitative improvement of the processed profiles. Signal-to-noise ratios and dynamic ranges improvements as high as 50 dB have been observed. Keywords: Wireless Propagation Channel, Wideband Channel Sounding, UHF Measurements, Wavelets, Denoising 1. Introduction In wireless wideband propagation channel characteriza- tion, time dispersion statistical analysis may be carried out on measurements of the channel impulse response. Local ensemble averages of the time-variant channel responses are very useful in that sense, and are com- monly referred to as power delay profiles (PDP) [1]. However, noise, interference and sounder setup imper- fections are also present as spurious contributions to the actual PDP, distorting its statistical moments, like mean delay and rms delay spread. In order to minimize those effects to the channel statistics, thresholding procedures are usually adopted. The basic approach consists in es- tablishing a noise th reshold, below which the response is simply cut off. The threshold may be determined by a visual inspection or may be guided by noise level esti- mation [1]. Some additional refinements may also be included, as in [2]. Recently, wavelet-based denoising has been proposed as an alternative cleaning processing scheme. Tests on measured PDP from both outdoor and indoor surveys at UHF frequencies have pointed out qualitative improve- ment, with smoother noise floors, and also small in- creases on signal-to-noise ratios (SNR) of the profiles [3]. In the present work, wavelet-based denoising is adopted once again to clean delay profiles, this time taking ad- vantage of the phase content of measured impulse re- sponses, available when frequency domain sounding [1] is carried out, to further improve the data processing. The rest of this text is organized as follows. Section 2 briefly describes the measured channel data processed in this work. The denoising procedure adopted is add ressed in Section 3. The next section presents and discusses some results of this processing technique. Section 5 con- cludes this work. 2. Available Measured Data Description The available data used to test this processing technique have been measured with the frequency domain channel sounder described in [4], depicted in Figure 1. The soun- der was basically a vector network analyzer (VNA) with the propagation channel taken as its device under test (DUT). The sounder operated with a 200 MHz band cen- tred on 1.8 GHz. Each recorded impulse response was sampled at a 1/801 rate. The whole survey has been carried out in two different indoor scenarios: one with in the corridors of a university building and the other within a little mall, as described in details in [3]. Both line-of-sight and out-of-sight condi- tions have been tested. The experiment tried to simulate a pedestrian’s walk, so the mobile unit had a speed close to 0.3 m/s. Considering the whole processing time of the sounder, around two impulse responses per second could be stored. In the overall, more than 3500 channel re- sponses have been measured, from 13 different routes. 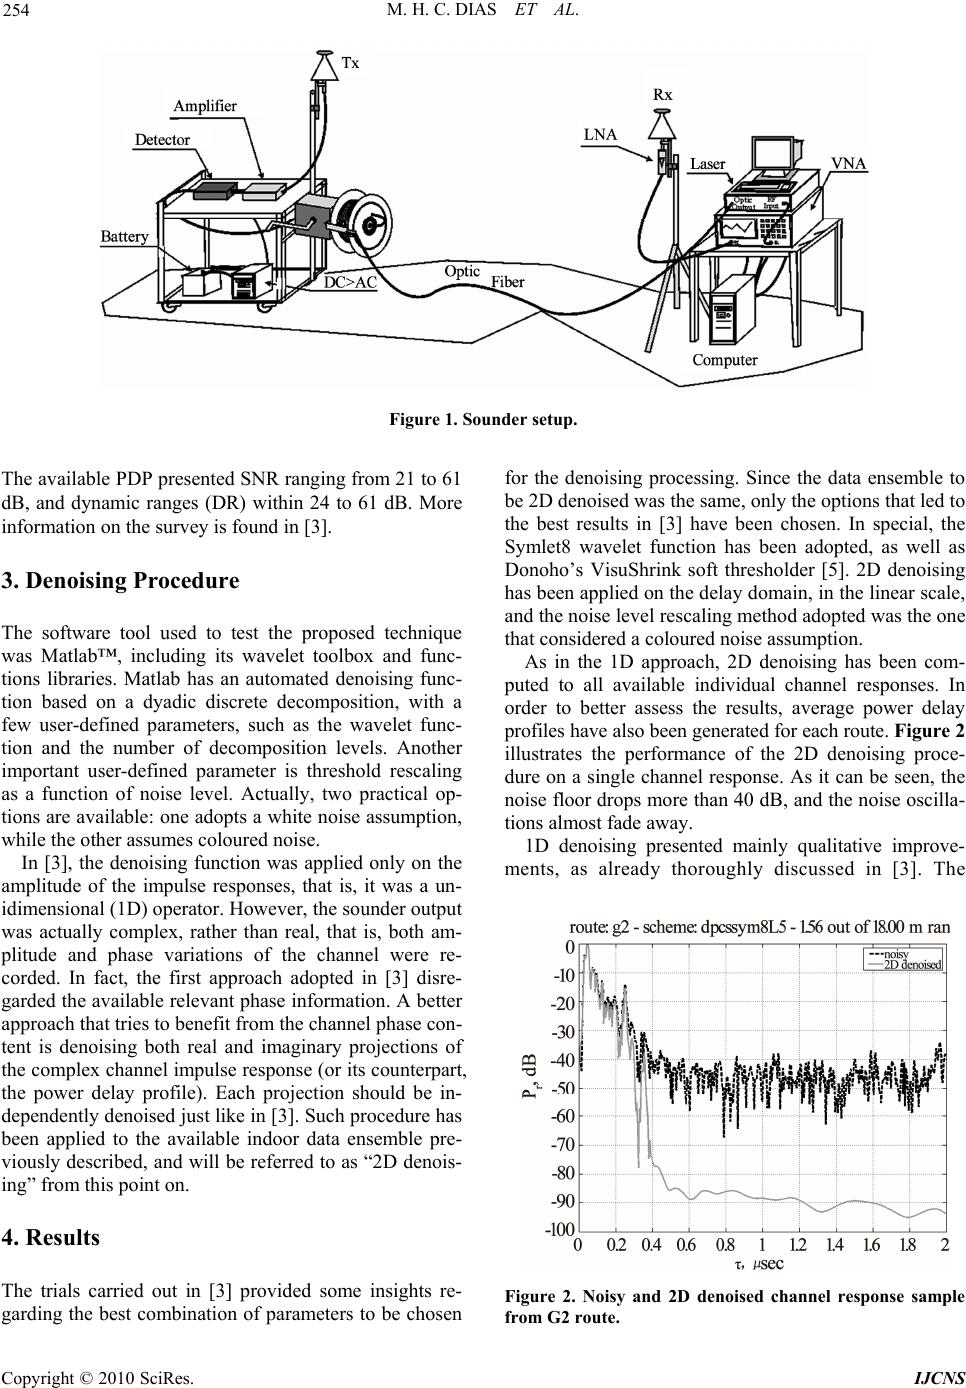 M. H. C. DIAS ET AL. 254 Figure 1. Sounder setup. The available PDP presented SNR ranging from 21 to 61 dB, and dynamic ranges (DR) within 24 to 61 dB. More information on the surv ey is found in [3]. 3. Denoising Procedure The software tool used to test the proposed technique was Matlab™, including its wavelet toolbox and func- tions libraries. Matlab has an automated denoising func- tion based on a dyadic discrete decomposition, with a few user-defined parameters, such as the wavelet func- tion and the number of decomposition levels. Another important user-defined parameter is threshold rescaling as a function of noise level. Actually, two practical op- tions are available: one adopts a white noise assumption, while the other assumes coloured noise. In [3], the denoising function was applied only on the amplitude of the impulse responses, that is, it was a un- idimensional (1D) operator. However, the sounder output was actually complex, rather than real, that is, both am- plitude and phase variations of the channel were re- corded. In fact, the first approach adopted in [3] disre- garded the available relevant phase information. A better approach that tries to benefit from the channel phase con- tent is denoising both real and imaginary projections of the complex channel impulse response (or its counterpart, the power delay profile). Each projection should be in- dependently denoised just like in [3]. Such procedure has been applied to the available indoor data ensemble pre- viously described, and will be referred to as “2D denois- ing” from this point on. 4. Results The trials carried out in [3] provided some insights re- garding the best combination of parameters to be chosen for the denoising processing. Since the data ensemble to be 2D denoised was the same, only the options that led to the best results in [3] have been chosen. In special, the Symlet8 wavelet function has been adopted, as well as Donoho’s VisuShrink soft thresholder [5]. 2D denoising has been applied on the delay domain, in the linear scale, and the noise level rescaling method adopted was the one that considered a coloured noise assumption. As in the 1D approach, 2D denoising has been com- puted to all available individual channel responses. In order to better assess the results, average power delay profiles have also been generated for each route. Figure 2 illustrates the performance of the 2D denoising proce- dure on a single channel response. As it can be seen, the noise floor drops more than 40 dB, and the noise oscilla- tions almost fade away. 1D denoising presented mainly qualitative improve- ments, as already thoroughly discussed in [3]. The Figure 2. Noisy and 2D denoised channel response sample from G2 route. Copyright © 2010 SciRes. IJCNS 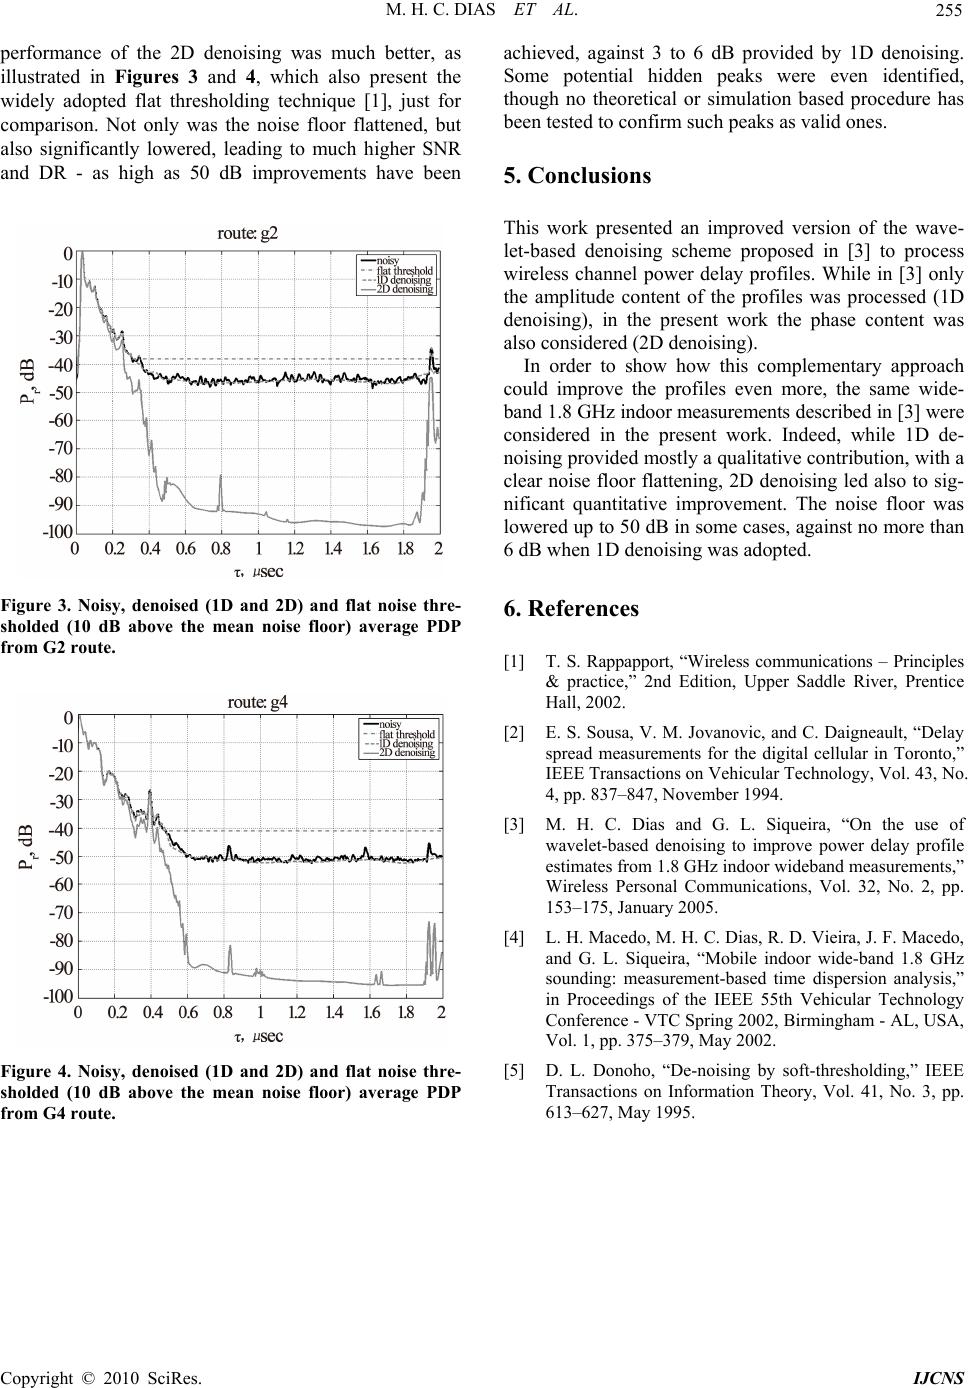 M. H. C. DIAS ET AL. 255 performance of the 2D denoising was much better, as illustrated in Figures 3 and 4, which also present the widely adopted flat thresholding technique [1], just for comparison. Not only was the noise floor flattened, but also significantly lowered, leading to much higher SNR and DR - as high as 50 dB improvements have been Figure 3. Noisy, denoised (1D and 2D) and flat noise thre- sholded (10 dB above the mean noise floor) average PDP from G2 route. Figure 4. Noisy, denoised (1D and 2D) and flat noise thre- sholded (10 dB above the mean noise floor) average PDP from G4 route. achieved, against 3 to 6 dB provided by 1D denoising. Some potential hidden peaks were even identified, though no theoretical or simulation based procedure has been tested to confirm such peaks as valid ones. 5. Conclusions This work presented an improved version of the wave- let-based denoising scheme proposed in [3] to process wireless channel power delay profiles. While in [3] only the amplitude content of the profiles was processed (1D denoising), in the present work the phase content was also consi dered (2D de n oi s i ng). In order to show how this complementary approach could improve the profiles even more, the same wide- band 1.8 GHz indoor measurements described in [3] were considered in the present work. Indeed, while 1D de- noising provided mostly a qualitative contribution, with a clear noise floor flattening, 2D denoising led also to sig- nificant quantitative improvement. The noise floor was lowered up to 50 dB in some cases, against no more than 6 dB when 1D denoisi n g was ado pt ed . 6. References [1] T. S. Rappapport, “Wireless communications – Principles & practice,” 2nd Edition, Upper Saddle River, Prentice Hall, 2002. [2] E. S. Sousa, V. M. Jovanovic, and C. Daigneault, “Delay spread measurements for the digital cellular in Toronto,” IEEE Transactions on Vehicular Technology, Vol. 43, No. 4, pp. 837–847, November 1994. [3] M. H. C. Dias and G. L. Siqueira, “On the use of wavelet-based denoising to improve power delay profile estimates from 1.8 GHz indoor wideband measurements,” Wireless Personal Communications, Vol. 32, No. 2, pp. 153–175, January 2005. [4] L. H. Macedo, M. H. C. Dias, R. D. Vieira, J. F. Macedo, and G. L. Siqueira, “Mobile indoor wide-band 1.8 GHz sounding: measurement-based time dispersion analysis,” in Proceedings of the IEEE 55th Vehicular Technology Conference - VTC Spring 2002, Birmingham - AL, USA, Vol. 1, pp. 375–379, May 2002. [5] D. L. Donoho, “De-noising by soft-thresholding,” IEEE Transactions on Information Theory, Vol. 41, No. 3, pp. 613–627, May 1995. C opyright © 2010 SciRes. IJCNS |