Journal of Biomedical Science and Engineering
Vol.6 No.3A(2013), Article ID:29575,8 pages DOI:10.4236/jbise.2013.63A052
Can semi-quantitative evaluation of uncertain (type II) time-intensity curves improve diagnosis in breast DCE-MRI?
![]()
1Department of Diagnostic Imaging, National Cancer Institute of Naples “Pascale Foundation”, Naples, Italy
2Department of Diagnostic Imaging, Second University of Naples (SUN), Naples, Italy
3Department of Breast Surgery and Oncology, National Cancer Institute of Naples “Pascale Foundation”, Naples, Italy
4Department of Diagnostic and Laboratory Pathology, National Cancer Institute of Naples “Pascale Foundation”, Naples, Italy
5Department of Electrical Engineering and Information Technology, University “Federico II” of Naples, Naples, Italy
Email: msansone@unina.it
Received 17 January 2013; revised 20 February 2013; accepted 4 March 2013
Keywords: Breast Cancer; Dynamic Contrast Enhanced-MRI; Time Intensity Curve; Tracer Kinetics; Semi-Quantitative Analysis
ABSTRACT
Objective/Background: Qualitative assessment of uncertain (type II) time-intensity curves (TICs) in breast DCE-MRI is problematic and operator dependent. The aim of this work is to evaluate if a semi-quantitative assessment of uncertain TICs could improve overall diagnostic performance. Methods: In this study 49 lesions from 44 patients were retrospectively analysed. Per each lesion one region-of-interest (ROI)- averaged TIC was qualitatively evaluated by two radiologists in consensus: all the ROIs resulted in type II (uncertain) TIC. The same TICs were semi-quantitatively re-classified on the basis of the difference between the signal intensities of the last-time-point and of the peak: this difference was classified according to two different cut-off ranges (±5% and ±3%). All patients were cytological or histological biopsy proven. Fisher test and McNemar test were performed to evaluate if results were statistically significant (p < 0.05). Results: Using ±5% cut-off 16 TICs were reclassified as type III and 12 as type I while 21 were reclassified again as type II. Using ±3% 22 TICs were reclassified as type III and 16 as type I while 11 were reclassified again as type II. The semi-quantitative classification was compared to the histologicalcytological results: the sensitivity, specificity, positive and negative predictive values obtained with ±3% were 77%, 91%, 91% and 78% respectively while using ±5% were 58%, 96%, 94% and 68% respectively. Using the ±5% cut-off 26/28 (93%) TICs were correctly reclassified while using the ±3% cut-off 34/38 (90%) TICs were correctly reclassified (p < 0.05). Conclusions: Semi-quantitative methods in kinetic curve assessment on DCE-MRI could improve classification of qualitatively uncertain TICs, leading to a more accurate classification of suspicious breast lesions.
1. INTRODUCTION
Despite the low specificity, dynamic contrast-enhanced MR imaging (DCE-MRI) has a high sensitivity in detecting and characterizing breast disease and it has evolved into an important adjunctive tool in Breast Imaging [1-6].
The vascularisation of the malignant lesions resulting from neo-vessels, that are the basis of exponential tumour growth, is one of the major reasons that dynamic features of MRI have played a crucial role in breast cancer for a decade [7-19].
DCE-MRI has been widely used to improve the sensitivity of MRI [4], adding information derived from kinetic-curve type to architectural and morphologic features. In fact lesions detection and characterization depend upon a combination of morphologic and kinetic observations [7,15].
Breast lesion enhancement can be characterized by assessing the enhancement kinetic curves obtained by plotting the signal intensity values over time after contrast material injection with time-intensity curves (TICs) [4,19]. The classification of the TICs is operator dependent and some overlaps are evident between benign and malignant lesions [7].
Kinetic curve analysis can be performed qualitatively (visual inspection of the curve shape), semi-quantitatively (by means of empirical parameters of signal intensity changes as gradient of the upslope of enhancement curves, maximum signal intensity and wash-out gradient) or quantitatively through pharmacokinetic modelling techniques [5-24].
In qualitative analysis is visually classified the initial and last enhancement of TIC. The initial enhancement can be described as fast, medium and slow, but this distinction is somewhat arbitrary and there are no set definitions [4-6].
The late patterns are defined as persistent, plateau and wash-out [4-6] and have been described by Kuhl [4]: type I (Ia-Ib) curve is a slow steady enhancement curve and is a strong indicator of benignancy (sensitivity and specificity of 52% and 71%); type III curve is associated with wash-out of signal intensity and is a strong predictor of malignancy (sensitivity and specificity of 20.5% and 90.4%); type II demonstrates plateau signal intensity and represents an intermediate probability of malignancy (sensitivity and specificity of 42.6% and 75%) [4-5,19].
Nevertheless it is suggested both type II and III curves should be considered suggestive of malignancy [4] intermediate are the most unspecific.
Since DCE-MRI was developed, the qualitative assessment has been considered one of the most important approaches for diagnosis. However, due to large operator dependency, many experimental studies have just proved this analysis assessment cannot be enough alone in distinguishing benign from malignant lesions [5].
Quantitative DCE-MRI can be achieved applying an adequate pharmacokinetic model to the TIC. This approach can yield parameters having a direct physiological interpretation. However, quantitative DCE-MRI involves many critical issues: accurate measurement of the arterial input function, accurate quantification gadolinium, choice of an adequate model, and accurate estimation of tracer kinetics parameters [6].
The simplest way of assigning pathological significance to TICs is to provide a description of the initial enhancement (by 1 - 2 min) followed by evaluation of the late enhancement pattern (semi-quantitative approach). It should be analyzed the first phase of signal intensity, how and how much it increases and the slope of late phase to obtain a careful evaluation.
The aim of this work is to evaluate if a semi-quantitative assessment of qualitatively uncertain (type II) TICs could improve overall diagnostic performance.
2. MATERIALS AND METHODS
2.1. Patients and Protocol
44 women (from 24- to 65-year-old, median age 46 years) underwent breast DCE-MRI examination at our institution.
They were affected by: Invasive Lobular Carcinoma (ILC) (6 subjects), Lobular Carcinoma in Situ (LCIS) (2), Invasive Ductal Carcinoma (IDC) (12), Ductal Carcinoma in Situ (DCIS) (6), phyllodes giant tumor (1), fibroadenomas (13), focalatypical forms of hyperplasia (10). They were all cytological or histological proven.
MRI was performed with a 1.5 T dedicated breast scanner (Aurora, USA), with an integrated coil designed specifically for 3-D bilateral breast imaging. The Spiral-Rodeo sequences fat-sat, in axial planes, were used (TE: 4.8 ms; TR: 29 ms; Matrix: 512 × 512; Slice Thickness: 1.12 mm; Gap: 0; Flip Angle: 45˚).
Dynamic study involved intravenous paramagnetic contrast media injection (Gd-BOPTA, Bracco Milan Italy, 0.1 mmol/kg; flow rate 2 ml/s; 20 ml of saline solution) and consisted of five measurements with an interval of 90 sec. The first frame was acquired before contrast injection immediately followed by the four other measurements. Maximum intensity projection (MIP) reconstructions and TICs were realized in the post-processing.
2.2. ROI Placement
Two expert radiologists in consensus manually delineated region of interests (ROI) along tumor contours: care was taken in covering the whole lesion excluding artefacts and blood vessels. All ROIs were drawn on the basis of the first or second subtraction image. One single ROI per lesion was placed.
2.3. Qualitative Analysis
ROI-averaged TICs were examined using either a qualitative or a semi quantitative analysis. A total of 49 TICs were analysed.
By qualitative analysis all TICs showed the same qualitative kinetic pattern: initial increasing enhancement, followed by plateau, thus they were all classified as type II according to classification reported in [4].
2.4. Semi-Quantitative Analysis
The semi-quantitative assessment was inspired by the work of El Khouli et al. [19]. Each TIC was classified on the basis of the difference between the percentage-enhancement at the last time point and the peak percentageenhancement: if the difference was in the range −5% to 5% the TIC was classified again as type II; for a difference greater than +5% the TIC was classified as type I; for a difference less than −5% the TIC was classified as type III.
2.5. Statistical Analysis
To evaluate the statistical performance of this method we analysed also other cut-off points in order to construct a ROC curve: maximization of the Youden Index [25] resulted in an optimal cut-off value.
The cut-off obtained by means the ROC analysis was used in order to revaluate the sensibility, specificity, positive and negative predictive values (PPV and NPV) of semi-quantitative analysis in comparisons of the cutoff range proposed by El Khouli et al. [26].
The number of TICs having a different classification after semi-quantitative analysis was calculated as follows: the percentage of lesions that changed from type II curve in type III; the percentage of lesions that changed from type II curve in type I; the percentage of correctly and incorrectly classified was also calculated and the chisquare test was used in order to evaluate if those percentage differences were statistically significant.
In order to evaluate sensitivity (SEN), specificity (SPE), positive predictive value (PPV), negative predictive value (NPV) and accuracy (ACC), two different criteria for TIC malignancy were used: first, a TIC was considered malignant if it was type III (Sq1); second, a TIC was considered malignant if it was type III or type II (Sq2). Fisher’s exact test was used to investigate the statistical significance of the Decision Matrix [27]. For comparing the Sq1 and Sq2 criteria the Mc-Nemar test was used [28]. A P value less than 0.05 was considered significant. The whole analysis was performed using the Statistic Toolbox of Matlab R2009b.
3. RESULTS
All the 49 lesions were classified as type II using qualitative analysis.
Figure 1 shows the ROC curve for various cut-off ranges. The optimum cut-off found maximizing the Youden Index was ±3%.
Table 1 reports the number of TICs per each category after re-classification according to the ±5% cut-off (proposed by [19]) and the optimal value of ±3% found in our study.
Table 2 reports SEN, SPE, PPV, NPV and ACC for both Sq1 and Sq2 criteria, using either ±5% or ±3% as cut-off ranges, with the corresponding P value.
In Table 3 the percentages of correctly and incorrectly re-classified TICs after the semi-quantitative analysis were reported with the corresponding P value.
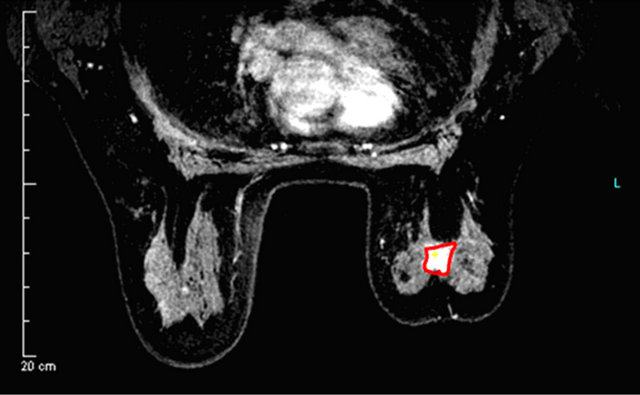
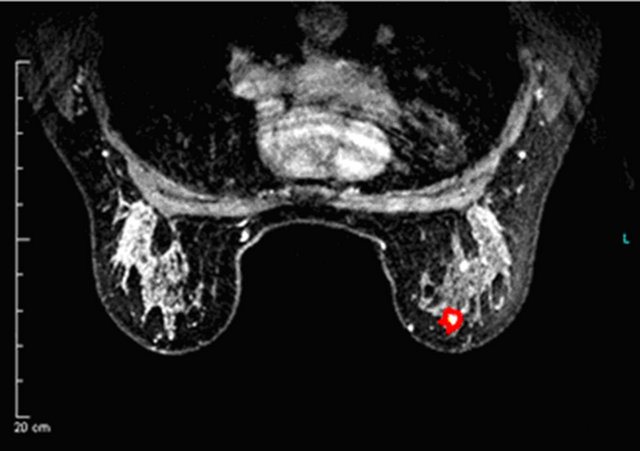
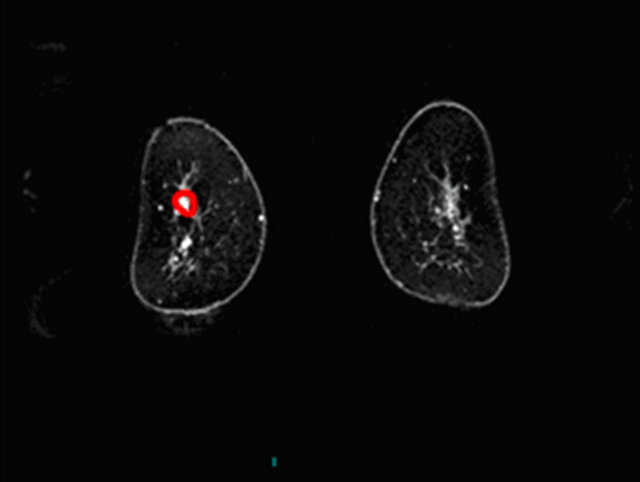
In Figures 2-4 we report a few exemplificative cases of FP and FN. In particular, Figure 2 shows a FN case of IDC that was classified as type I either using ±3% or ±5% as cut-off; Figure 3 shows a FP case of fibroadenoma that was classified as type III either using ±3% or ±5%; Figure 4 shows a case of fibroadeboma that was correctly classified as type I.
The differences in SEN and SPE between Sq1 and Sq2 criteria (using either ±5% or ±3%) were statistically significant (McNemar Test, P < 0.05). Considering ±5% as cut-off range the Sq1 methods had higher SPE and Sq2 had higher SEN. Considering ±3% as cut-off range the Sq1 methods had higher SPE and SEN compared to Sq2. Using ±3% as cut-off range higher SEN was achieved (McNemar Test, P < 0.05).
Table 1. Number of TICs per each type after re-classification.
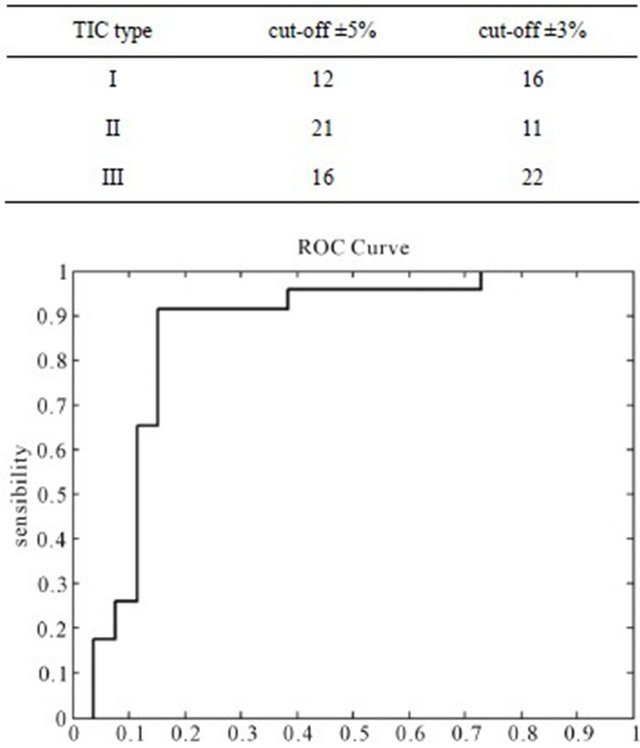

Figure 1. The receiver-operating characteristic (ROC) curve calculated for varying cut-off ranges of the semi-quantitative method: the optimal threshold value was ±3%.
Table 2. Accuracy of the two criteria for malignancy (Sq1 and Sq2) with either cut-off (±5% and ±3%).
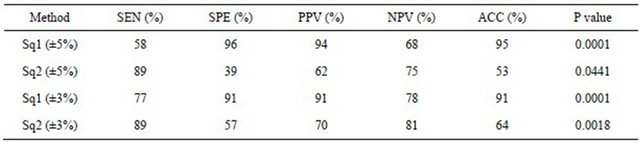
Table 3. Number of correctly and incorrectly diagnosed cases.
 (a)
(a)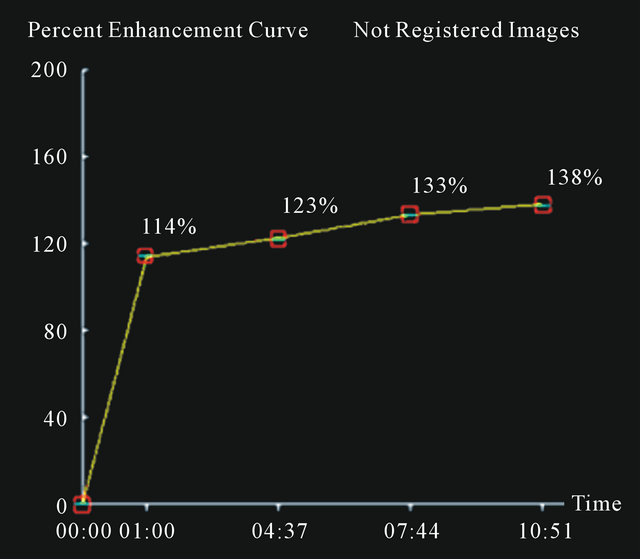 (b)
(b)
Figure 2. A false negative case of IDC (a) with a curve type I (b) using 3% or 5% as cut-off.
4. DISCUSSION
Qualitative assessment of uncertain (type II) time-intensity curves (TICs) in breast DCE-MRI is problematic and operator dependent. The aim of this work is to evaluate if a semi-quantitative assessment of uncertain TICs could improve overall diagnostic performance.
To this aim we retrospectively evaluated 49 lesions that were histologically or cytologically proven but were qualitatively classified as uncertain (type II).
The method we used for semi-quantitative re-classification was inspired by the work of El Khouli et al. [19]. As reported in Tables 2 and 3, after re-classification a number of TICs was correctly classified.
 (a)
(a)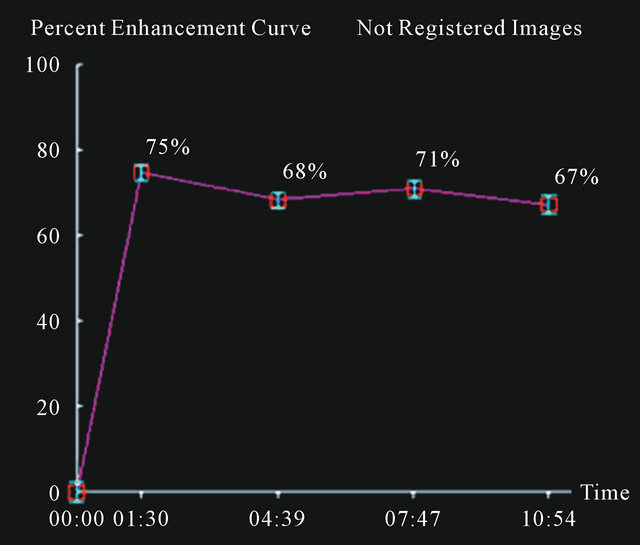 (b)
(b)
Figure 3. A false positive case of fibroadenoma with a curve type III using 3% as cut-off.
It should be noticed that our work has been inspired by [19]. However, our work is different from [19] and is an extension of it because we considered several cut-off ranges in order to estimate the optimal cut-off; moreover, we concentrated only on uncertain cases, while [19] analysed a mixed group of patients. The study by El Khouli et al. [19] showed SEN, SPE, NPV and PPV of 92.3%, 64%, 70% and 90% respectively evaluating each type of curve (I-II-III), while plateau curves showed a PPV of 67% [19]. It should be emphasised however, that they analysed a large group of subjects including type I type II and type III TICs.
Of course, large difficulties in the differentiation of benign or malignant lesions are found when a rapid contrast increase is followed by a plateau phase. This is why we systematically analysed type II TICs to understand if the qualitative method could be improved by a semiquantitative approach.
Being greatly operator dependent, qualitative assess-
 (a)
(a)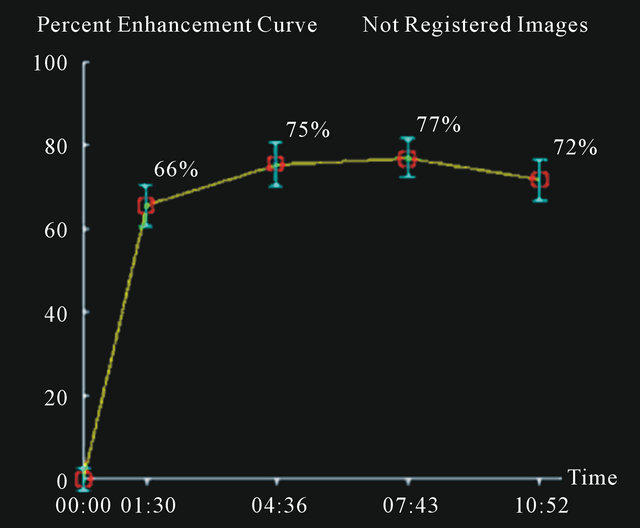 (b)
(b)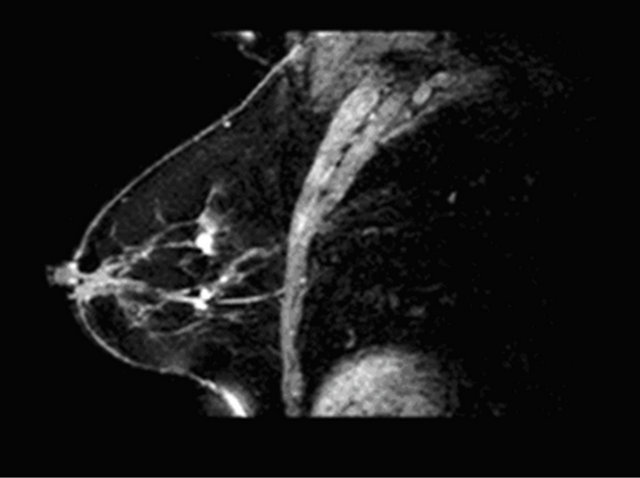 (c)
(c)
Figure 4. A case of fibroadenoma (a), (c) with correct classification semi-quantitative analysis: curve type I (b).
ment of time-intensity curves in breast DCE-MRI is not considered an objective approach for diagnosis or therapy response assessment [4,17]. In the last two decades, several experimental studies have demonstrated that quantitative methods (based on tracer kinetics modelling) can be more specific in distinguishing benign from malignant breast disease, because of the capability to derive parameters strictly related to tissue microvasculature without any operator dependency [19,20-24,28-41]. However, as there is not yet sufficient standardisation of quantitative methods, semi-quantitative approaches have been used because they could represent a compromise between qualitative and quantitative approaches.
As a general concern, DCE-MRI can achieve very high sensitivity but moderate and highly varied specificity in detecting breast cancer: reported value range from 37% up to 90% [14,15].
A cause of possible misinterpretations is the heterogeneity of TICs within a lesion. A malignant tumour may well enhance with type I and type II shapes but heterogeneous nature of enhancement and variety of curve shapes in different anatomical areas is strongly suggestive of malignancy [8,16], reflecting a polymorphous cell population and tumour necrosis. Therefore a heterogeneous lesion must be ROI-averaged in order to gather information that is representative of the whole lesion. However, this issue can contribute to cause false negative cases, as in our population.
The major problem consists, in fact, in missing breast cancer detection and multiple reports have documented false-negative cases, not only of non-invasive cancer, but also of invasive ductal and lobular cancer with rates from 4% to 12% [41].
To overcome this limit in heterogeneous lesions there were placed different ROI in maximum contrast enhancement different points for each patient.
Other false negative cases were caused by atypical enhancement pattern of some lesions. ILC with a diffuse growth pattern appearing as a non mass-like enhancement may exhibit low-magnitude and persistent-enhancement kinetics possibly associated with weak angiogenic activity. Similarly, the patterns of enhancement kinetics are unreliable for diagnosis of DCIS; only about 70% of DCIS exhibit fast, initial enhancement, with variable delayed-phase enhancement patterns [13,14].
Difficulties arise with the diagnosis of “borderline” lesions (lesions of uncertain malignancy) according to the United Kingdom National Health Service Breast Screening program or those that are “probably benign” according to the Breast Imaging Reporting and Data System lexicon (MRI-BIRADS) [31]. Typical borderline lesions are atypical ductal hyperplasia (ADH), atypical lobular hyperplasia (ALH), lobular carcinoma in situ, papillary lesions, radial sclerosing lesions, fibroepithelial lesions, mucocele like lesions and columnar cell lesions [10].
These lesions appear classically with an intermediate kinetic curve type and thus can be classified as MRI BI-RADS category III. The problem consists in doubt persistence and uncertain diagnosis. In our analysis these lesions presented a type II curve at qualitative analysis, but they became type I or type III at semi-quantitative analysis obtaining a more selective classification of these lesions.
Therefore the semi-quantitative approach could achieve more specific attribution of curve type confirmed by the hystopathologic diagnosis.
These results demonstrate it was possible contribute to a more precise assignation in differential diagnose of borderline lesions also and in reducing the number of excision biopsies of these lesions.
Limits of our study are the small number of cases and those intrinsic of a retrospective study and a semi-quantitative assessment of data. Moreover it was adopted only a semi-quantitative parameter (the absolute wash-out percentage-enhancement difference) compared with other authors that used the wash-out slope also [17]. Instead in the same way, we did not include morphologic features of lesions, to isolate the effect of the semi-quantitative method.
A future application should be a new classification of kinetic curves through pharmacokinetic models that might be more accurate in evaluating response chemotherapy and monitoring follow-up of breast cancer.
5. CONCLUSIONS
Our study shows that semi-quantitative assessment represents a method in DCE-MRI kinetic curves evaluation and could improve diagnostic performance of type II TICs.
Exclusion of cancer on qualitative or quantitative kinetic curve enhancement assessment may lead to high false negative rates, therefore the most accurate diagnostic approach on breast DCE-MRI is the combined analysis of morphologic and dynamic pattern, since neither alone is decisive to make differential diagnosis in breast cancer. However also this matched evaluation could be not conclusive and could become a real challenge in those lesions with intermediate characteristics of malignancy.
![]()
![]()
REFERENCES
- Ojeda-Fournier, H., Choe, K.A. and Mahoney, M.C. (2007) Recognizing and interpreting artifacts and pitfalls in MR imaging of the breast. Radiographics, 27, S147-S164. doi:10.1148/rg.27si075516
- Moon, M., Cornfeld, D. and Weinreb, J. (2009) Dynamic contrast-enhanced breast MR imaging. Magnetic Resonance Imaging Clinics of North America, 17, 351-362. doi:10.1016/j.mric.2009.01.010
- Orel, S. (2008) Who should have breast magnetic resonance imaging evaluation? Journal of Clinical Oncology, 26, 703-711. doi:10.1200/JCO.2007.14.3594
- Kuhl, C.K., et al. (1999) Dynamic breast MR imaging: Are signal intensity time course data useful for differential diagnosis of enhancing lesions? Radiology, 211, 101- 110.
- Macura, K.F., Ouwerkerk, R., Jacobs, M.A. and Bluemke, D.A. (2006) Patterns of enhancement on breast MR images: Interpretation and imaging pitfalls. Radiographics, 26, 1719-1734. doi:10.1148/rg.266065025
- Evelhoch, J.L. (1999) Key factors in the acquisition of contrast kinetic data for oncology. Journal of Magnetic Resonance Imaging, 10, 254-259. doi:10.1002/(SICI)1522-2586(199909)10:3<254::AID-JMRI5>3.0.CO;2-9
- Goto, M., et al. (2007) Diagnosis of breast tumors by contrast-enhanced MR Imaging: comparison between the diagnostic performance of dynamic enhancement patterns and morphologic features. Journal of Magnetic Resonance Imaging, 25, 104-112. doi:10.1002/jmri.20812
- Siegmann, K.C., et al. (2002) MR Imaging-detected breast lesions: Histopathologic correlation of lesion characteristics and signal intensity data. American Journal of Roentgenology, 178, 1403-1409. doi:10.2214/ajr.178.6.1781403
- Hara, M., Watanabe, T., Okumura, A., et al. (2009) Angle between 1 and 4 min gives the most significant difference in time-intensity curves between benign disease and breast cancer: Analysis of dynamic magnetic resonance imaging in 103 patients with breast lesions. Clinical Imaging, 33, 335-342. doi:10.1016/j.clinimag.2008.12.001
- Pediconi, F., et al. (2010) Role of breast MR imaging for predicting malignancy of histologically borderline lesions diagnosed at core needle biopsy: Prospective evaluation. Radiology, 257, 653-661. doi:10.1148/radiol.10100732
- Baltzer, P.A.T., Renz, D.M., Kullnig, P.E., et al. (2009) Application of computer-aided diagnosis (CAD) in MRmammography (MRM): Do we really need whole lesion time curve distribution analysis? Academic Radiology, 16, 435-442. doi:10.1016/j.acra.2008.10.007
- Vassiou, K., Kanavou, T., Vlychou, M., et al. (2009) Characterization of breast lesions with CE-MR multimodal morphological and kinetic analysis: Comparison with conventional mammography and high-resolution ultrasound. European Journal of Radiology, 70, 69-76. doi:10.1016/j.ejrad.2008.01.012
- Leinsinger, G., et al. (2006) Cluster analysis of signalintensity time course in dynamic breast MRI: Does unsupervised vector quantization help to evaluate small mammographic lesions? European Radiology, 16, 1138-1146. doi:10.1007/s00330-005-0053-9
- Pediconi, F., Catalano, C., Padula, S., Roselli, A., Dominelli, V., Cagioli, S., Kirchin, M.A., Pirovano, G. and Passariello, R. (2008) Contrast-enhanced MR mammography: Improved lesion detection and differentiation with gadobenate dimeglumine. American Journal of Roentgenology, 191, 1339-1346. doi:10.2214/AJR.07.3533
- Jansen, S.A., Fan, X., Karczmar, G.S., et al. (2008) DCEMRI of breast lesions: It kinetic analysis equally effective for both mass and nonmass-like enhancement? Medical Physics, 35, 3102-3109. doi:10.1118/1.2936220
- Karahaliou, A., Vassiou, K., Arikidis, N.S., Skiadopoulos, S., Kanavou, T. and Costaridou, L. (2010) Assessing heterogeneity of lesion enhancement kinetics in dynamic contrast-enhanced MRI for breast cancer diagnosis. British Journal of Radiology, 83, 296-309. doi:10.1259/bjr/50743919
- Yoo, J.L., Woo, O.H., Kim, Y.K., Cho, K.R., Yong, H.S., Seo, B.K., Kim, A. and Kang, E.Y. (2010) Can MR imaging contribute in characterizing well-circumscribed breast carcinomas? Radiographics, 30, 1689-1702. doi:10.1148/rg.306105511
- Agrawal, G., Su, M.Y., Nalcioglu, O., Feig, S.A. and Chen, J.H. (2009) Significance of breast lesion descriptor in the ACR BI-RADS MRI lexicon. Cancer, 115, 1363- 1380. doi:10.1002/cncr.24156
- El Khouli, R.H., Macura, K.J., Jacobs, M.A., Khalil, T.H., Kamel, I.R., Dwyer, A. and Bluemke, D.A. (2009) Dynamic contrast-enhanced MRI of the breast: Quantitative method for kinetic curve type assessment. American Journal of Roentgenology, 193, W295-W300. doi:10.2214/AJR.09.2483
- Sansone, M., Fusco, R., Petrillo, A., Petrillo, M. and Bracale, M. (2011) An expectation-maximisation approach for simultaneous pixel classification and tracer kinetic modelling in dynamic contrast enhanced-magnetic resonance imaging. Medical & Biological Engineering & Computing, 49, 485-495. doi:10.1007/s11517-010-0695-x
- Fusco, R., Sansone, M., Petrillo, M. and Petrillo, A. (2012) Influence of parameterization on tracer kinetic modeling in DCE-MRI. Journal of Medical and Biological Engineering, in press.
- Fusco, R., Sansone, M., Maffei, S. and Petrillo, A. (2012) Dynamic contrast-enhanced MRI in breast cancer: A comparison between distributed and compartmental tracer kinetic models. Journal of Biomedical Graphics and Computing, 2, 23-36. doi:10.5430/jbgc.v2n2p23
- Fusco, R., Sansone, M., Sansone, C. and Petrillo, A. (2012) Segmentation and classification of breast lesions using dynamic and textural features in dynamic contrast enhanced-magnetic resonance imaging. 25th International Symposium on Computer-Based Medical Systems (CBMS), Naples, 20-22 June 2012, 1-4.
- Fusco, R., Sansone, M., Petrillo, A. and Sansone, C. (2012) A multiple classifier system for classification of breast lesions using dynamic and morphological features in DCE-MRI. Structural, Syntactic, and Statistical Pattern Recognition. Lecture Notes in Computer Science, 7626, 684-692. doi:10.1007/978-3-642-34166-3_75
- Schisterman, E.F., Perkins, N.J., Liu, A. and Bondell, H. (2005) Optimal cut-point and its corresponding Youden Index to discriminate individuals using pooled blood samples. Epidemiology, 16, 73-81. doi:10.1097/01.ede.0000147512.81966.ba
- Obuchowski, N.A. (2005) ROC analysis. American Journal of Roentgenology, 184, 364-372. doi:10.2214/ajr.184.2.01840364
- Joseph, L. and Reinhold, C. (2005) Statistical inference for proportions. American Journal of Roentgenology, 184, 1057-1064. doi:10.2214/ajr.184.4.01841057
- Hawass, N.E. (1997) Comparing the sensitivities and specificities of two diagnostic procedures performed on the same group of patients. British Journal of Radiology, 70, 360-366.
- Kuhl, C. (2007) The current status of breast MR imaging. Part I. Choice of technique, image interpretation, diagnostic accuracy, and transfer to clinical practice. Radiology, 244, 356-378. doi:10.1148/radiol.2442051620
- Meyer-Baese, A., et al. (2008) Computer-aided diagnosis and visualization based on clustering and independent component analysis for breast MRI. International Conference on Image Processing, 12, 3000-3003.
- El Khouri, C., Tardivon, A., Thibault, F., Barreau, B. and Neuenshwander, S. (2007) Comment je fais une IRM mammaire? Journal de Radiologie, 88, 694-700. doi:10.1016/S0221-0363(07)89880-5
- Molleran, V. and Mahoney, M. (2010) The BI-RADS breast magnetic resonance imaging lexicon. Magnetic Resonance Imaging Clinics of North America, 18, 171-185. doi:10.1016/j.mric.2010.02.001
- Eby, P.R., et al. (2009) Characteristics of probably benign breast MRI lesions. American Journal of Roentgenology, 193, 861-867. doi:10.2214/AJR.08.2096
- Jansen, S.A., Fan, X., Medved, M., et al. (2010) Characterizing early contrast uptake of ductal carcinoma in situ with high temporal resolution dynamic contrast-enhanced MRI of the breast: A pilot study. Physics in Medicine and Biology, 55, 473-485. doi:10.1088/0031-9155/55/19/N02
- Nishiura, M., Tamaki, Y. and Murase, K. (2010) Differentiation between ductal carcinoma in situ and mastopathy using contrast-enhanced magnetic resonance imaging and a model of contrast enhancement. European Journal of Radiology, 80, 740-743. doi:10.1016/j.ejrad.2010.09.039
- Fernández-Guinea, O., Andicoechea, A., González, L.O., González-Reyes, S., Merino, A.M., Hernández, L.C., LópezMuñiz, A., García-Pravia, P. and Vizoso, F.J. (2010) Relationship between morphological features and kinetic patterns of enhancement of the dynamic breast magnetic resonance imaging and clinico-pathological and biological factors in invasive breast cancer. BMC Cancer, 10, 8. doi:10.1186/1471-2407-10-8
- Jansen, S.A., Shimauchi, A., Zak, L., Fan, X., Wood, A.M., Karczmar, G.S. and Newstead, G.M. (2009) Kinetic curves of malignant lesions are not consistent across MRI systems: Need for improved standardization of breast dynamic contrast-enhanced MRI acquisition. American Journal of Roentgenology, 193, 832-839. doi:10.2214/AJR.08.2025
- Schnall, M.D., Blume, J., Bluemke, D.A., DeAngelis, G.A., DeBruhl, N., Harms, S., Heywang-Köbrunner, S.H., Hylton, N., Kuhl, C.K., Pisano, E.D., Causer, P., Schnitt, S.J., Thickman, D., Stelling, C.B., Weatherall, P.T., Lehman, C. and Gatsonis, C.A. (2006) Diagnostic architectural and dynamic features at breast MR imaging: Multicenter study. Radiology, 238, 42-53. doi:10.1148/radiol.2381042117
- Bhooshan, N., Giger, M.L., Jansen, S.A., Li, H., Lan, L. and New-stead, G.M. (2010) Cancerous breast lesions on dynamic contrast-enhanced MR images: Computerized characterization for image-based prognostic markers. Radiology, 254, 680-690. doi:10.1148/radiol.09090838
- Santamaría, G., Velasco, M., Bargalló, X., Caparrós, X., Farrús, B. and Luis Fernández, P. (2010) Radiologic and pathologic findings in breast tumors with high signal intensity on T2-weighted MR images. Radiographics, 30, 533-548. doi:10.1148/rg.302095044
- Peters, N.H., Borel Rinkes, I.H., Zuithoff, N.P., Mali, W.P., Moons, K.G. and Peeters, P.H. (2008) Metaanalysis of MR imaging in the diagnosis of breast lesions. Radiology, 246, 116-124. doi:10.1148/radiol.2461061298